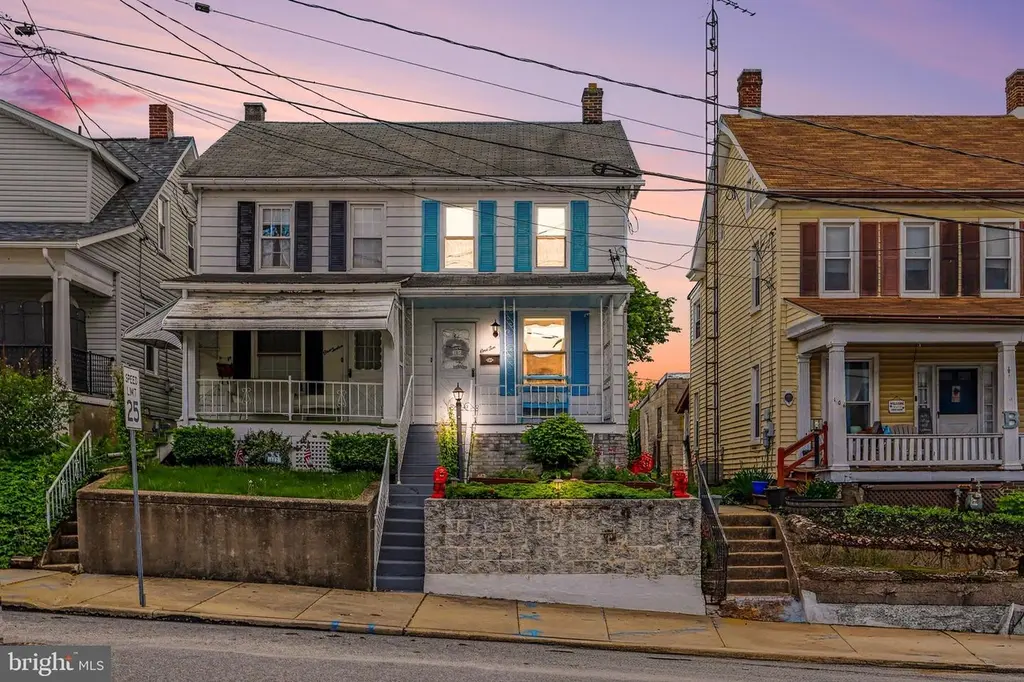
110 S Charles St · Red Lion, PA
Flood risk 1/10 · Minimal
- FEMA flood zone
- X (unshaded)
- Chance of flooding over 30 yrs
- 0.0%
- Est. flood insurance / yr
- $473 – $860
Fire risk 1/10 · Minimal
- Est. fire insurance / yr
- $511 – $949
Heat risk 5/10 · Moderate
- Hot days now (above 100°F)
- 7 days/yr
- Hot days in 30 yrs
- 15 days/yr
Wind risk 4/10 · Minor
- Chance of severe wind over 30 yrs
- 12.0%
Air-quality risk 3/10 · Minor
- Unhealthy air days now
- 2 days/yr
- Unhealthy air days in 30 yrs
- 5 days/yr
Risk factors via First Street. Map © Google.
Why this score? — see what drove the C- grade
The composite is a weighted blend of 9 inputs, each scored 0–100. Each bar is that input's sub-score; the figure is the points it added to the 100-point composite (weight × sub-score).
- Cash flow +18.5/30.0
- ARV discount +11.3/15.0
- DSCR +5.8/10.0
- 1% rule +4.9/10.0
- Livability +3.9/5.0
- Schools +3.8/10.0
- Rent growth +2.5/5.0
- Condition / age +2.5/5.0
- Appreciation +0.0/10.0
$150,000
🖨 Deal sheet 📄 Offer letter ✓ Due diligence
Listing remarks MLS
Move right into this affordable semi that backs up to Fairmont Park and is just as cute as they come. Very open and bright with new laminate wood floors in the updated kitchen and den, berber carpet upstairs & bath totally remodeled. All appliances included and AHS Warranty included, as well.
Key facts
- Semi detached home
- 3 parking spots
- Built 1925
Tags
Property features AI
Finance
- Other: Ownership: Fee simple; Pets allowed with no restrictions; Property assessed per assessor
Exterior
- Parking: Three total garage/parking spaces; Driveway space for one vehicle; Two off-street spaces
- Utilities: Public water; Public sewer; 100 Amp electric service; Natural gas for heating and hot water; Cable internet/TV available; Municipal trash service
- Home design: Semi-detached property; Three levels; Main entrance faces south
- Construction: Vinyl and aluminum siding; Block and brick/mortar foundation; Asphalt roof; Double-hung, double-pane windows; Building not winterized; Year built (per assessor)
- Exterior features: Not in a federal flood zone; Two or more access/exit points; Above-grade and below-grade structures
Interior
- Kitchen: Cooktop; Single oven; Electric range/oven; Dishwasher
- Bedrooms: Two bedrooms on the main level
- Flooring: Carpet
- Bathrooms: One full bathroom (includes one full on main level)
- Heating & cooling: Central heating (natural gas); Window cooling units
- Interior features: Attic; Traditional floor plan
- Laundry & utility: Laundry in the basement
Neighborhood map
What this means for you Summary
Snapshot
- This is a 3-bed/1.0-bath townhouse listed at $150k.
Deal economics
- At list price, monthly cash flow is $142 ($2k/yr) — positive.
- The deal already cash-flows at list — no discount required.
- To meet the 1% rule (rent ≥ 1% of price), the offer needs to be $149k (1.0% below list).
- Recommended offer: $149k (1.0% below list) — sets the bar for 1% rule.
- Cap rate 7.4% vs local median 4.5% in Red Lion — top-decile yield for the area; either an underpriced asset or a hidden risk that comps aren't pricing in. Stress-test before assuming the spread holds.
Location & tenants
- Location reads 77/100 on livability (#349 in PA, #3,056 nationally) — a middle-class / working-renter tenant base. Strengths: cost of living A+, housing A+, health & safety A+; Watch: amenities D, commute F.
- Red Lion Area SD (suburban): math 36% / reading 50% proficiency, ranked #282 of 539 in PA (top 52%) — families likely to look elsewhere, expect single-tenant / working-renter base with shorter leases.
- Market conditions: 147 active listings in the ZIP; 4 comparable units currently listed for rent nearby; rentals lingering (median 44d on market — plan ~5-8 weeks vacancy on turnover, expect pricing pressure); 50% of comp listings sitting > 30 days — soft ceiling on asking rent; solid renter incomes; 1,328 units permitted in York County in 2024 (338 in 5+ unit buildings).
Forward outlook
- Local home prices are declining (-3.0%/yr); year-one equity from $1k of loan paydown is wiped out by about $4k of value loss. Plan a longer hold.
Negotiation context
- Only 5 days on market — expect competitive offers; lowballing is unlikely to land.
- 3 sale attempts since 28y ago with the ask held roughly flat each time — persistent listings suggest the price (not the market) is what's stuck; bring a comps-based counter.
- Current owner paid $113k; 33% above their basis — modest negotiation headroom, anchor on the comps not their cost.
Risks & watch-outs
- Watch-outs: built in 1925 — expect roof / HVAC / electrical / plumbing capex.
- Climate carrying-cost: extreme-heat days projected 7→15/yr by 2055 (HVAC capex compounding) — expect insurance premiums to compound above CPI over the hold.
Questions for the listing agent
- Built in 1925 — when were the roof, HVAC, electrical panel, plumbing, and water heater last replaced?
- Is there a deadline driving the sale (1031 exchange, divorce, estate, relocation)? That informs how much negotiation room exists.
- What's the average days-on-market for RENTAL listings here right now (not sales)? A rising rental-DOM trend means longer vacancies and softer asking-rent achievability than the comps imply.
- What's the recent tenant-quality profile in this submarket — average credit score on applications, eviction rate, late-payment / NSF rate, and stable-employment percentage? A property-management company in the area should have these aggregated.
- How much new for-sale + rental construction is in the pipeline within 1–3 miles? Heavy new supply typically softens prices + rents 12–24 months out; constrained supply supports both.
Investment metrics
- 1% rule
- 0.99% ✗
- Cap rate
- 7.43%
- Cash-on-cash
- 4.05%
- DSCR
- 1.18
- GRM
- 8.4
CMA / ARV
- ARV (on-the-fly)
- $163,856
- Comps found
- 12
Show comp detail 12 sales within ~0.75 mi
| Address | Dist | Beds/Ba | Sqft | Sold | Price | $/sf | Match |
|---|---|---|---|---|---|---|---|
| 121 Householder Ave | 0.25mi | 3/1.0 | 1,042 (-2%) | 18mo | $79,000 | $76 | 70 |
| 357 Country Clb #26 | 0.30mi | 2/2.0 (-1) | 1,080 (+2%) | 8mo | $170,000 | $157 | 68 |
| 122 N Main St | 0.34mi | 3/1.0 | 1,176 (+10%) | 1mo | $150,000 | $128 | 66 |
| 213 1st Ave | 0.23mi | 2/1.5 (-1) | 1,040 (-2%) | 18mo | $149,900 | $144 | 63 |
| 301 Country Club Rd #301 | 0.30mi | 2/1.5 (-1) | 1,008 (-5%) | 9mo | $159,990 | $159 | 63 |
| 338 Atlantic Ave | 0.35mi | 3/1.5 | 1,194 (+12%) | 7mo | $154,900 | $130 | 56 |
| 653 W Broadway | 0.46mi | 3/1.0 | 1,176 (+10%) | 11mo | $182,000 | $155 | 52 |
| 651 W Broadway | 0.45mi | 3/2.0 | 1,176 (+10%) | 12mo | $199,500 | $170 | 47 |
| 321 E Lancaster St | 0.54mi | 2/1.5 (-1) | 1,140 (+7%) | 15mo | $185,000 | $162 | 43 |
| 382 Cherry St #382 | 0.54mi | 3/1.5 | 1,200 (+13%) | 13mo | $180,000 | $150 | 41 |
| 329 Cherry St #8 | 0.55mi | 2/1.5 (-1) | 1,210 (+14%) | 16mo | $185,000 | $153 | 32 |
| 352 Cherry St #352 | 0.54mi | 2/1.5 (-1) | 1,200 (+13%) | 21mo | $185,000 | $154 | 29 |
Match score weights: distance 35% · size 25% · config 20% · recency 20%. Top-matched comps best support the ARV.
Projected returns pro-forma
-3.0% appreciation · 3.0% rent growth · sell at horizon
- IRR
- -9.9%
- Equity multiple
- 0.64×
- Total profit
- $-15,263
- Equity at exit
- $22,365
- IRR
- -0.5%
- Equity multiple
- 0.96×
- Total profit
- $-1,592
- Equity at exit
- $12,969
Cash invested: $42,000 (down + closing). Projections, not guarantees.
Landlord ↔ Tenant lean methodology
- Overall (STATE)
- 62 Landlord-Friendly
- State Pennsylvania
- 62 Landlord-Friendly · EVEN
- County
- — inherits STATE
- City
- — inherits STATE
ZIP-level market 17356
- Home prices YoY
- -21.0%
- Active inventory
- 147
- Price-to-rent
- 8.4×
Monthly cashflow live
- Estimated rent
- $1,486 medium interval (Pro) →
- Mortgage (P&I)
- −$787
- Tax from tax record
- −$183 /mo · $2,194/yr
- Insurance
- −$62
- HOA
- −$0
- Vacancy / Maint / Mgmt
- −$312
- Net cashflow
- $142
Break-even live
UW: 25.0% down · 7.5% · 30yr · 1.5% tax · 5.0% vac · 8.0% maint · 8.0% mgmt
Financing live
Cash to close
- Down payment
- $37,500
- Closing costs
- $4,500
- Reserves months
- —
- Total cash needed
- —
Loan-product check · same deal, 3 products live
Conventional
25% down · 7.5% · 30yr
- Down + closing
- —
- Monthly P&I
- —
- Monthly cashflow
- —
- DSCR
- —
- Eligible?
- —
Personal DTI + credit; lowest rate.
DSCR
20% down · 8.5% · 30yr
- Down + closing
- —
- Monthly P&I
- —
- Monthly cashflow
- —
- DSCR
- —
- Eligible?
- —
No personal income docs; deal must DSCR.
Hard money
10% down · 12.0% · 12mo
- Down + closing
- —
- Monthly P&I
- —
- Monthly cashflow
- —
- DSCR
- —
- Eligible?
- —
Short-term bridge; refi at stabilization.
Rent comps 4 comps
| Address | Beds | Baths | Sqft | Rent | $/sqft | DOM | Units | Dist |
|---|---|---|---|---|---|---|---|---|
| 305 W Broadway Red Lion, PA | 2.0 | 1.0 | 968 | $1,395 | $1.44 | 43d | 1 | 0.16mi |
| 21 E Lancaster St Red Lion, PA | 2.0 | 1.0 | 900 | $1,295 | $1.44 | 43d | 1 | 0.28mi |
| 16 W High St Red Lion, PA | 3.0 | 1.0 | 1075 | $1,075 | $1.00 | 21d | 1 | 0.31mi |
| 201 Burrows Rd Red Lion, PA | 3.0 | 2.5 | 1485 | $1,924 | $1.30 | 13d | 1 | 0.99mi |
Listing history 10 events
-
2026-05-12status Pending
-
2026-05-07$150,000 Active
-
2026-05-07historical $150,000
-
2009-09-16soldstatus $112,900
-
2009-09-15soldstatus $112,900 299-char remark
Show marketing remark (299 chars)
Move right into this affordable semi that backs up to Fairmont Park and is just as cute as they come. Very open and bright with new laminate wood floors in the updated kitchen and den, berber carpet upstairs & bath totally remodeled. All appliances included and AHS Warranty included, as well.
-
2009-04-24$112,900 299-char remark
Show marketing remark (299 chars)
Move right into this affordable semi that backs up to Fairmont Park and is just as cute as they come. Very open and bright with new laminate wood floors in the updated kitchen and den, berber carpet upstairs & bath totally remodeled. All appliances included and AHS Warranty included, as well.
-
1999-08-27soldstatus $62,900
-
1999-08-26soldstatus $62,900 338-char remark
Show marketing remark (338 chars)
METICULOUSLY KEPT LUXURIOUSLY FINISHED OPEN PLAN, VERY ATTRACTIVE. SECOND FLOOR ROOMS ARE RAILROAD ARRANGEMENT WITH STAIRS TO MIDDLE ROOM AND BATH IN MASTER BEDROOM. ONLY UPSTAIRS ROOM HEATED IS BATH. ADEQUATE INSULATION ASSURES COMFORT AND A DOOR MAY CLOSE OFF UPSTAIRS. ATTIC IS CARPETED. PORCHES ON FRONT AND BOTH LEVELS ON THE BACK. |
-
1999-07-03historical 338-char remark
Show marketing remark (338 chars)
METICULOUSLY KEPT LUXURIOUSLY FINISHED OPEN PLAN, VERY ATTRACTIVE. SECOND FLOOR ROOMS ARE RAILROAD ARRANGEMENT WITH STAIRS TO MIDDLE ROOM AND BATH IN MASTER BEDROOM. ONLY UPSTAIRS ROOM HEATED IS BATH. ADEQUATE INSULATION ASSURES COMFORT AND A DOOR MAY CLOSE OFF UPSTAIRS. ATTIC IS CARPETED. PORCHES ON FRONT AND BOTH LEVELS ON THE BACK. |
-
1998-12-14$62,900 338-char remark
Show marketing remark (338 chars)
METICULOUSLY KEPT LUXURIOUSLY FINISHED OPEN PLAN, VERY ATTRACTIVE. SECOND FLOOR ROOMS ARE RAILROAD ARRANGEMENT WITH STAIRS TO MIDDLE ROOM AND BATH IN MASTER BEDROOM. ONLY UPSTAIRS ROOM HEATED IS BATH. ADEQUATE INSULATION ASSURES COMFORT AND A DOOR MAY CLOSE OFF UPSTAIRS. ATTIC IS CARPETED. PORCHES ON FRONT AND BOTH LEVELS ON THE BACK. |
ⓘ Source: listings_history table (triggers on properties + properties_extension) + one-shot
backfill from property_details.listing_events for pre-trigger history.
Tax reassessment forecast PA · Partial reset (capped growth)
- Current annual tax
- $2,194 · $183/mo
- Projected year-2 tax
- $2,282 · $190/mo
- Expected delta
- +$88/yr (+$7/mo · 4.0%)
ⓘ Screening estimate from a state-policy table — verify with the county assessor before closing.
Climate risk First Street
- Flood 1/10 Low FEMA zone X (unshaded) · 0% chance over 30 yrs
- Wildfire 1/10 Low
- Heat 5/10 Major 7 d/yr ≥100°F today · 15 d/yr by 30 yrs out
- Wind 4/10 Moderate 12% chance of damaging wind over 30 yrs
- Air quality 3/10 Moderate 2 unhealthy d/yr today · 5 by 30 yrs out
Nearby sold comps map
Loading sold comps map…
Walkable amenities ~0.75 mi
Loading nearby amenities…
Taxation est. · year 1
- Rental income
- $17,827
- − Mortgage interest
- −$8,402
- − Property taxes
- −$2,194
- − Insurance
- −$750
- − Repairs & maintenance
- −$1,426
- − Management
- −$1,426
- − Depreciation
- −$4,364
- Taxable loss
- −$735
- Est. tax savings @ 24.0%
- +$176
- After-tax cash flow
- $1,877/yr
For passive investors: Depreciation is non-cash, so a rental often shows a tax loss while cash-flowing — sheltering income. Rental losses are passive: they offset passive income freely, and up to $25,000/yr can offset ordinary (W-2) income if you actively participate and your MAGI is under $100k (phasing out to $0 by $150k); unused losses carry forward. On sale, claimed depreciation is recaptured at up to 25%, and gains may owe capital-gains tax (a 1031 exchange can defer both). Figures are a year-1 estimate at your 24.0% rate — not tax advice; consult a CPA.
Schools (NCES district)
- District
- Red Lion Area SD
- NCES district ID
- 4220100
- Math proficiency
- 36% ▼ -10.00%
- Reading proficiency
- 50% ▼ -10.00%
- Median HH income
- $60,225
- Composite
- 37.91/100
- National rank
- #4313
- State rank
- #282 of 539 in PA
Livability — Red Lion
- Score
- 77/100
- State rank
- #349
- US rank
- #3056
Category grades
Schools grade is shown separately in the Schools card above.
Census & demographics
- Census place
- Red Lion, PA
- County
- York County · 278,806 people
- City population
- 22,869
- Metro
- York-Hanover, PA
- Population (ZIP)
- 22,869
- Household income
- $86,561
- Rent vs Own
- Severe rent burden
- 559.0
Population outlook (York County) Hauer SSP2
- Today (2025)
- 454,205 people
- By 2030
- 457,407 · +0.7%
- By 2040
- 457,529 · +0.7%
- By 2050
- 448,261 · -1.3%
- By 2075
- 427,388 · -5.9%
- By 2100
- 384,218 · -15.4%
Race, ethnicity, and origin ACS 2023
- Neighborhood character
- Predominantly White (89%)
- Race & ethnicity
- White 89% Black 4% Two or more races 4% Asian 2% Hispanic / Latino 2%
- Common ancestry
- Romanian 3% Slovak 3% Serbian 2%
- Foreign-born
- 4% · China
- Languages at home
- 95% English-only · Russian/Polish/Slavic 1% Chinese 1% Other Indo-European 1%
Political lean MEDSL · York
- 2024 margin
- Strong R (+25.3) · D 36.9% · R 62.1%
- 2008→2024 swing
- -11.7pp toward R · 2008: -13.6pp · 2024: -25.3pp
- All cycles
- 2024: R+25.3 2020: R+24.6 2016: R+29.3 2012: R+21.2 2008: R+13.6
Not yet ingested
- Civics
- —
Market trends
- HPI YoY
- ▼ -69.16%
- Current HPI
- 259.7294
- Rent YoY
- —
- Metro
- York-Hanover, PA
- State GDP YoY
- ▲ 1.68%
- F500 in state
- 34
Industry mix (Fortune 500 HQ in PA)
| Industry | F500 HQs | Revenue |
|---|---|---|
| Healthcare | 2 | $309B |
|
||
| Insurance | 2 | $27B |
|
||
| Telecommunications / Media | 1 | $124B |
|
||
| Industrial Distribution | 1 | $22B |
|
||
| Financial Services | 1 | $20B |
|
||
| Chemicals / Materials | 1 | $18B |
|
||
Price history
+138.5% since first listed10 events — show timeline
- 2026-05-12 Pending — BRIGHT MLS
- 2026-05-07 Listed $150,000 BRIGHT MLS
- 2026-05-07 Coming Soon $150,000 BRIGHT MLS
- 2009-09-16 Sold (Public Records) $112,900 Public Records
- 2009-09-15 Sold (MLS) $112,900 BRIGHT MLS
- 2009-04-24 Listed $112,900 BRIGHT MLS
- 1999-08-27 Sold (Public Records) $62,900 Public Records
- 1999-08-26 Sold (MLS) $62,900 BRIGHT MLS
- 1999-07-03 Listing Removed — BRIGHT MLS
- 1998-12-14 Listed $62,900 BRIGHT MLS
Property tax history
+0.9%/yrLatest (2025): $2,194 · +3.0% YoY. Source: county tax records.
Cash-flow waterfall
monthlySold comps — $/sqft
last 12 mo · ≤1 miLoading sold comps…