52 Weed Rd · Jericho, VT
Flood risk 1/10 · Minimal
- FEMA flood zone
- X (unshaded)
- Chance of flooding over 30 yrs
- 0.0%
- Est. flood insurance / yr
- $473 – $860
Fire risk 1/10 · Minimal
- Est. fire insurance / yr
- $480 – $892
Heat risk 2/10 · Minimal
- Hot days now (above 92°F)
- 7 days/yr
- Hot days in 30 yrs
- 15 days/yr
Wind risk 2/10 · Minimal
- Chance of severe wind over 30 yrs
- 2.0%
Air-quality risk 2/10 · Minimal
- Unhealthy air days now
- 1 days/yr
- Unhealthy air days in 30 yrs
- 1 days/yr
Risk factors via First Street. Map © Google.
Why this score? — see what drove the D grade
The composite is a weighted blend of 9 inputs, each scored 0–100. Each bar is that input's sub-score; the figure is the points it added to the 100-point composite (weight × sub-score).
- Cash flow +14.7/30.0
- ARV discount +7.5/15.0
- Schools +5.0/10.0
- 1% rule +4.5/10.0
- DSCR +4.5/10.0
- Livability +3.7/5.0
- Rent growth +2.5/5.0
- Condition / age +2.5/5.0
- Appreciation +0.0/10.0
$299,000
🖨 Deal sheet 📄 Offer letter ✓ Due diligence
Listing remarks MLS
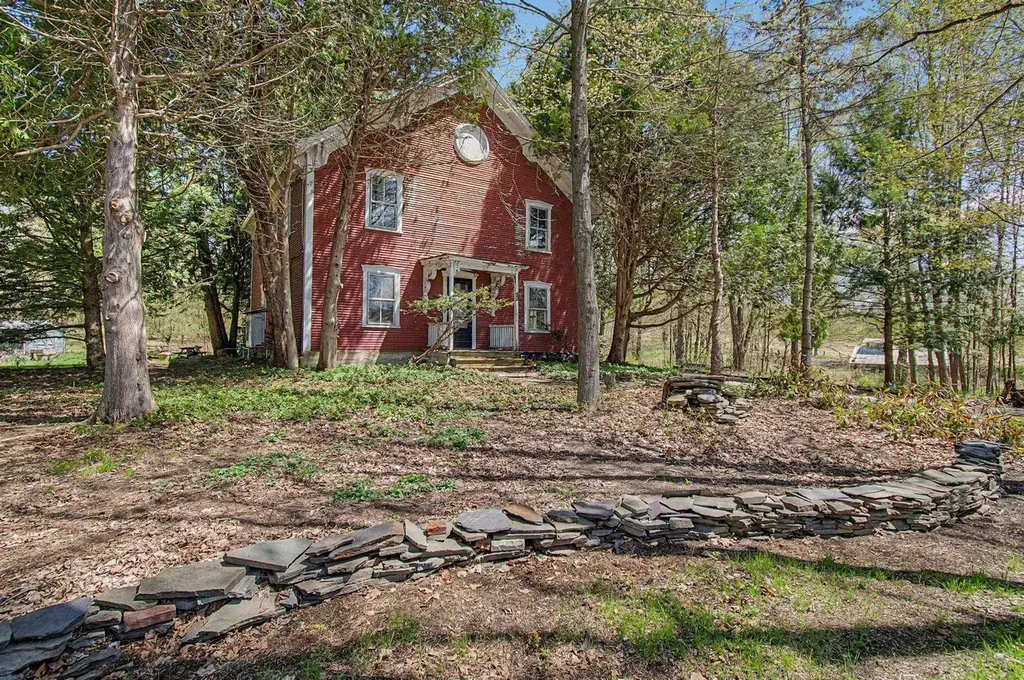
Spectacular opportunity on one of Essex’s most desirable country roads! Set on approximately 4.73 acres across two lots, this property offers exceptional flexibility—whether you’re looking to renovate and expand, create a family compound, or explore the potential with a separate building lot that fronts both Weed Road and Essex Highlands and is approximately 2.57 acres. The existing home features four bedrooms, an open kitchen and dining area, multiple office or craft spaces, and a generous family room ready for reimagining. A walk-up attic provides excellent storage or future expansion potential. Outside, the property shines with mature trees, open space for gardening or recreation, and a peaceful setting that’s increasingly hard to find. Several sheds for storage. A rare chance to invest, build equity, and take advantage of a versatile parcel in a prime Essex location. Please note: the barn across the street is not included in the sale.
Key facts
- Two lots
- Generous family room
- 4.73 acre lot
Tags
Neighborhood map
What this means for you Summary
Snapshot
- This is a 4-bed/2.0-bath single-family listed at $299k.
Deal economics
- At list price, monthly cash flow is $78 ($938/yr) — positive.
- The deal already cash-flows at list — no discount required.
- To meet the 1% rule (rent ≥ 1% of price), the offer needs to be $285k (4.6% below list).
- Recommended offer: $285k (4.6% below list) — sets the bar for 1% rule.
Location & tenants
- Location reads 74/100 on livability (#18 in VT, #4,542 nationally) — a middle-class / working-renter tenant base. Strengths: crime A+, employment A+, housing A+; Watch: cost of living D+, amenities F, commute F.
- Market conditions: 92 active listings in the ZIP; solid renter incomes; 898 units permitted in Chittenden County in 2024 (554 in 5+ unit buildings).
- This rent runs 34% of the median local income ($101k/yr) — at the standard rent-burdened threshold; future hikes will face affordability resistance.
Forward outlook
- Local home prices are declining (-3.0%/yr); year-one equity from $2k of loan paydown is wiped out by about $9k of value loss. Plan a longer hold.
- Chittenden County population projected at +8% by 2050 — modest demand growth; plan on rents tracking national, not racing it.
Negotiation context
- Only 5 days on market — expect competitive offers; lowballing is unlikely to land.
Risks & watch-outs
- Watch-outs: built in 1920 — expect roof / HVAC / electrical / plumbing capex.
Questions for the listing agent
- Built in 1920 — when were the roof, HVAC, electrical panel, plumbing, and water heater last replaced?
- Is there a deadline driving the sale (1031 exchange, divorce, estate, relocation)? That informs how much negotiation room exists.
- Schools are A-rated — typically a magnet for longer-tenancy family renters. What's the average tenant stay here, and is there a school-zone premium baked into asking?
- The area grade is low — what's the realistic commute time and amenity access for the typical tenant pool here? Any planned neighborhood developments (good or bad) we should know about?
- What's the average days-on-market for RENTAL listings here right now (not sales)? A rising rental-DOM trend means longer vacancies and softer asking-rent achievability than the comps imply.
- What's the recent tenant-quality profile in this submarket — average credit score on applications, eviction rate, late-payment / NSF rate, and stable-employment percentage? A property-management company in the area should have these aggregated.
- How much new for-sale + rental construction is in the pipeline within 1–3 miles? Heavy new supply typically softens prices + rents 12–24 months out; constrained supply supports both.
Investment metrics
- 1% rule
- 0.95% ✗
- Cap rate
- 6.61%
- Cash-on-cash
- 1.12%
- DSCR
- 1.05
- GRM
- 8.7
CMA / ARV
- ARV (median comp)
- $732,040
- List price
- $299,000
- Delta
- -59.16%
- Verdict
- UNDERPRICED
- Comps
- 14 within 1.0 mi
Show comp detail 4 sales within ~0.75 mi
| Address | Dist | Beds/Ba | Sqft | Sold | Price | $/sf | Match |
|---|---|---|---|---|---|---|---|
| 15 Essex Highlands | 0.21mi | 3/3.0 (-1) | 2,300 (-9%) | 8mo | $715,000 | $311 | 60 |
| 112 Jericho Rd | 0.59mi | 3/2.0 (-1) | 2,459 (-2%) | 4mo | $427,000 | $174 | 60 |
| 7 Whitcomb Meadows Ln | 0.53mi | 4/2.5 | 2,644 (+5%) | 17mo | $765,500 | $290 | 51 |
| 177 Browns River Rd | 0.68mi | 4/2.0 | 2,504 (-1%) | 22mo | $760,000 | $304 | 49 |
Match score weights: distance 35% · size 25% · config 20% · recency 20%. Top-matched comps best support the ARV.
Projected returns pro-forma
-3.0% appreciation · 3.0% rent growth · sell at horizon
- IRR
- -14.5%
- Equity multiple
- 0.48×
- Total profit
- $-43,363
- Equity at exit
- $44,582
- IRR
- -5.7%
- Equity multiple
- 0.63×
- Total profit
- $-30,903
- Equity at exit
- $25,852
Cash invested: $83,720 (down + closing). Projections, not guarantees.
Landlord ↔ Tenant lean methodology
- Overall (STATE)
- 41 Moderately Tenant-Leaning
- State Vermont
- 41 Moderately Tenant-Leaning · D+15
- County
- — inherits STATE
- City
- — inherits STATE
ZIP-level market 05452
- Active inventory
- 92
- Price-to-rent
- 8.7×
Monthly cashflow live
- Estimated rent
- $2,852 medium interval (Pro) →
- Mortgage (P&I)
- −$1,568
- Tax from tax record
- −$482 /mo · $5,786/yr
- Insurance
- −$125
- HOA
- −$0
- Vacancy / Maint / Mgmt
- −$599
- Net cashflow
- $78
Break-even live
UW: 25.0% down · 7.5% · 30yr · 1.5% tax · 5.0% vac · 8.0% maint · 8.0% mgmt
Financing live
Cash to close
- Down payment
- $74,750
- Closing costs
- $8,970
- Reserves months
- —
- Total cash needed
- —
Loan-product check · same deal, 3 products live
Conventional
25% down · 7.5% · 30yr
- Down + closing
- —
- Monthly P&I
- —
- Monthly cashflow
- —
- DSCR
- —
- Eligible?
- —
Personal DTI + credit; lowest rate.
DSCR
20% down · 8.5% · 30yr
- Down + closing
- —
- Monthly P&I
- —
- Monthly cashflow
- —
- DSCR
- —
- Eligible?
- —
No personal income docs; deal must DSCR.
Hard money
10% down · 12.0% · 12mo
- Down + closing
- —
- Monthly P&I
- —
- Monthly cashflow
- —
- DSCR
- —
- Eligible?
- —
Short-term bridge; refi at stabilization.
Listing history 1 events
-
2026-05-16$299,000 Active 976-char remark
Show marketing remark (976 chars)
Spectacular opportunity on one of Essex’s most desirable country roads! Set on approximately 4.73 acres across two lots, this property offers exceptional flexibility—whether you’re looking to renovate and expand, create a family compound, or explore the potential with a separate building lot that fronts both Weed Road and Essex Highlands and is approximately 2.57 acres. The existing home features four bedrooms, an open kitchen and dining area, multiple office or craft spaces, and a generous family room ready for reimagining. A walk-up attic provides excellent storage or future expansion potential. Outside, the property shines with mature trees, open space for gardening or recreation, and a peaceful setting that’s increasingly hard to find. Several sheds for storage. A rare chance to invest, build equity, and take advantage of a versatile parcel in a prime Essex location. Please note: the barn across the street is not included in the sale.
ⓘ Source: listings_history table (triggers on properties + properties_extension) + one-shot
backfill from property_details.listing_events for pre-trigger history.
Tax reassessment forecast VT · Partial reset (capped growth)
- Current annual tax
- $5,786 · $482/mo
- Projected year-2 tax
- $5,786 · $482/mo
- Expected delta
- $0/yr ($0/mo · 0.0%)
ⓘ Screening estimate from a state-policy table — verify with the county assessor before closing.
Climate risk First Street
- Flood 1/10 Low FEMA zone X (unshaded) · 0% chance over 30 yrs
- Wildfire 1/10 Low
- Heat 2/10 Low 7 d/yr ≥92°F today · 15 d/yr by 30 yrs out
- Wind 2/10 Low 2% chance of damaging wind over 30 yrs
- Air quality 2/10 Low 1 unhealthy d/yr today · 1 by 30 yrs out
Nearby sold comps map
Loading sold comps map…
Walkable amenities ~0.75 mi
Loading nearby amenities…
Taxation est. · year 1
- Rental income
- $34,221
- − Mortgage interest
- −$16,749
- − Property taxes
- −$5,786
- − Insurance
- −$1,495
- − Repairs & maintenance
- −$2,738
- − Management
- −$2,738
- − Depreciation
- −$8,698
- Taxable loss
- −$3,982
- Est. tax savings @ 24.0%
- +$956
- After-tax cash flow
- $1,894/yr
For passive investors: Depreciation is non-cash, so a rental often shows a tax loss while cash-flowing — sheltering income. Rental losses are passive: they offset passive income freely, and up to $25,000/yr can offset ordinary (W-2) income if you actively participate and your MAGI is under $100k (phasing out to $0 by $150k); unused losses carry forward. On sale, claimed depreciation is recaptured at up to 25%, and gains may owe capital-gains tax (a 1031 exchange can defer both). Figures are a year-1 estimate at your 24.0% rate — not tax advice; consult a CPA.
Schools (NCES district)
No district data.
Livability — Jericho
- Score
- 74/100
- State rank
- #18
- US rank
- #4542
Category grades
Schools grade is shown separately in the Schools card above.
Census & demographics
- County
- Chittenden County · 110,603 people
- Metro
- Burlington-South Burlington, VT
- Population (ZIP)
- 22,626
- Household income
- $101,349
- Rent vs Own
- Severe rent burden
- 512.0
Population outlook (Chittenden County) Hauer SSP2
- Today (2025)
- 170,769 people
- By 2030
- 174,716 · +2.3%
- By 2040
- 180,337 · +5.6%
- By 2050
- 183,768 · +7.6%
- By 2075
- 194,646 · +14.0%
- By 2100
- 194,933 · +14.2%
Race, ethnicity, and origin ACS 2023
- Neighborhood character
- Predominantly White (84%)
- Race & ethnicity
- White 84% Two or more races 6% Asian 5% Black 4% Hispanic / Latino 2%
- Common ancestry
- Lithuanian 7% Romanian 4% Italian 3%
- Foreign-born
- 12% · Canada, India, China
- Languages at home
- 86% English-only · Other Indo-European 5% Russian/Polish/Slavic 2% French/Haitian/Cajun 2%
Political lean MEDSL · Chittenden
- 2024 margin
- Solid D (+53.6) · D 75.4% · R 21.7% · Other 2.9%
- 2008→2024 swing
- +8.9pp toward D · 2008: 44.8pp · 2024: 53.6pp
- All cycles
- 2024: D+53.6 2020: D+54.5 2016: D+46.8 2012: D+41.9 2008: D+44.8
Not yet ingested
- Civics
- —
Market trends
- HPI YoY
- ▼ -218.29%
- Current HPI
- 310.788
- Rent YoY
- —
- Metro
- Burlington-South Burlington, VT
- State GDP YoY
- —
- F500 in state
- 0
Price history
1 event — show timeline
- 2026-05-16 Listed $299,000 PrimeMLS
Property tax history
+20.3%/yrLatest (2024): $5,786 · +11.8% YoY. Source: county tax records.
Cash-flow waterfall
monthlySold comps — $/sqft
last 12 mo · ≤1 miLoading sold comps…