661 Northview Ave · Princeton, WV
Flood risk 1/10 · Minimal
- FEMA flood zone
- X (unshaded)
- Chance of flooding over 30 yrs
- 0.0%
- Est. flood insurance / yr
- $473 – $860
Fire risk 2/10 · Minimal
- Est. fire insurance / yr
- $787 – $1,461
Heat risk 2/10 · Minimal
- Hot days now (above 91°F)
- 7 days/yr
- Hot days in 30 yrs
- 20 days/yr
Wind risk 2/10 · Minimal
- Chance of severe wind over 30 yrs
- —
Air-quality risk 1/10 · Minimal
- Unhealthy air days now
- 0 days/yr
- Unhealthy air days in 30 yrs
- 0 days/yr
Risk factors via First Street. Map © Google.
Why this score? — see what drove the C+ grade
The composite is a weighted blend of 9 inputs, each scored 0–100. Each bar is that input's sub-score; the figure is the points it added to the 100-point composite (weight × sub-score).
- ARV discount +15.0/15.0
- Cash flow +14.3/30.0
- Appreciation +10.0/10.0
- DSCR +4.4/10.0
- 1% rule +4.0/10.0
- Condition / age +3.8/5.0
- Livability +3.6/5.0
- Schools +2.6/10.0
- Rent growth +2.5/5.0
$90,000
🖨 Deal sheet 📄 Offer letter ✓ Due diligence
Listing remarks
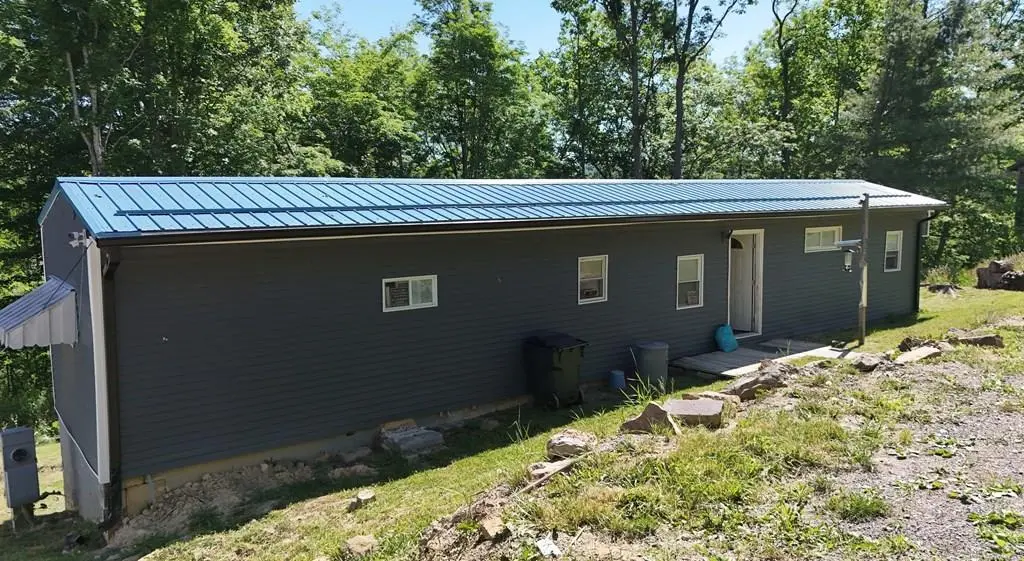
Conveniently located to shopping, schools, and more - this single wide features a great location, newer roof (2023), and some other updates. Located near the end of a quiet dead end street. Call or text to schedule your showing today!
Key facts
- 6,973 sq ft lot
- Built 1976
- Listed 9 days
Property features AI
Exterior
- Parking: No garage
- Utilities: Public water; Public sewer
- Home design: Single wide mobile home; Residential property
- Construction: Vinyl siding; Metal roof; Built as above-grade finished living space of 720 (square feet)
- Exterior features: No notable exterior features listed; Has view; Level lot
Interior
- Kitchen: Cooktop; Refrigerator
- Bedrooms: 3 total rooms (includes bedrooms and living areas)
- Flooring: Laminate
- Bathrooms: 1 full bathroom; 1 half bathroom
- Heating & cooling: Electric heating; Propane heating; No cooling
- Interior features: Eat-in kitchen; No basement
- Laundry & utility: Electric water heater
Neighborhood map
What this means for you Summary
Snapshot
- This is a 2-bed/1.5-bath single-family listed at $90k. Condition is rated good.
Deal economics
- At list price, monthly cash flow is $17 ($200/yr) — positive.
- The deal already cash-flows at list — no discount required.
- To meet the 1% rule (rent ≥ 1% of price), the offer needs to be $81k (10.2% below list).
- Recommended offer: $81k (10.2% below list) — sets the bar for 1% rule.
- Cap rate 6.5% vs local median 3.7% in Princeton — top-decile yield for the area; either an underpriced asset or a hidden risk that comps aren't pricing in. Stress-test before assuming the spread holds.
Location & tenants
- Location reads 72/100 on livability (#53 in WV) — a middle-class / working-renter tenant base. Strengths: cost of living A+, housing A+, crime B+; Watch: amenities D, commute F, employment F.
- Mercer County Schools (town): math 26% / reading 37% proficiency, ranked #28 of 55 in WV (top 51%) — families likely to look elsewhere, expect single-tenant / working-renter base with shorter leases.
- Zoned schools: Princeton Primary School (499 students, 0% FRL); Princeton Middle School (math 21% / reading 27%, grade F, #89 of 109 statewide, top 82%, 503 students, 0% FRL); Princeton Senior High School (math 32% / reading 52%, grade F, #14 of 110 statewide, top 16%, 983 students, 0% FRL) — zoned schools average 0% FRL vs 54% district-wide (54 pts lower); this property's tenant base skews higher-income than the district average.
- Market conditions: 48 active listings in the ZIP; lower-income renter base — watch delinquency; 4 units permitted in Mercer County in 2024 (0 in 5+ unit buildings).
Forward outlook
- In year one you build about $10k of equity ($622 loan paydown + $9k appreciation (10.0% local appreciation)).
- Mercer County population projected at -18% by 2050 — secular population decline; favor cash flow + early exit over multi-decade hold.
- At projected returns (10.0% appreciation + 3.0% rent growth), your $25k cash investment doubles in ~3 years — after that, you're playing with house money.
- By year 4, paydown + projected appreciation supports a ~$34k cash-out refi (75% LTV) — recoverable capital for the next deal without selling this one.
Negotiation context
- Only 10 days on market — expect competitive offers; lowballing is unlikely to land.
Questions for the listing agent
- Built in 1976 — when were the roof, HVAC, electrical panel, plumbing, and water heater last replaced?
- Is there a deadline driving the sale (1031 exchange, divorce, estate, relocation)? That informs how much negotiation room exists.
- Schools are B-rated — typically a magnet for longer-tenancy family renters. What's the average tenant stay here, and is there a school-zone premium baked into asking?
- What's the average days-on-market for RENTAL listings here right now (not sales)? A rising rental-DOM trend means longer vacancies and softer asking-rent achievability than the comps imply.
- What's the recent tenant-quality profile in this submarket — average credit score on applications, eviction rate, late-payment / NSF rate, and stable-employment percentage? A property-management company in the area should have these aggregated.
- How much new for-sale + rental construction is in the pipeline within 1–3 miles? Heavy new supply typically softens prices + rents 12–24 months out; constrained supply supports both.
Investment metrics
- 1% rule
- 0.90% ✗
- Cap rate
- 6.51%
- Cash-on-cash
- 0.79%
- DSCR
- 1.04
- GRM
- 9.3
CMA / ARV
- ARV (on-the-fly)
- $125,280
- Comps found
- 2
Show comp detail 2 sales within ~0.75 mi
| Address | Dist | Beds/Ba | Sqft | Sold | Price | $/sf | Match |
|---|---|---|---|---|---|---|---|
| 909A Old Oakvale Rd | 0.32mi | 2/1.0 | 750 (+4%) | 11mo | $130,500 | $174 | 67 |
| 405 Old Oakvale Rd | 0.42mi | 2/1.0 | 824 (+14%) | 22mo | $95,000 | $115 | 36 |
Match score weights: distance 35% · size 25% · config 20% · recency 20%. Top-matched comps best support the ARV.
Projected returns pro-forma
10.0% appreciation · 3.0% rent growth · sell at horizon
- IRR
- 24.9%
- Equity multiple
- 2.99×
- Total profit
- $50,088
- Equity at exit
- $81,079
- IRR
- 21.9%
- Equity multiple
- 6.82×
- Total profit
- $146,692
- Equity at exit
- $174,850
Cash invested: $25,200 (down + closing). Projections, not guarantees.
Landlord ↔ Tenant lean methodology
- Overall (STATE)
- 83 Strongly Landlord-Friendly
- State West Virginia
- 83 Strongly Landlord-Friendly · R+22
- County
- — inherits STATE
- City
- — inherits STATE
ZIP-level market 24740
- Home prices YoY
- 7.1%
- Active inventory
- 48
- Price-to-rent
- 9.3×
Monthly cashflow live
- Estimated rent
- $808 medium interval (Pro) →
- Mortgage (P&I)
- −$472
- Tax est. 1.5%
- −$112 /mo · $1,350/yr
- Insurance
- −$38
- HOA
- −$0
- Vacancy / Maint / Mgmt
- −$170
- Net cashflow
- $17
Break-even live
UW: 25.0% down · 7.5% · 30yr · 1.5% tax · 5.0% vac · 8.0% maint · 8.0% mgmt
Financing live
Cash to close
- Down payment
- $22,500
- Closing costs
- $2,700
- Reserves months
- —
- Total cash needed
- —
Loan-product check · same deal, 3 products live
Conventional
25% down · 7.5% · 30yr
- Down + closing
- —
- Monthly P&I
- —
- Monthly cashflow
- —
- DSCR
- —
- Eligible?
- —
Personal DTI + credit; lowest rate.
DSCR
20% down · 8.5% · 30yr
- Down + closing
- —
- Monthly P&I
- —
- Monthly cashflow
- —
- DSCR
- —
- Eligible?
- —
No personal income docs; deal must DSCR.
Hard money
10% down · 12.0% · 12mo
- Down + closing
- —
- Monthly P&I
- —
- Monthly cashflow
- —
- DSCR
- —
- Eligible?
- —
Short-term bridge; refi at stabilization.
Listing history 8 events
-
2026-06-19days on market $90,000 Active 10 DOM
-
2026-06-18days on market $90,000 Active 9 DOM
-
2026-06-17days on market $90,000 Active 8 DOM
-
2026-06-16days on market $90,000 Active 7 DOM
-
2026-06-15days on market $90,000 Active 6 DOM
-
2026-06-14days on market $90,000 Active 4 DOM
-
2026-06-12remarks 234-char remark
-
2026-06-12$90,000 Active 3 DOM
ⓘ Source: listings_history table (triggers on properties + properties_extension) + one-shot
backfill from property_details.listing_events for pre-trigger history.
Climate risk First Street
- Flood 1/10 Low FEMA zone X (unshaded) · 0% chance over 30 yrs
- Wildfire 2/10 Low
- Heat 2/10 Low 7 d/yr ≥91°F today · 20 d/yr by 30 yrs out
- Wind 2/10 Low
- Air quality 1/10 Low 0 unhealthy d/yr today · 0 by 30 yrs out
Nearby sold comps map
Loading sold comps map…
Walkable amenities ~0.75 mi
Loading nearby amenities…
Taxation est. · year 1
- Rental income
- $9,700
- − Mortgage interest
- −$5,041
- − Property taxes
- −$1,350
- − Insurance
- −$450
- − Repairs & maintenance
- −$776
- − Management
- −$776
- − Depreciation
- −$2,618
- Taxable loss
- −$1,311
- Est. tax savings @ 24.0%
- +$315
- After-tax cash flow
- $514/yr
For passive investors: Depreciation is non-cash, so a rental often shows a tax loss while cash-flowing — sheltering income. Rental losses are passive: they offset passive income freely, and up to $25,000/yr can offset ordinary (W-2) income if you actively participate and your MAGI is under $100k (phasing out to $0 by $150k); unused losses carry forward. On sale, claimed depreciation is recaptured at up to 25%, and gains may owe capital-gains tax (a 1031 exchange can defer both). Figures are a year-1 estimate at your 24.0% rate — not tax advice; consult a CPA.
Condition & rehab AI · 13 photos
This single-wide home is in good condition with a fresh roof and some minor repairs needed. It's conveniently located and has potential for rental or resale value with some updates.
Repairs flagged
- Minor bathroom wall tiles — Some tiles appear loose
- Minor bathroom wall tiles — Some tiles appear loose
- Minor bathroom wall tiles — Some tiles appear loose
- Minor bathroom wall tiles — Some tiles appear loose
- Minor bathroom wall tiles — Some tiles appear loose
- Minor bathroom wall tiles — Some tiles appear loose
- Minor bathroom wall tiles — Some tiles appear loose
- Minor bathroom wall tiles — Some tiles appear loose
- Minor bathroom wall tiles — Some tiles appear loose
- Minor bathroom wall tiles — Some tiles appear loose
- Minor bathroom wall tiles — Some tiles appear loose
- Minor bathroom wall tiles — Some tiles appear loose
Value-add opportunities
- Both Paint touch-ups — Fresh paint enhances curb appeal and interior aesthetics
- Both Replace loose tiles — Fixing loose tiles improves functionality and appearance
- Both Replace loose tiles — Fixing loose tiles improves functionality and appearance
- Both Replace loose tiles — Fixing loose tiles improves functionality and appearance
- Both Replace loose tiles — Fixing loose tiles improves functionality and appearance
- Both Replace loose tiles — Fixing loose tiles improves functionality and appearance
- Both Replace loose tiles — Fixing loose tiles improves functionality and appearance
- Both Replace loose tiles — Fixing loose tiles improves functionality and appearance
- Both Replace loose tiles — Fixing loose tiles improves functionality and appearance
- Both Replace loose tiles — Fixing loose tiles improves functionality and appearance
- Both Replace loose tiles — Fixing loose tiles improves functionality and appearance
- Both Replace loose tiles — Fixing loose tiles improves functionality and appearance
Renovation cost estimate screening
| Repair item | Severity | Est. cost |
|---|---|---|
| bathroom wall tiles · Some tiles appear loose | Minor | $500–3,000 |
| bathroom wall tiles · Some tiles appear loose | Minor | $500–3,000 |
| bathroom wall tiles · Some tiles appear loose | Minor | $500–3,000 |
| bathroom wall tiles · Some tiles appear loose | Minor | $500–3,000 |
| bathroom wall tiles · Some tiles appear loose | Minor | $500–3,000 |
| bathroom wall tiles · Some tiles appear loose | Minor | $500–3,000 |
| bathroom wall tiles · Some tiles appear loose | Minor | $500–3,000 |
| bathroom wall tiles · Some tiles appear loose | Minor | $500–3,000 |
| bathroom wall tiles · Some tiles appear loose | Minor | $500–3,000 |
| bathroom wall tiles · Some tiles appear loose | Minor | $500–3,000 |
| bathroom wall tiles · Some tiles appear loose | Minor | $500–3,000 |
| bathroom wall tiles · Some tiles appear loose | Minor | $500–3,000 |
| Total estimated repair cost · 12 items | $6,000–36,000 |
Value-add ROI direction
- Both Paint touch-ups — Fresh paint enhances curb appeal and interior aesthetics ↑
- Both Replace loose tiles — Fixing loose tiles improves functionality and appearance ↑
- Both Replace loose tiles — Fixing loose tiles improves functionality and appearance ↑
- Both Replace loose tiles — Fixing loose tiles improves functionality and appearance ↑
- Both Replace loose tiles — Fixing loose tiles improves functionality and appearance ↑
- Both Replace loose tiles — Fixing loose tiles improves functionality and appearance ↑
- Both Replace loose tiles — Fixing loose tiles improves functionality and appearance ↑
- Both Replace loose tiles — Fixing loose tiles improves functionality and appearance ↑
- Both Replace loose tiles — Fixing loose tiles improves functionality and appearance ↑
- Both Replace loose tiles — Fixing loose tiles improves functionality and appearance ↑
- Both Replace loose tiles — Fixing loose tiles improves functionality and appearance ↑
- Both Replace loose tiles — Fixing loose tiles improves functionality and appearance ↑
ⓘ Cost ranges are severity-bucket heuristics (US national rule-of-thumb). Get contractor quotes + a written scope before underwriting a rehab budget.
Schools (NCES district)
- District
- Mercer County Schools
- NCES district ID
- 5400840
- Math proficiency
- 26% ▼ -13.00%
- Reading proficiency
- 37% ▼ -6.00%
- Median HH income
- $35,064
- Composite
- 25.98/100
- National rank
- #7325
- State rank
- #28 of 55 in WV
Livability — Princeton
- Score
- 72/100
- State rank
- #53
- US rank
- #6278
Category grades
Schools grade is shown separately in the Schools card above.
Census & demographics
- County
- Mercer County · 33,615 people
- City population
- 16,498
- Metro
- Bluefield, WV-VA
- Population (ZIP)
- 16,498
- Household income
- $44,793
- Rent vs Own
- Severe rent burden
- 438.0
Population outlook (Mercer County) Hauer SSP2
- Today (2025)
- 57,860 people
- By 2030
- 55,781 · -3.6%
- By 2040
- 51,365 · -11.2%
- By 2050
- 47,476 · -17.9%
- By 2075
- 38,851 · -32.9%
- By 2100
- 30,053 · -48.1%
Race, ethnicity, and origin ACS 2023
- Neighborhood character
- Predominantly White (89%)
- Race & ethnicity
- White 89% Two or more races 7% Black 3% Hispanic / Latino 1%
- Common ancestry
- Serbian 2% Slovak 1% Italian 1%
- Foreign-born
- 1%
- Languages at home
- 98% English-only · Arabic 1%
Political lean MEDSL · Mercer
- 2024 margin
- Solid R (+57.3) · D 20.6% · R 77.9% · Other 1.5%
- 2008→2024 swing
- -29.8pp toward R · 2008: -27.6pp · 2024: -57.3pp
- All cycles
- 2024: R+57.3 2020: R+54.4 2016: R+55.3 2012: R+47.1 2008: R+27.6
Not yet ingested
- Civics
- —
Market trends
- HPI YoY
- ▲ 14.67%
- Current HPI
- 220.0694
- Rent YoY
- —
- Metro
- Bluefield, WV-VA
- State GDP YoY
- —
- F500 in state
- 0
Price history
1 event — show timeline
- 2026-06-09 Listed $90,000 BBOR
Cash-flow waterfall
monthlySold comps — $/sqft
last 12 mo · ≤1 miLoading sold comps…