65 Ed McDashowicz Dr · Porter, IN
Flood risk 1/10 · Minimal
- FEMA flood zone
- X (unshaded)
- Chance of flooding over 30 yrs
- 0.0%
- Est. flood insurance / yr
- $507 – $1,088
Fire risk 5/10 · Moderate
- Est. fire insurance / yr
- $717 – $1,331
Heat risk 2/10 · Minimal
- Hot days now (above 100°F)
- 7 days/yr
- Hot days in 30 yrs
- 14 days/yr
Wind risk 2/10 · Minimal
- Chance of severe wind over 30 yrs
- —
Air-quality risk 3/10 · Minor
- Unhealthy air days now
- 3 days/yr
- Unhealthy air days in 30 yrs
- 4 days/yr
Risk factors via First Street. Map © Google.
Why this score? — see what drove the F grade
The composite is a weighted blend of 9 inputs, each scored 0–100. Each bar is that input's sub-score; the figure is the points it added to the 100-point composite (weight × sub-score).
- ARV discount +7.5/15.0
- Cash flow +7.3/30.0
- Schools +4.7/10.0
- Livability +4.0/5.0
- Rent growth +2.5/5.0
- Condition / age +2.5/5.0
- 1% rule +2.3/10.0
- DSCR +1.5/10.0
- Appreciation +0.0/10.0
$162,900
🖨 Deal sheet (PDF) 📄 Offer letter ✓ Due diligence
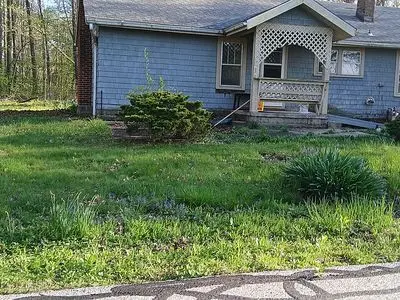
Listing remarks
Great Location , just couple miles to Indiana Dunes. Home has 2 bedrooms 1 bath LARGE living room with fire place, hardwood floors , kitchen. Washer and dryer hookup gas in utility room , boiler heat Call 219-343-0134 or text Washer and dryer hook up in utility room. New hot water heater , ,New roof 2024 and new sewer line. Home is locate on dead end street , off street parking. Call or text 219-343-0134
Key facts
- Boiler heat
- Fire place
- New hot water heater
Tags
Neighborhood map
What this means for you Summary
Snapshot
- This is a 1-bed/1.0-bath single-family listed at $163k.
Deal economics
- At list price, monthly cash flow is $-215 ($-3k/yr) — negative.
- To cash-flow at today's rent, offer at most $125k (23.3% below list).
- To meet the 1% rule (rent ≥ 1% of price), the offer needs to be $119k (26.7% below list).
- Recommended offer: $119k (26.7% below list) — sets the bar for 1% rule.
Location & tenants
- Location reads 79/100 on livability (#26 in IN, #2,234 nationally) — a middle-class / working-renter tenant base. Strengths: crime A+, employment A+, cost of living A+; Watch: amenities F, commute F.
- Duneland School Corporation (suburban): math 53% / reading 53% proficiency, ranked #30 of 301 in IN (top 10%) — acceptable for families but not a draw, mixed tenant base, ~2y average lease.
- Zoned schools: Brummitt Elementary School (math 67% / reading 57%, grade B, #101 of 994 statewide, top 12%, 354 students, 28% FRL); Chesterton Middle School (math 48% / reading 51%, grade C, #50 of 330 statewide, top 16%, 884 students, 30% FRL); Chesterton Senior High School (math 49% / reading 72%, grade C+, #45 of 369 statewide, top 12%, 1,981 students, 25% FRL).
- Market conditions: 224 active listings in the ZIP; 3 comparable units currently listed for rent nearby; rentals at typical pace (median 27d on market — plan ~3-4 weeks tenant-placement turnaround); solid renter incomes; 542 units permitted in Porter County in 2024 (0 in 5+ unit buildings).
- This rent is only 16% of the median local income ($91k/yr) — well below the 30% rent-burden line; pricing power to push rent on renewal without tenant pushback.
Forward outlook
- Local home prices are declining (-3.0%/yr); year-one equity from $1k of loan paydown is wiped out by about $5k of value loss. Plan a longer hold.
- Porter County population projected at +6% by 2050 — modest demand growth; plan on rents tracking national, not racing it.
Negotiation context
- It's been on market 40 days — a 3% lower offer ($158k) is reasonable based on typical stale-listing flexibility.
Risks & watch-outs
- Watch-outs: built in 1934 — expect roof / HVAC / electrical / plumbing capex.
- Climate carrying-cost: moderate wildfire risk — expect insurance premiums to compound above CPI over the hold.
Questions for the listing agent
- What do current leases actually rent for vs. the listed asking? Can we see a recent rent roll and the last 12 months of T-12 income?
- It's been on market 40 days. Have you received any prior offers? Is the seller open to a 27% concession, seller financing, or rate buy-down credit?
- Built in 1934 — when were the roof, HVAC, electrical panel, plumbing, and water heater last replaced?
- Is there a deadline driving the sale (1031 exchange, divorce, estate, relocation)? That informs how much negotiation room exists.
- Schools are B-rated — typically a magnet for longer-tenancy family renters. What's the average tenant stay here, and is there a school-zone premium baked into asking?
- The area grade is low — what's the realistic commute time and amenity access for the typical tenant pool here? Any planned neighborhood developments (good or bad) we should know about?
- What's the average days-on-market for RENTAL listings here right now (not sales)? A rising rental-DOM trend means longer vacancies and softer asking-rent achievability than the comps imply.
- What's the recent tenant-quality profile in this submarket — average credit score on applications, eviction rate, late-payment / NSF rate, and stable-employment percentage? A property-management company in the area should have these aggregated.
- How much new for-sale + rental construction is in the pipeline within 1–3 miles? Heavy new supply typically softens prices + rents 12–24 months out; constrained supply supports both.
Investment metrics
- 1% rule
- 0.73% ✗
- Cap rate
- 4.71%
- Cash-on-cash
- -5.65%
- DSCR
- 0.75
- GRM
- 11.4
CMA / ARV
No comps found within radius.
Projected returns pro-forma
-3.0% appreciation · 3.0% rent growth · sell at horizon
- IRR
- -25.9%
- Equity multiple
- 0.12×
- Total profit
- $-40,034
- Equity at exit
- $24,289
- IRR
- -22.5%
- Equity multiple
- -0.15×
- Total profit
- $-52,317
- Equity at exit
- $14,085
Cash invested: $45,612 (down + closing). Projections, not guarantees.
Landlord ↔ Tenant lean methodology
- Overall (STATE)
- 90 Strongly Landlord-Friendly
- State Indiana
- 90 Strongly Landlord-Friendly · R+11
- County
- — inherits STATE
- City
- — inherits STATE
ZIP-level market 46304
- Active inventory
- 224
- Price-to-rent
- 11.4×
Monthly cashflow live
- Estimated rent
- $1,194 medium interval (Pro) →
- Mortgage (P&I)
- −$854
- Tax from tax record
- −$236 /mo · $2,831/yr
- Insurance
- −$68
- HOA
- −$0
- Vacancy / Maint / Mgmt
- −$251
- Net cashflow
- $-215
Break-even live
Sensitivity live
| Price | -10% $-123 | -5% $-169 | +0% $-215 | +5% $-261 | +10% $-307 |
|---|---|---|---|---|---|
| Rent | -10% $-309 | -5% $-262 | +0% $-215 | +5% $-168 | +10% $-120 |
| Rate | -1.0pp $-133 | -0.5pp $-173 | base $-215 | +0.5pp $-257 | +1.0pp $-300 |
UW: 25.0% down · 7.5% · 30yr · 1.5% tax · 5.0% vac · 8.0% maint · 8.0% mgmt
Financing live
Cash to close
- Down payment
- $40,725
- Closing costs
- $4,887
- Reserves months
- —
- Total cash needed
- —
Loan-product check · same deal, 3 products live
Conventional
25% down · 7.5% · 30yr
- Down + closing
- —
- Monthly P&I
- —
- Monthly cashflow
- —
- DSCR
- —
- Eligible?
- —
Personal DTI + credit; lowest rate.
DSCR
20% down · 8.5% · 30yr
- Down + closing
- —
- Monthly P&I
- —
- Monthly cashflow
- —
- DSCR
- —
- Eligible?
- —
No personal income docs; deal must DSCR.
Hard money
10% down · 12.0% · 12mo
- Down + closing
- —
- Monthly P&I
- —
- Monthly cashflow
- —
- DSCR
- —
- Eligible?
- —
Short-term bridge; refi at stabilization.
Rent comps 3 comps
| Address | Beds | Baths | Sqft | Rent | $/sqft | DOM | Units | Dist |
|---|---|---|---|---|---|---|---|---|
| 700 Waverly Rd Chesterton, IN | 2.0 | 1.0 | 911 | $1,125 | $1.23 | 26d | 1 | 0.49mi |
| 111 W Taylor St Chesterton, IN | 1.0–2.0 | 1.0–1.5 | 866 | $1,150 | $1.33 | 45d | 1 | 0.93mi |
| 201 Chesterton Blvd Chesterton, IN | 2.0 | 1.0 | 936 | $1,545 | $1.65 | 19d | 1 | 1.46mi |
Listing history 16 events
-
2026-06-21days on market $162,900 Active 40 DOM
-
2026-06-18days on market $162,900 Active 37 DOM
-
2026-06-17days on market $162,900 Active 36 DOM
-
2026-06-16days on market $162,900 Active 35 DOM
-
2026-06-15days on market $162,900 Active 34 DOM
-
2026-06-13days on market $162,900 Active 32 DOM
-
2026-06-13days on market $162,900 Active 31 DOM
-
2026-06-09days on market $162,900 Active 28 DOM
-
2026-06-08days on market $162,900 Active 27 DOM
-
2026-06-07days on market $162,900 Active 26 DOM
-
2026-06-04days on market $162,900 Active 23 DOM
-
2026-06-03days on market $162,900 Active 22 DOM
-
2026-06-02days on market $162,900 Active 21 DOM
-
2026-06-01days on market $162,900 Active 20 DOM
-
2026-05-31days on market $162,900 Active 19 DOM
-
2026-05-12$162,900 Active 427-char remark
ⓘ Source: listings_history table (triggers on properties + properties_extension) + one-shot
backfill from property_details.listing_events for pre-trigger history.
Tax reassessment forecast IN · Partial reset (capped growth)
- Current annual tax
- $2,831 · $236/mo
- Projected year-2 tax
- $2,831 · $236/mo
- Expected delta
- $0/yr ($0/mo · 0.0%)
ⓘ Screening estimate from a state-policy table — verify with the county assessor before closing.
Climate risk First Street
- Flood 1/10 Low FEMA zone X (unshaded) · 0% chance over 30 yrs
- Wildfire 5/10 Major
- Heat 2/10 Low 7 d/yr ≥100°F today · 14 d/yr by 30 yrs out
- Wind 2/10 Low
- Air quality 3/10 Moderate 3 unhealthy d/yr today · 4 by 30 yrs out
Nearby sold comps map
Loading sold comps map…
Walkable amenities ~0.75 mi
Loading nearby amenities…
Taxation est. · year 1
- Rental income
- $14,329
- − Mortgage interest
- −$9,125
- − Property taxes
- −$2,831
- − Insurance
- −$814
- − Repairs & maintenance
- −$1,146
- − Management
- −$1,146
- − Depreciation
- −$4,739
- Taxable loss
- −$5,473
- Est. tax savings @ 24.0%
- +$1,313
- After-tax cash flow
- $-1,263/yr
For passive investors: Depreciation is non-cash, so a rental often shows a tax loss while cash-flowing — sheltering income. Rental losses are passive: they offset passive income freely, and up to $25,000/yr can offset ordinary (W-2) income if you actively participate and your MAGI is under $100k (phasing out to $0 by $150k); unused losses carry forward. On sale, claimed depreciation is recaptured at up to 25%, and gains may owe capital-gains tax (a 1031 exchange can defer both). Figures are a year-1 estimate at your 24.0% rate — not tax advice; consult a CPA.
Schools (NCES district)
- District
- Duneland School Corporation
- NCES district ID
- 1802800
- Math proficiency
- 53% ▼ -4.00%
- Reading proficiency
- 53% ▼ -1.00%
- Median HH income
- $70,498
- Composite
- 47.24/100
- National rank
- #2310
- State rank
- #30 of 301 in IN
Livability — Porter
- Score
- 79/100
- State rank
- #26
- US rank
- #2234
Category grades
Schools grade is shown separately in the Schools card above.
Census & demographics
- Census place
- Porter, IN
- County
- Porter County · 151,647 people
- Metro
- Chicago-Naperville-Elgin, IL-IN-WI
- Population (ZIP)
- 28,307
- Household income
- $91,326
- Rent vs Own
- Severe rent burden
- 409.0
Population outlook (Porter County) Hauer SSP2
- Today (2025)
- 177,804 people
- By 2030
- 181,552 · +2.1%
- By 2040
- 185,830 · +4.5%
- By 2050
- 187,498 · +5.5%
- By 2075
- 189,585 · +6.6%
- By 2100
- 183,722 · +3.3%
Race, ethnicity, and origin ACS 2023
- Neighborhood character
- Predominantly White (84%)
- Race & ethnicity
- White 84% Hispanic / Latino 10% Two or more races 7% Black 2% Asian 2%
- Hispanic origin (detail)
- Mexican 7% Puerto Rican 2%
- Common ancestry
- Romanian 8% Italian 3% Iranian 2%
- Foreign-born
- 4% · Canada, China
- Languages at home
- 94% English-only · Spanish 3% Russian/Polish/Slavic 1% Other Asian/Pacific 1%
Political lean MEDSL · Porter
- 2024 margin
- R (+10.5) · D 43.8% · R 54.3% · Other 1.8%
- 2008→2024 swing
- -17.7pp toward R · 2008: 7.2pp · 2024: -10.5pp
- All cycles
- 2024: R+10.5 2020: R+6.1 2016: R+6.8 2012: D+3.8 2008: D+7.2
Not yet ingested
- Civics
- —
Market trends
- HPI YoY
- ▼ -150.59%
- Current HPI
- 178.7691
- Rent YoY
- —
- Metro
- Chicago-Naperville-Elgin, IL-IN-WI
- State GDP YoY
- ▲ 2.90%
- F500 in state
- 18
Industry mix (Fortune 500 HQ in IN)
| Industry | F500 HQs | Revenue |
|---|---|---|
| Industrial Machinery | 2 | $37B |
|
||
| Healthcare | 1 | $177B |
|
||
| Pharmaceuticals | 1 | $45B |
|
||
| Metals / Steel | 1 | $18B |
|
||
| Agriculture | 1 | $17B |
|
||
| Packaging | 1 | $12B |
|
||
Price history
1 event — show timeline
- 2026-05-12 Listed $162,900 FSBO.com
Property tax history
+1.4%/yrLatest (2024): $2,831 · +5.7% YoY. Source: county tax records.
Cash-flow waterfall
monthlySold comps — $/sqft
last 12 mo · ≤1 miLoading sold comps…