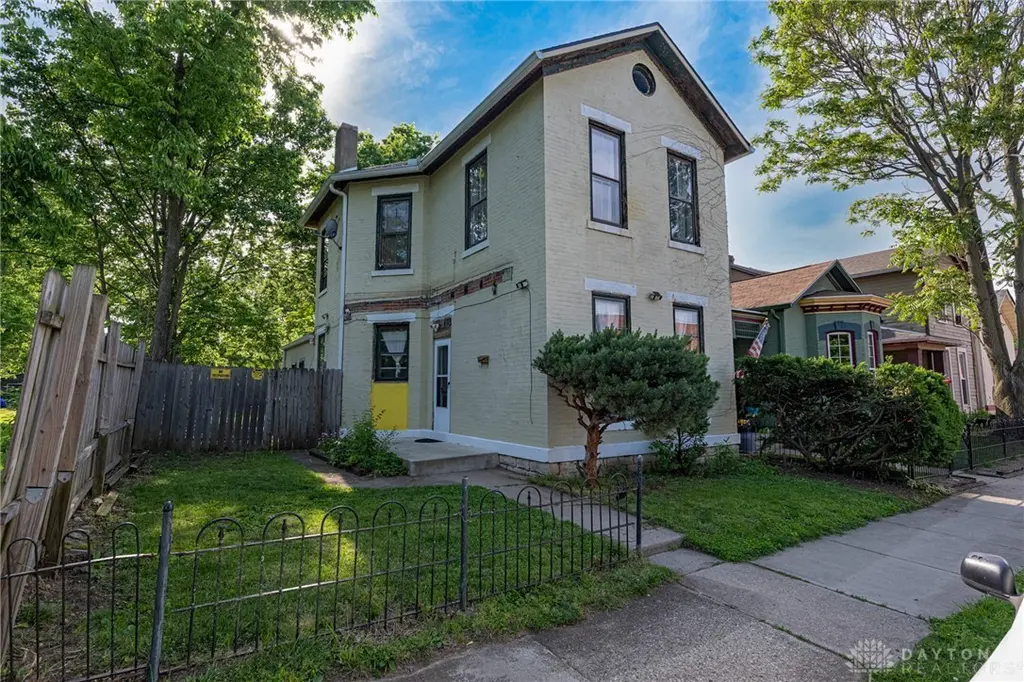
135 S Terry St · Dayton, OH
Flood risk 6/10 · Moderate
- FEMA flood zone
- X (unshaded)
- Chance of flooding over 30 yrs
- 0.74%
- Est. flood insurance / yr
- $473 – $860
Fire risk 1/10 · Minimal
- Est. fire insurance / yr
- $713 – $1,323
Heat risk 4/10 · Minor
- Hot days now (above 101°F)
- 7 days/yr
- Hot days in 30 yrs
- 18 days/yr
Wind risk 2/10 · Minimal
- Chance of severe wind over 30 yrs
- 1.0%
Air-quality risk 3/10 · Minor
- Unhealthy air days now
- 2 days/yr
- Unhealthy air days in 30 yrs
- 4 days/yr
Risk factors via First Street. Map © Google.
Why this score? — see what drove the B- grade
The composite is a weighted blend of 9 inputs, each scored 0–100. Each bar is that input's sub-score; the figure is the points it added to the 100-point composite (weight × sub-score).
- Cash flow +25.9/30.0
- ARV discount +15.0/15.0
- DSCR +8.7/10.0
- 1% rule +5.6/10.0
- Rent growth +3.4/5.0
- Livability +3.2/5.0
- Condition / age +2.5/5.0
- Schools +1.3/10.0
- Appreciation +0.0/10.0
$135,000
🖨 Deal sheet 📄 Offer letter ✓ Due diligence
Listing remarks
This two-story painted brick Victorian home provides three bedrooms and two full bathrooms across 1,781 square feet of living space. The exterior features original painted brick and ornamental iron fencing. Inside, the main level maintains its historical character with original hardwood floors throughout the entry, living, and dining areas. The interior architecture is defined by ornate Victorian door and window casings and decorative crown moldings on multiple doorways. The kitchen is designed in an L-shaped layout to maximize cabinet storage. It features dark laminate countertops, and a double basin stainless steel sink situated under a window overlooking the backyard. All kitchen applian
Key facts
- 4,500 sq ft lot
- Built 1919
- Listed 19 days
Tags
Property features AI
Finance
- Financial info: Offered for sale
Exterior
- Parking: No garage
- Security: Smoke detectors; Surveillance system
- Utilities: Public water; Storm sewer; Sewer available; Cable available
- Home design: Two-story residence; Residential zoning; Cellar foundation
- Construction: Brick, stone, and stucco exterior
- Exterior features: Fenced yard; Porch; Florida room on the main level (approximately 17 x 5)
Interior
- Kitchen: Refrigerator; Range; Dishwasher
- Bedrooms: Three bedrooms on the second level (approximately 12 x 11, 14 x 10, and 15 x 14)
- Bathrooms: Two full bathrooms (one on the main level)
- Heating & cooling: Forced-air heating (natural gas)
- Interior features: High-speed internet; One gas fireplace
- Laundry & utility: Washer and dryer; Electric water heater; Main-level laundry room (approximately 5 x 3)
Neighborhood map
What this means for you Summary
Snapshot
- This is a 2-bed/2.0-bath single-family listed at $135k.
Deal economics
- At list price, monthly cash flow is $330 ($4k/yr) — positive.
- The deal already cash-flows at list — no discount required.
- Meets the 1% rule at list price ($1k rent vs $135k).
- Recommended offer: $133k (1.5% below list) — sets the bar for market timing.
- Cap rate 9.2% vs local median 7.4% in Dayton — meaningfully above typical; check what's discounted (condition, days-on-market, listing class) to confirm the premium yield is real.
Location & tenants
- Location reads 65/100 on livability (#716 in OH) — a middle-class / working-renter tenant base. Strengths: cost of living A+, housing A+, health & safety A; Watch: schools C-, amenities C-, crime F.
- Dayton City (urban): math 12% / reading 21% proficiency, ranked #641 of 656 in OH (top 98%) — low school quality limits family demand, transient renter base, plan for 1-2y turnover; 74% free/reduced lunch — lower-income household profile, screen leases tightly.
- Market conditions: Rents rising (+3.7%/yr); 77 active listings in the ZIP; 37 comparable units currently listed for rent nearby; rentals at typical pace (median 24d on market — plan ~3-4 weeks tenant-placement turnaround); lower-income renter base — watch delinquency; 907 units permitted in Montgomery County in 2024 (416 in 5+ unit buildings).
- At $1,437/mo this rent would consume 45% of the median local household income ($38k/yr) (locally 1071% of renters already pay >50% of income on rent) — very limited rent-growth headroom before tenants either downsize or default.
Forward outlook
- Local home prices are declining (-3.0%/yr); year-one equity from $933 of loan paydown is wiped out by about $4k of value loss. Plan a longer hold.
- Montgomery County population projected at -10% by 2050 — secular population decline; favor cash flow + early exit over multi-decade hold.
- At projected returns (-3.0% appreciation + 3.7% rent growth), your $38k cash investment doubles in ~10 years — after that, you're playing with house money.
Negotiation context
- It's been on market 19 days — a 2% lower offer ($133k) is reasonable based on typical stale-listing flexibility.
Risks & watch-outs
- Watch-outs: built in 1919 — expect roof / HVAC / electrical / plumbing capex.
- Climate carrying-cost: major flood risk — expect insurance premiums to compound above CPI over the hold.
Questions for the listing agent
- Built in 1919 — when were the roof, HVAC, electrical panel, plumbing, and water heater last replaced?
- Is there a deadline driving the sale (1031 exchange, divorce, estate, relocation)? That informs how much negotiation room exists.
- Crime grade is F in this area — have there been break-ins, vandalism, or insurance claims at this property in the last 3 years? What carrier currently insures it and at what premium?
- What's the average days-on-market for RENTAL listings here right now (not sales)? A rising rental-DOM trend means longer vacancies and softer asking-rent achievability than the comps imply.
- What's the recent tenant-quality profile in this submarket — average credit score on applications, eviction rate, late-payment / NSF rate, and stable-employment percentage? A property-management company in the area should have these aggregated.
- How much new for-sale + rental construction is in the pipeline within 1–3 miles? Heavy new supply typically softens prices + rents 12–24 months out; constrained supply supports both.
Investment metrics
- 1% rule
- 1.06% ✓
- Cap rate
- 9.23%
- Cash-on-cash
- 10.48%
- DSCR
- 1.47
- GRM
- 7.8
CMA / ARV
- ARV (median comp)
- $237,843
- List price
- $135,000
- Delta
- -43.24%
- Verdict
- UNDERPRICED
- Comps
- 20 within 1.0 mi
Show comp detail 12 sales within ~0.75 mi
| Address | Dist | Beds/Ba | Sqft | Sold | Price | $/sf | Match |
|---|---|---|---|---|---|---|---|
| 135 S Terry St | 0.00mi | 3/2.0 (+1) | 1,781 (0%) | 0mo | $135,000 | $76 | 95 |
| 133 Samuel St | 0.28mi | 3/2.5 (+1) | 1,764 (-1%) | 1mo | $230,000 | $130 | 77 |
| 66 High St | 0.26mi | 3/1.0 (+1) | 1,728 (-3%) | 4mo | $126,500 | $73 | 71 |
| 109 Ringgold St | 0.15mi | 2/2.0 | 1,554 (-13%) | 10mo | $212,900 | $137 | 63 |
| 332 Jones St | 0.63mi | 3/2.5 (+1) | 1,748 (-2%) | 3mo | $300,000 | $172 | 58 |
| 68 Mcreynolds St | 0.27mi | 2/1.0 | 1,996 (+12%) | 8mo | $30,800 | $15 | 57 |
| 329 Quitman St | 0.67mi | 3/2.0 (+1) | 1,855 (+4%) | 2mo | $61,500 | $33 | 55 |
| 217 Linden Ave | 0.52mi | 3/2.0 (+1) | 1,914 (+8%) | 10mo | $85,000 | $44 | 50 |
| 2126 E 4th St | 0.57mi | 3/2.0 (+1) | 1,912 (+7%) | 7mo | $161,000 | $84 | 50 |
| 22 Van Buren St #2 | 0.68mi | 2/1.5 | 1,524 (-14%) | 2mo | $304,900 | $200 | 41 |
| 154 Church St | 0.54mi | 3/1.5 (+1) | 1,533 (-14%) | 10mo | $18,570 | $12 | 36 |
| 434 E 6th St | 0.74mi | 3/2.0 (+1) | 1,536 (-14%) | 3mo | $299,900 | $195 | 35 |
Match score weights: distance 35% · size 25% · config 20% · recency 20%. Top-matched comps best support the ARV.
Projected returns pro-forma
-3.0% appreciation · 3.71% rent growth · sell at horizon
- IRR
- 0.1%
- Equity multiple
- 1.00×
- Total profit
- $117
- Equity at exit
- $20,129
- IRR
- 10.4%
- Equity multiple
- 1.83×
- Total profit
- $31,237
- Equity at exit
- $11,672
Cash invested: $37,800 (down + closing). Projections, not guarantees.
Landlord ↔ Tenant lean methodology
- Overall (STATE)
- 73 Landlord-Friendly
- State Ohio
- 73 Landlord-Friendly · R+6
- County
- — inherits STATE
- City
- — inherits STATE
ZIP-level market 45403
- Home prices YoY
- -3.7%
- Rents YoY
- 3.7%
- Active inventory
- 77
- Price-to-rent
- 7.8×
Monthly cashflow live
- Estimated rent
- $1,437 high interval (Pro) →
- Mortgage (P&I)
- −$708
- Tax from tax record
- −$41 /mo · $494/yr
- Insurance
- −$56
- HOA
- −$0
- Vacancy / Maint / Mgmt
- −$302
- Net cashflow
- $330
Break-even live
UW: 25.0% down · 7.5% · 30yr · 1.5% tax · 5.0% vac · 8.0% maint · 8.0% mgmt
Financing live
Cash to close
- Down payment
- $33,750
- Closing costs
- $4,050
- Reserves months
- —
- Total cash needed
- —
Loan-product check · same deal, 3 products live
Conventional
25% down · 7.5% · 30yr
- Down + closing
- —
- Monthly P&I
- —
- Monthly cashflow
- —
- DSCR
- —
- Eligible?
- —
Personal DTI + credit; lowest rate.
DSCR
20% down · 8.5% · 30yr
- Down + closing
- —
- Monthly P&I
- —
- Monthly cashflow
- —
- DSCR
- —
- Eligible?
- —
No personal income docs; deal must DSCR.
Hard money
10% down · 12.0% · 12mo
- Down + closing
- —
- Monthly P&I
- —
- Monthly cashflow
- —
- DSCR
- —
- Eligible?
- —
Short-term bridge; refi at stabilization.
Rent comps 37 comps
| Address | Beds | Baths | Sqft | Rent | $/sqft | DOM | Units | Dist |
|---|---|---|---|---|---|---|---|---|
| 244 Quitman St Unit A Dayton, OH | 3.0 | 1.0 | 1987 | $1,325 | $0.67 | 23d | 1 | 0.61mi |
| 438 Clover St Dayton, OH | 3.0 | 2.0 | 2156 | $1,025 | $0.48 | 43d | 1 | 0.61mi |
| 117 Clay St Unit 117 Dayton, OH | 2.0 | 1.5 | 1632 | $1,950 | $1.19 | 23d | 1 | 0.68mi |
| 204 Sears St Dayton, OH | 3.0 | 1.0–2.5 | 1124 | $2,228 | $1.98 | 2d | 10 | 0.73mi |
| 228 James St Dayton, OH | 3.0 | 1.0 | 1700 | $1,200 | $0.71 | 43d | 1 | 0.74mi |
| 500 E 3rd St Dayton, OH | 1.0–2.0 | 1.0–2.0 | 935 | $1,660 | $1.78 | 3d | 16 | 0.74mi |
| 227 James St Unit 1 Dayton, OH | 3.0 | 1.0 | 1700 | $1,200 | $0.71 | 3d | 1 | 0.76mi |
| 229 James St Unit 228 Dayton, OH | 3.0 | 1.0 | 1700 | $1,200 | $0.71 | 23d | 1 | 0.76mi |
| 511 Parrot St Dayton, OH | 3.0 | 1.5 | 1618 | $1,100 | $0.68 | 14d | 1 | 0.77mi |
| 31 Bidleman St Dayton, OH | 2.0 | 1.5 | 1568 | $1,100 | $0.70 | 43d | 1 | 0.80mi |
| 218 Brown St Dayton, OH | 3.0 | 2.5 | 1800 | $3,200 | $1.78 | 43d | 1 | 0.83mi |
| 218 Brown St Unit 218 Dayton, OH | 3.0 | 2.5 | 1789 | $2,200 | $1.23 | 43d | 1 | 0.83mi |
| 216 Brown St Dayton, OH | 3.0 | 1.5 | 1563 | $2,500 | $1.60 | 43d | 1 | 0.84mi |
| 25 Garret St Dayton, OH | 2.0 | 1.5 | 1364 | $1,750 | $1.28 | 23d | 1 | 0.88mi |
| 80 Green St Dayton, OH | 2.0 | 2.5 | 1796 | $2,200 | $1.22 | 3d | 1 | 0.89mi |
| 519 Wyoming St Dayton, OH | 3.0 | 1.5 | 1240 | $1,600 | $1.29 | 43d | 1 | 0.92mi |
| 35 S Saint Clair St Dayton, OH | 1.0–2.0 | 1.0–2.0 | 918 | $1,844 | $2.01 | 3d | 18 | 0.93mi |
| 1038 Walnut Hill Pl Dayton, OH | 3.0 | 1.0 | 1232 | $1,095 | $0.89 | 43d | 1 | 0.97mi |
| 821 Herman Ave Dayton, OH | 3.0 | 1.0 | 1456 | $1,100 | $0.76 | 21d | 1 | 1.00mi |
| 213 Burns Ave Dayton, OH | 2.0 | 1.5 | 1388 | $1,500 | $1.08 | 14d | 1 | 1.01mi |
| 213 Burns Ave Dayton, OH | 2.0 | 1.5 | 1388 | $1,500 | $1.08 | 43d | 1 | 1.01mi |
| 1517 Chapel St Unit 1521 Dayton, OH | 2.0 | 1.0 | 1239 | $1,000 | $0.81 | 3d | 1 | 1.02mi |
| 1411 Wyoming St Dayton, OH | 3.0 | 1.0 | 1256 | $1,095 | $0.87 | 2d | 1 | 1.04mi |
| 243 Oak St Dayton, OH | 3.0 | 1.5 | 1316 | $1,600 | $1.22 | 3d | 1 | 1.05mi |
| 140 E Monument Ave Dayton, OH | 3.0 | 1.0–2.0 | 1048 | $1,952 | $1.86 | 2d | 11 | 1.06mi |
| 314 Sheridan Ave Dayton, OH | 3.0 | 1.0 | 1258 | $1,150 | $0.91 | 3d | 1 | 1.08mi |
| 1515 Wyoming St Dayton, OH | 3.0 | 1.0 | 1400 | $1,000 | $0.71 | 43d | 1 | 1.09mi |
| 2924 E 2nd St Unit 2 Dayton, OH | 2.0 | 1.0 | 2078 | $875 | $0.42 | 23d | 1 | 1.10mi |
| 200 Hart St Dayton, OH | 3.0 | 1.0 | 1304 | $1,250 | $0.96 | 23d | 1 | 1.12mi |
| 20 Lucerne Ave Dayton, OH | 3.0 | 1.0 | 1378 | $1,200 | $0.87 | 43d | 1 | 1.12mi |
| 40 W 4th St Dayton, OH | 1.0–2.0 | 1.0–2.0 | 1118 | $2,200 | $1.97 | 43d | 7 | 1.16mi |
| 201 Pleasant Ave Unit 203 Dayton, OH | 2.0 | 1.0 | 1250 | $975 | $0.78 | 23d | 1 | 1.17mi |
| 115 Livingston Ave Dayton, OH | 3.0 | 1.0 | 1624 | $1,450 | $0.89 | 44d | 1 | 1.20mi |
| 1101 Phillips Ave Unit 1101 Dayton, OH | 3.0 | 1.5 | 1300 | $1,450 | $1.12 | 43d | 1 | 1.29mi |
| 115 W Monument Ave Dayton, OH | 1.0–2.0 | 1.0–2.5 | 1053 | $2,199 | $2.09 | 2d | 20 | 1.33mi |
| 2132 Wayne Ave Dayton, OH | 3.0 | 2.0 | 1484 | $1,350 | $0.91 | 2d | 1 | 1.35mi |
| 534 Beckman St Dayton, OH | 3.0 | 2.0 | 1452 | $1,400 | $0.96 | 2d | 1 | 1.47mi |
Listing history 10 events
-
2026-06-02status $135,000 Pending 19 DOM
-
2026-06-01days on market $135,000 Active 19 DOM
-
2026-05-31days on market $135,000 Active 18 DOM
-
2026-05-13$140,000 Active 1862-char remark
-
2005-02-08soldstatus $59,000
-
1998-07-22soldstatus $107,000
-
1998-07-10soldstatus $36,600
-
1998-06-15soldstatus $36,000
-
1992-07-10soldstatus $25,000
-
1986-12-23soldstatus $31,000
ⓘ Source: listings_history table (triggers on properties + properties_extension) + one-shot
backfill from property_details.listing_events for pre-trigger history.
Tax reassessment forecast OH · Partial reset (capped growth)
- Current annual tax
- $494 · $41/mo
- Projected year-2 tax
- $1,300 · $108/mo
- Expected delta
- +$806/yr (+$67/mo · 163.0%)
ⓘ Screening estimate from a state-policy table — verify with the county assessor before closing.
Climate risk First Street
- Flood 6/10 Major FEMA zone X (unshaded) · 74% chance over 30 yrs
- Wildfire 1/10 Low
- Heat 4/10 Moderate 7 d/yr ≥101°F today · 18 d/yr by 30 yrs out
- Wind 2/10 Low 100% chance of damaging wind over 30 yrs
- Air quality 3/10 Moderate 2 unhealthy d/yr today · 4 by 30 yrs out
Nearby sold comps map
Loading sold comps map…
Walkable amenities ~0.75 mi
Loading nearby amenities…
Taxation est. · year 1
- Rental income
- $17,246
- − Mortgage interest
- −$7,562
- − Property taxes
- −$494
- − Insurance
- −$675
- − Repairs & maintenance
- −$1,380
- − Management
- −$1,380
- − Depreciation
- −$3,927
- Taxable income
- $1,828
- Est. tax owed @ 24.0%
- −$439
- After-tax cash flow
- $3,521/yr
For passive investors: Depreciation is non-cash, so a rental often shows a tax loss while cash-flowing — sheltering income. Rental losses are passive: they offset passive income freely, and up to $25,000/yr can offset ordinary (W-2) income if you actively participate and your MAGI is under $100k (phasing out to $0 by $150k); unused losses carry forward. On sale, claimed depreciation is recaptured at up to 25%, and gains may owe capital-gains tax (a 1031 exchange can defer both). Figures are a year-1 estimate at your 24.0% rate — not tax advice; consult a CPA.
Schools (NCES district)
- District
- Dayton City
- NCES district ID
- 3904384
- Math proficiency
- 12% ▼ -12.00%
- Reading proficiency
- 21% ▼ -11.00%
- Median HH income
- $28,688
- Composite
- 12.94/100
- National rank
- #9579
- State rank
- #641 of 656 in OH
Livability — Dayton
- Score
- 65/100
- State rank
- #716
- US rank
- #12895
Category grades
Schools grade is shown separately in the Schools card above.
Census & demographics
- Census place
- Dayton, OH
- County
- Montgomery County · 459,541 people
- City population
- 164,387
- Metro
- Dayton-Kettering, OH
- Population (ZIP)
- 13,608
- Household income
- $38,323
- Rent vs Own
- Severe rent burden
- 1071.0
Population outlook (Montgomery County) Hauer SSP2
- Today (2025)
- 523,241 people
- By 2030
- 514,948 · -1.6%
- By 2040
- 493,378 · -5.7%
- By 2050
- 469,639 · -10.2%
- By 2075
- 418,360 · -20.0%
- By 2100
- 353,315 · -32.5%
Race, ethnicity, and origin ACS 2023
- Neighborhood character
- Predominantly White (66%)
- Race & ethnicity
- White 66% Hispanic / Latino 15% Black 14% Two or more races 8% Native American 1%
- Hispanic origin (detail)
- Mexican 7%
- Common ancestry
- Lithuanian 2% Slovak 1% Italian 1%
- Foreign-born
- 9% · Canada
- Languages at home
- 84% English-only · Spanish 13% Other Asian/Pacific 1%
Political lean MEDSL · Montgomery
- 2024 margin
- Toss-up / Even · D 49.8% · R 49.3%
- 2008→2024 swing
- -5.8pp toward R · 2008: 6.2pp · 2024: 0.5pp
- All cycles
- 2024: D+0.5 2020: D+2.2 2016: R+1.2 2012: D+3.1 2008: D+6.2
Not yet ingested
- Civics
- —
Market trends
- HPI YoY
- ▼ -17.40%
- Current HPI
- 447.4034
- Rent YoY
- ▲ 3.71%
- Metro
- Dayton-Kettering, OH
- State GDP YoY
- ▲ 1.98%
- F500 in state
- 48
Industry mix (Fortune 500 HQ in OH)
| Industry | F500 HQs | Revenue |
|---|---|---|
| Insurance | 3 | $145B |
|
||
| Industrial Machinery | 3 | $49B |
|
||
| Financial Services | 3 | $24B |
|
||
| Consumer Goods | 2 | $93B |
|
||
| Aerospace / Defense | 2 | $47B |
|
||
| Utilities | 2 | $33B |
|
||
Price history
+335.5% since first listed10 events — show timeline
- 2026-06-15 Sold (MLS) $135,000 Dayton MLS
- 2026-06-01 Pending — Dayton MLS
- 2026-05-26 Price Changed $135,000 Dayton MLS
- 2026-05-13 Listed $140,000 Dayton MLS
- 2005-02-08 Sold (Public Records) $59,000 Public Records
- 1998-07-22 Sold (Public Records) $107,000 Public Records
- 1998-07-10 Sold (Public Records) $36,600 Public Records
- 1998-06-15 Sold (Public Records) $36,000 Public Records
- 1992-07-10 Sold (Public Records) $25,000 Public Records
- 1986-12-23 Sold (Public Records) $31,000 Public Records
Property tax history
-8.8%/yrLatest (2025): $494 · -4.0% YoY. Source: county tax records.
Cash-flow waterfall
monthlySold comps — $/sqft
last 12 mo · ≤1 miLoading sold comps…