840 Driftwood Ln · Cottonwood Shores, TX
Flood risk 1/10 · Minimal
- FEMA flood zone
- X (unshaded)
- Chance of flooding over 30 yrs
- 0.0%
- Est. flood insurance / yr
- $507 – $1,088
Fire risk 5/10 · Moderate
- Est. fire insurance / yr
- $1,222 – $2,270
Heat risk 8/10 · Major
- Hot days now (above 107°F)
- 7 days/yr
- Hot days in 30 yrs
- 23 days/yr
Wind risk 6/10 · Moderate
- Chance of severe wind over 30 yrs
- 62.0%
Air-quality risk 1/10 · Minimal
- Unhealthy air days now
- 0 days/yr
- Unhealthy air days in 30 yrs
- 0 days/yr
Risk factors via First Street. Map © Google.
Why this score? — see what drove the D grade
The composite is a weighted blend of 9 inputs, each scored 0–100. Each bar is that input's sub-score; the figure is the points it added to the 100-point composite (weight × sub-score).
- ARV discount +11.9/15.0
- Cash flow +9.0/30.0
- Appreciation +5.5/10.0
- Livability +3.5/5.0
- 1% rule +3.0/10.0
- Schools +3.0/10.0
- DSCR +2.5/10.0
- Rent growth +2.5/5.0
- Condition / age +2.5/5.0
$230,000
🖨 Deal sheet (PDF) 📄 Offer letter ✓ Due diligence
Listing remarks MLS
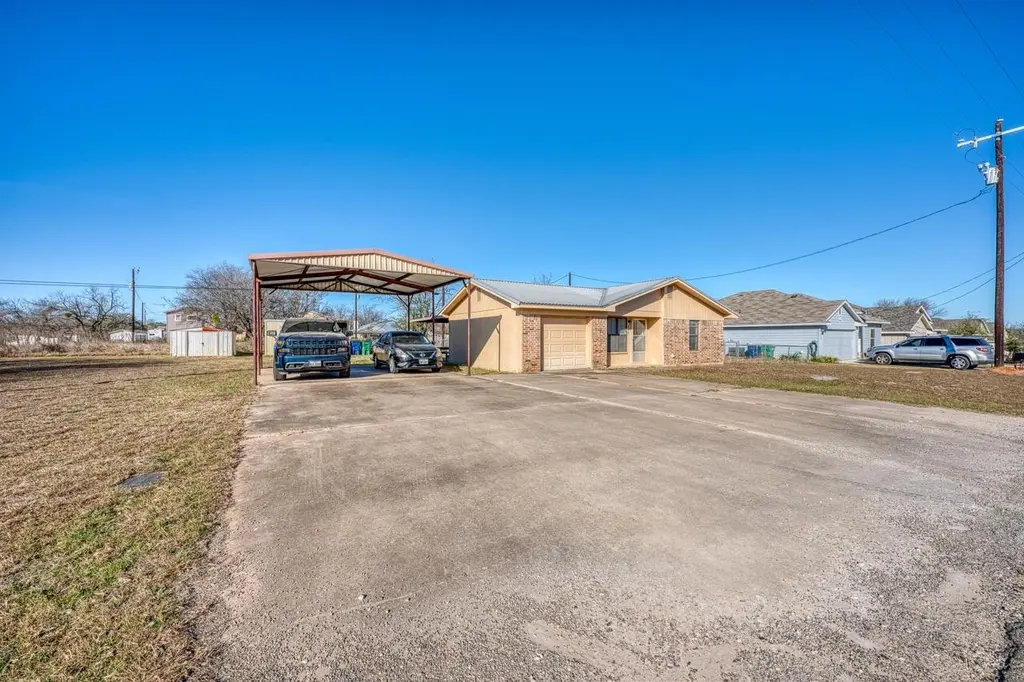
This home sits on 3 lots which allows for some great outdoor space (keeping in mind lots in this neighborhood go for $25-30,000 per lot). The property has a large carport and a covered patio in the back for those evening BBQs while you watch the deer roam the neighborhood. The three lots also allow plenty of space to add a larger detached garage, RV cover, or shop, etc. The outside of the home is completely bricked with a metal roof and has been well maintained. Inside the home you will find 3 bedrooms with 1 1/2 bathrooms. When you first enter into the house you will see a cozy living space and after that is the dining area and then a galley kitchen. This functional kitchen makes everything easier, since it is designed to maximize the space while putting everything right there for cooking and cleaning. For a "smaller" house, the designer did a great job maximizing all of the space. They allowed for three good sized bedrooms. The master suite has a 1/2 bath and there is a full bath in the main hallway. This home is walking distance to Lake Marble Falls where you have access to a boat ramp. It is also a short driving distance to several other lakes. This home could be great for a 1st time buyer. Don't let the slightly small size distract you from the fact that this home offers everything a home buyer is looking for when purchasing their home. This home is located in Cottonwood Shores which is a great little community outside of Marble Falls.
Key facts
- Covered patio
- Large carport
- Rv cover
Tags
Neighborhood map
What this means for you Summary
Snapshot
- This is a 3-bed/2.0-bath single-family listed at $230k.
Deal economics
- At list price, monthly cash flow is $-180 ($-2k/yr) — negative.
- To cash-flow at today's rent, offer at most $198k (13.8% below list).
- To meet the 1% rule (rent ≥ 1% of price), the offer needs to be $185k (19.8% below list).
- Recommended offer: $185k (19.8% below list) — sets the bar for 1% rule.
- Cap rate 5.4% vs local median 4.2% in Cottonwood Shores — meaningfully above typical; check what's discounted (condition, days-on-market, listing class) to confirm the premium yield is real.
Location & tenants
- Location reads 70/100 on livability (#385 in TX) — a middle-class / working-renter tenant base. Strengths: crime A+, cost of living A+, housing A+; Watch: amenities F, commute F, employment F.
- Marble Falls ISD (town): math 32% / reading 38% proficiency, ranked #511 of 826 in TX (top 62%) — families likely to look elsewhere, expect single-tenant / working-renter base with shorter leases.
- Zoned schools: Colt El (math 35% / reading 38%, grade F, #1,883 of 4,322 statewide, top 44%, 644 students, 62% FRL); Marble Falls Middle (math 32% / reading 37%, grade F, #858 of 1,662 statewide, top 54%, 911 students, 67% FRL); Marble Falls H S (math 29% / reading 47%, grade F, #880 of 1,632 statewide, top 54%, 1,145 students, 61% FRL).
- Market conditions: 1236 active listings in the ZIP; 4 comparable units currently listed for rent nearby; rentals lingering (median 46d on market — plan ~5-8 weeks vacancy on turnover, expect pricing pressure); 50% of comp listings sitting > 30 days — soft ceiling on asking rent; solid renter incomes; 891 units permitted in Burnet County in 2024 (76 in 5+ unit buildings).
Forward outlook
- In year one you build about $4k of equity ($2k loan paydown + $2k appreciation (0.9% local appreciation)).
- Burnet County population projected at +22% by 2050 — long-run rental-demand tailwind backs the buy-and-hold thesis.
- By year 8, paydown + projected appreciation supports a ~$30k cash-out refi (75% LTV) — recoverable capital for the next deal without selling this one.
Negotiation context
- It's been on market 152 days — a 12% lower offer ($202k) is reasonable based on typical stale-listing flexibility.
Risks & watch-outs
- Climate carrying-cost: major wind risk, 62% chance of damaging wind over 30y; moderate wildfire risk; extreme-heat days projected 7→23/yr by 2055 (HVAC capex compounding) — expect insurance premiums to compound above CPI over the hold.
Questions for the listing agent
- What do current leases actually rent for vs. the listed asking? Can we see a recent rent roll and the last 12 months of T-12 income?
- It's been on market 152 days. Have you received any prior offers? Is the seller open to a 20% concession, seller financing, or rate buy-down credit?
- Why hasn't it sold? Are there any deal-killer items the seller is aware of (foundation, flood, title, zoning, code violations)?
- Is there a deadline driving the sale (1031 exchange, divorce, estate, relocation)? That informs how much negotiation room exists.
- Schools are F-rated, which usually means shorter tenancies and higher turnover. Who's the typical renter profile here, and what's been the actual vacancy rate?
- The area grade is low — what's the realistic commute time and amenity access for the typical tenant pool here? Any planned neighborhood developments (good or bad) we should know about?
- What's the average days-on-market for RENTAL listings here right now (not sales)? A rising rental-DOM trend means longer vacancies and softer asking-rent achievability than the comps imply.
- What's the recent tenant-quality profile in this submarket — average credit score on applications, eviction rate, late-payment / NSF rate, and stable-employment percentage? A property-management company in the area should have these aggregated.
- How much new for-sale + rental construction is in the pipeline within 1–3 miles? Heavy new supply typically softens prices + rents 12–24 months out; constrained supply supports both.
Investment metrics
- 1% rule
- 0.80% ✗
- Cap rate
- 5.35%
- Cash-on-cash
- -3.35%
- DSCR
- 0.85
- GRM
- 10.4
CMA / ARV
- ARV (median comp)
- $255,006
- List price
- $230,000
- Delta
- -9.81%
- Verdict
- FAIR
- Comps
- 20 within 1.0 mi
Projected returns pro-forma
0.95% appreciation · 3.0% rent growth · sell at horizon
- IRR
- -2.4%
- Equity multiple
- 0.88×
- Total profit
- $-7,711
- Equity at exit
- $77,865
- IRR
- 2.7%
- Equity multiple
- 1.33×
- Total profit
- $21,205
- Equity at exit
- $102,972
Cash invested: $64,400 (down + closing). Projections, not guarantees.
Landlord ↔ Tenant lean methodology
- Overall (STATE)
- 87 Strongly Landlord-Friendly
- State Texas
- 87 Strongly Landlord-Friendly · R+5
- County
- — inherits STATE
- City
- — inherits STATE
ZIP-level market 78657
- Home prices YoY
- 0.4%
- Active inventory
- 1236
- Price-to-rent
- 10.4×
Monthly cashflow live
- Estimated rent
- $1,845 medium interval (Pro) →
- Mortgage (P&I)
- −$1,206
- Tax from tax record
- −$336 /mo · $4,027/yr
- Insurance
- −$96
- HOA
- −$0
- Vacancy / Maint / Mgmt
- −$388
- Net cashflow
- $-180
Break-even live
Sensitivity live
| Price | -10% $-50 | -5% $-115 | +0% $-180 | +5% $-245 | +10% $-310 |
|---|---|---|---|---|---|
| Rent | -10% $-326 | -5% $-253 | +0% $-180 | +5% $-107 | +10% $-34 |
| Rate | -1.0pp $-64 | -0.5pp $-121 | base $-180 | +0.5pp $-239 | +1.0pp $-300 |
UW: 25.0% down · 7.5% · 30yr · 1.5% tax · 5.0% vac · 8.0% maint · 8.0% mgmt
Financing live
Cash to close
- Down payment
- $57,500
- Closing costs
- $6,900
- Reserves months
- —
- Total cash needed
- —
Loan-product check · same deal, 3 products live
Conventional
25% down · 7.5% · 30yr
- Down + closing
- —
- Monthly P&I
- —
- Monthly cashflow
- —
- DSCR
- —
- Eligible?
- —
Personal DTI + credit; lowest rate.
DSCR
20% down · 8.5% · 30yr
- Down + closing
- —
- Monthly P&I
- —
- Monthly cashflow
- —
- DSCR
- —
- Eligible?
- —
No personal income docs; deal must DSCR.
Hard money
10% down · 12.0% · 12mo
- Down + closing
- —
- Monthly P&I
- —
- Monthly cashflow
- —
- DSCR
- —
- Eligible?
- —
Short-term bridge; refi at stabilization.
Rent comps 4 comps
| Address | Beds | Baths | Sqft | Rent | $/sqft | DOM | Units | Dist |
|---|---|---|---|---|---|---|---|---|
| 851 Aspen Ln Cottonwood Shores, TX | 3.0 | 1.0 | 1440 | $1,692 | $1.18 | 45d | 1 | 0.23mi |
| 851 Aspen Ln Cottonwood Shores, TX | 3.0 | 1.0 | 1440 | $1,566 | $1.09 | 25d | 1 | 0.23mi |
| 723 Pecan Ln Cottonwood Shores, TX | 2.0 | 1.0 | 1027 | $1,400 | $1.36 | 46d | 1 | 0.39mi |
| 413 Olympia Fields St Meadowlakes, TX | 2.0 | 2.0 | 1406 | $1,800 | $1.28 | 5d | 1 | 1.30mi |
Listing history 17 events
-
2026-06-21days on market $230,000 Active 152 DOM
-
2026-06-18days on market $230,000 Active 149 DOM
-
2026-06-17days on market $230,000 Active 148 DOM
-
2026-06-16days on market $230,000 Active 147 DOM
-
2026-06-15days on market $230,000 Active 146 DOM
-
2026-06-13days on market $230,000 Active 144 DOM
-
2026-06-13days on market $230,000 Active 143 DOM
-
2026-06-09days on market $230,000 Active 140 DOM
-
2026-06-08days on market $230,000 Active 139 DOM
-
2026-06-07days on market $230,000 Active 138 DOM
-
2026-06-05days on market $230,000 Active 135 DOM
-
2026-06-03days on market $230,000 Active 134 DOM
-
2026-06-01days on market $230,000 Active 132 DOM
-
2026-05-31days on market $230,000 Active 131 DOM
-
2026-01-20$235,000 Active 1474-char remark
Show marketing remark (1474 chars)
This home sits on 3 lots which allows for some great outdoor space (keeping in mind lots in this neighborhood go for $25-30,000 per lot). The property has a large carport and a covered patio in the back for those evening BBQs while you watch the deer roam the neighborhood. The three lots also allow plenty of space to add a larger detached garage, RV cover, or shop, etc. The outside of the home is completely bricked with a metal roof and has been well maintained. Inside the home you will find 3 bedrooms with 1 1/2 bathrooms. When you first enter into the house you will see a cozy living space and after that is the dining area and then a galley kitchen. This functional kitchen makes everything easier, since it is designed to maximize the space while putting everything right there for cooking and cleaning. For a "smaller" house, the designer did a great job maximizing all of the space. They allowed for three good sized bedrooms. The master suite has a 1/2 bath and there is a full bath in the main hallway. This home is walking distance to Lake Marble Falls where you have access to a boat ramp. It is also a short driving distance to several other lakes. This home could be great for a 1st time buyer. Don't let the slightly small size distract you from the fact that this home offers everything a home buyer is looking for when purchasing their home. This home is located in Cottonwood Shores which is a great little community outside of Marble Falls.
-
2025-07-24price $233,995
-
2002-06-10soldstatus
ⓘ Source: listings_history table (triggers on properties + properties_extension) + one-shot
backfill from property_details.listing_events for pre-trigger history.
Tax reassessment forecast TX · Resets to sale price
- Current annual tax
- $4,027 · $336/mo
- Projected year-2 tax
- $4,209 · $351/mo
- Expected delta
- +$182/yr (+$15/mo · 4.5%)
ⓘ Screening estimate from a state-policy table — verify with the county assessor before closing.
Climate risk First Street
- Flood 1/10 Low FEMA zone X (unshaded) · 0% chance over 30 yrs
- Wildfire 5/10 Major
- Heat 8/10 Severe 7 d/yr ≥107°F today · 23 d/yr by 30 yrs out
- Wind 6/10 Major 62% chance of damaging wind over 30 yrs
- Air quality 1/10 Low 0 unhealthy d/yr today · 0 by 30 yrs out
Nearby sold comps map
Loading sold comps map…
Walkable amenities ~0.75 mi
Loading nearby amenities…
Taxation est. · year 1
- Rental income
- $22,143
- − Mortgage interest
- −$12,884
- − Property taxes
- −$4,027
- − Insurance
- −$1,150
- − Repairs & maintenance
- −$1,771
- − Management
- −$1,771
- − Depreciation
- −$6,691
- Taxable loss
- −$6,152
- Est. tax savings @ 24.0%
- +$1,476
- After-tax cash flow
- $-682/yr
For passive investors: Depreciation is non-cash, so a rental often shows a tax loss while cash-flowing — sheltering income. Rental losses are passive: they offset passive income freely, and up to $25,000/yr can offset ordinary (W-2) income if you actively participate and your MAGI is under $100k (phasing out to $0 by $150k); unused losses carry forward. On sale, claimed depreciation is recaptured at up to 25%, and gains may owe capital-gains tax (a 1031 exchange can defer both). Figures are a year-1 estimate at your 24.0% rate — not tax advice; consult a CPA.
Schools (NCES district)
- District
- Marble Falls ISD
- NCES district ID
- 4829010
- Math proficiency
- 32% ▼ -8.00%
- Reading proficiency
- 38% ▼ -4.00%
- Median HH income
- $49,663
- Composite
- 30.3/100
- National rank
- #6278
- State rank
- #511 of 826 in TX
Livability — Cottonwood Shores
- Score
- 70/100
- State rank
- #385
- US rank
- #8036
Category grades
Schools grade is shown separately in the Schools card above.
Census & demographics
- Census place
- Cottonwood Shores, TX
- County
- Llano County · 16,310 people
- City population
- 7,591
- Metro
- nan
- Population (ZIP)
- 7,591
- Household income
- $91,452
- Rent vs Own
- Severe rent burden
- 45.0
Population outlook (Burnet County) Hauer SSP2
- Today (2025)
- 50,492 people
- By 2030
- 52,995 · +5.0%
- By 2040
- 57,528 · +13.9%
- By 2050
- 61,444 · +21.7%
- By 2075
- 71,098 · +40.8%
- By 2100
- 74,634 · +47.8%
Race, ethnicity, and origin ACS 2023
- Neighborhood character
- Predominantly White (80%)
- Race & ethnicity
- White 80% Hispanic / Latino 16% Two or more races 8% Asian 1%
- Hispanic origin (detail)
- Mexican 14%
- Common ancestry
- Slovak 3% Portuguese 3% Italian 2%
- Foreign-born
- 8% · Canada
- Languages at home
- 87% English-only · Spanish 12% Other Indo-European 1%
Political lean MEDSL · Burnet
- 2024 margin
- Solid R (+55.7) · D 21.7% · R 77.4%
- 2008→2024 swing
- -11.6pp toward R · 2008: -44.1pp · 2024: -55.7pp
- All cycles
- 2024: R+55.7 2020: R+53.1 2016: R+56.8 2012: R+54.6 2008: R+44.1
Not yet ingested
- Civics
- —
Market trends
- HPI YoY
- ▲ 0.95%
- Current HPI
- 229.9918
- Rent YoY
- —
- Metro
- nan
- State GDP YoY
- ▲ 3.95%
- F500 in state
- 110
Industry mix (Fortune 500 HQ in TX)
| Industry | F500 HQs | Revenue |
|---|---|---|
| Energy | 16 | $1,198B |
|
||
| Technology | 5 | $198B |
|
||
| Engineering / Construction | 4 | $72B |
|
||
| Energy Services | 3 | $60B |
|
||
| Utilities | 3 | $41B |
|
||
| Healthcare | 2 | $330B |
|
||
Price history
+0.4% since first listed3 events — show timeline
- 2026-01-20 Listed $235,000 HLMLS as distributed by MLS GRID
- 2025-07-24 Price Changed $233,995 HLMLS as distributed by MLS GRID
- 2002-06-10 Sold (Public Records) — Public Records
Property tax history
+7.6%/yrLatest (2026): $4,027 · +18.1% YoY. Source: county tax records.
Cash-flow waterfall
monthlySold comps — $/sqft
last 12 mo · ≤1 miLoading sold comps…