282 North St · Wood, PA
Flood risk 1/10 · Minimal
- FEMA flood zone
- X (unshaded)
- Chance of flooding over 30 yrs
- 0.0%
- Est. flood insurance / yr
- $507 – $1,088
Fire risk 4/10 · Minor
- Est. fire insurance / yr
- $511 – $949
Heat risk 2/10 · Minimal
- Hot days now (above 92°F)
- 7 days/yr
- Hot days in 30 yrs
- 16 days/yr
Wind risk 2/10 · Minimal
- Chance of severe wind over 30 yrs
- 1.0%
Air-quality risk 2/10 · Minimal
- Unhealthy air days now
- 1 days/yr
- Unhealthy air days in 30 yrs
- 2 days/yr
Risk factors via First Street. Map © Google.
Why this score? — see what drove the A- grade
The composite is a weighted blend of 9 inputs, each scored 0–100. Each bar is that input's sub-score; the figure is the points it added to the 100-point composite (weight × sub-score).
- Cash flow +30.0/30.0
- ARV discount +15.0/15.0
- 1% rule +10.0/10.0
- DSCR +10.0/10.0
- Appreciation +5.0/10.0
- Schools +3.0/10.0
- Rent growth +2.5/5.0
- Livability +2.5/5.0
- Condition / age +2.5/5.0
$28,900
🖨 Deal sheet 📄 Offer letter ✓ Due diligence
Listing remarks MLS
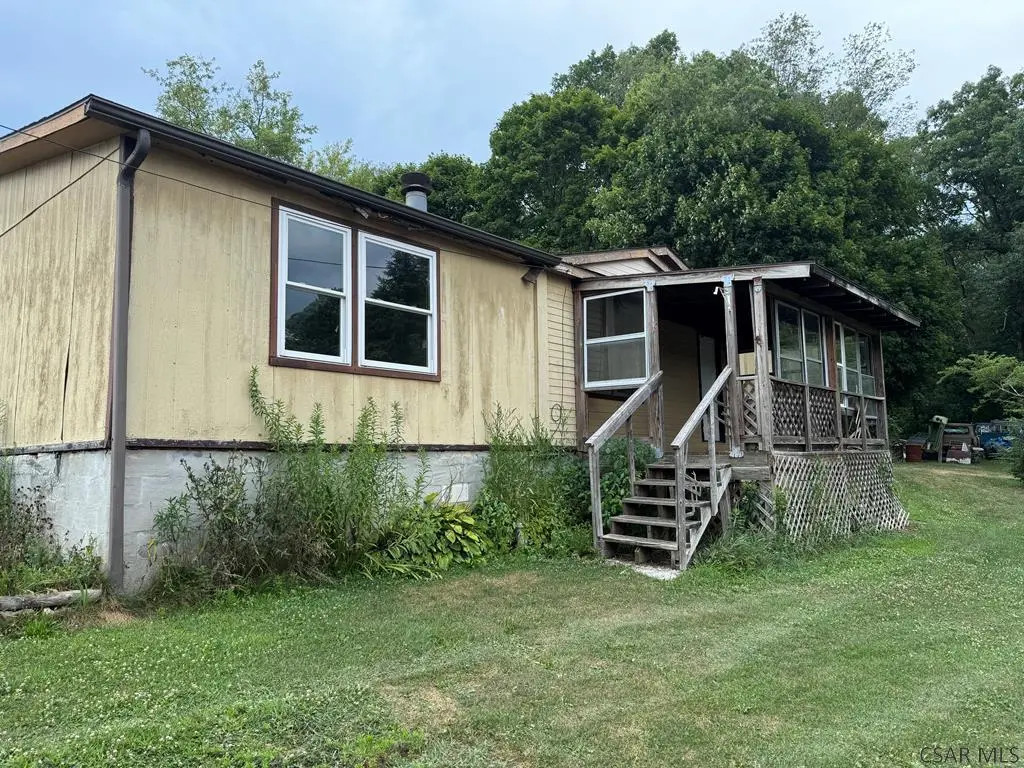
3 Bedroom, 2 Bath Doublewide in need of TLC. Living Room w/ Fireplace, Master Suite, Vaulted Ceilings, 2 Added Porches.
Key facts
- Master suite
- Vaulted ceilings
- 2 added porches
Tags
Neighborhood map
What this means for you Summary
Snapshot
- This is a 3-bed/2.0-bath single-family listed at $29k.
Deal economics
- At list price, monthly cash flow is $642 ($8k/yr) — positive.
- The deal already cash-flows at list — no discount required.
- Meets the 1% rule at list price ($1k rent vs $29k).
- Recommended offer: $25k (12.0% below list) — sets the bar for market timing.
Location & tenants
- Location reads: area grade A — affects rentability + tenant quality, not the cash-flow math above.
- Tussey Mountain SD (rural): math 26% / reading 46% proficiency, ranked #412 of 539 in PA (top 76%) — families likely to look elsewhere, expect single-tenant / working-renter base with shorter leases.
- Market conditions: 3 active listings in the ZIP; 70 units permitted in Huntingdon County in 2024 (0 in 5+ unit buildings).
Forward outlook
- In year one you build about $1k of equity ($200 loan paydown + $867 appreciation (3.0% local appreciation)).
- Huntingdon County population projected at -14% by 2050 — secular population decline; favor cash flow + early exit over multi-decade hold.
- At projected returns (3.0% appreciation + 3.0% rent growth), your $8k cash investment doubles in ~1 year — after that, you're playing with house money.
Negotiation context
- It's been on market 255 days — a 12% lower offer ($25k) is reasonable based on typical stale-listing flexibility.
- 2 sale attempts since 2y ago; this cycle's ask has dropped $26k (47%) from the opening price — seller is motivated, your offer sets the floor, not the list.
Questions for the listing agent
- It's been on market 255 days. Have you received any prior offers? Is the seller open to a 12% concession, seller financing, or rate buy-down credit?
- Why hasn't it sold? Are there any deal-killer items the seller is aware of (foundation, flood, title, zoning, code violations)?
- Is there a deadline driving the sale (1031 exchange, divorce, estate, relocation)? That informs how much negotiation room exists.
- What's the average days-on-market for RENTAL listings here right now (not sales)? A rising rental-DOM trend means longer vacancies and softer asking-rent achievability than the comps imply.
- What's the recent tenant-quality profile in this submarket — average credit score on applications, eviction rate, late-payment / NSF rate, and stable-employment percentage? A property-management company in the area should have these aggregated.
- How much new for-sale + rental construction is in the pipeline within 1–3 miles? Heavy new supply typically softens prices + rents 12–24 months out; constrained supply supports both.
Investment metrics
- 1% rule
- 3.69% ✓
- Cap rate
- 32.93%
- Cash-on-cash
- 95.15%
- DSCR
- 5.23
- GRM
- 2.3
CMA / ARV
- ARV (median comp)
- $53,797
- List price
- $28,900
- Delta
- -46.28%
- Verdict
- UNDERPRICED
- Comps
- 3 within 2.0 mi
Projected returns pro-forma
3.0% appreciation · 3.0% rent growth · sell at horizon
- IRR
- 99.4%
- Equity multiple
- 6.48×
- Total profit
- $44,363
- Equity at exit
- $12,995
- IRR
- 98.9%
- Equity multiple
- 13.44×
- Total profit
- $100,684
- Equity at exit
- $20,026
Cash invested: $8,092 (down + closing). Projections, not guarantees.
Landlord ↔ Tenant lean methodology
- Overall (STATE)
- 62 Landlord-Friendly
- State Pennsylvania
- 62 Landlord-Friendly · EVEN
- County
- — inherits STATE
- City
- — inherits STATE
ZIP-level market 16694
- Active inventory
- 3
- Price-to-rent
- 2.3×
Monthly cashflow live
- Estimated rent
- $1,065 medium interval (Pro) →
- Mortgage (P&I)
- −$152
- Tax est. 1.5%
- −$36 /mo · $434/yr
- Insurance
- −$12
- HOA
- −$0
- Vacancy / Maint / Mgmt
- −$224
- Net cashflow
- $642
Break-even live
UW: 25.0% down · 7.5% · 30yr · 1.5% tax · 5.0% vac · 8.0% maint · 8.0% mgmt
Financing live
Cash to close
- Down payment
- $7,225
- Closing costs
- $867
- Reserves months
- —
- Total cash needed
- —
Loan-product check · same deal, 3 products live
Conventional
25% down · 7.5% · 30yr
- Down + closing
- —
- Monthly P&I
- —
- Monthly cashflow
- —
- DSCR
- —
- Eligible?
- —
Personal DTI + credit; lowest rate.
DSCR
20% down · 8.5% · 30yr
- Down + closing
- —
- Monthly P&I
- —
- Monthly cashflow
- —
- DSCR
- —
- Eligible?
- —
No personal income docs; deal must DSCR.
Hard money
10% down · 12.0% · 12mo
- Down + closing
- —
- Monthly P&I
- —
- Monthly cashflow
- —
- DSCR
- —
- Eligible?
- —
Short-term bridge; refi at stabilization.
Listing history 17 events
-
2026-06-18days on market $28,900 Active 255 DOM
-
2026-06-17days on market $28,900 Active 254 DOM
-
2026-06-16days on market $28,900 Active 253 DOM
-
2026-06-15days on market $28,900 Active 252 DOM
-
2026-06-13days on market $28,900 Active 250 DOM
-
2026-06-12days on market $28,900 Active 249 DOM
-
2026-06-09days on market $28,900 Active 246 DOM
-
2026-06-08days on market $28,900 Active 245 DOM
-
2026-06-08days on market $28,900 Active 244 DOM
-
2026-06-07days on market $28,900 Active 243 DOM
-
2026-06-04days on market $28,900 Active 240 DOM
-
2026-06-02days on market $28,900 Active 239 DOM
-
2026-06-01days on market $28,900 Active 238 DOM
-
2026-05-31days on market $28,900 Active 237 DOM
-
2025-10-08price $28,900 119-char remark
Show marketing remark (119 chars)
3 Bedroom, 2 Bath Doublewide in need of TLC. Living Room w/ Fireplace, Master Suite, Vaulted Ceilings, 2 Added Porches.
-
2025-10-06$54,900 Active 119-char remark
Show marketing remark (119 chars)
3 Bedroom, 2 Bath Doublewide in need of TLC. Living Room w/ Fireplace, Master Suite, Vaulted Ceilings, 2 Added Porches.
-
2024-07-24$54,900 Active
ⓘ Source: listings_history table (triggers on properties + properties_extension) + one-shot
backfill from property_details.listing_events for pre-trigger history.
Climate risk First Street
- Flood 1/10 Low FEMA zone X (unshaded) · 0% chance over 30 yrs
- Wildfire 4/10 Moderate
- Heat 2/10 Low 7 d/yr ≥92°F today · 16 d/yr by 30 yrs out
- Wind 2/10 Low 100% chance of damaging wind over 30 yrs
- Air quality 2/10 Low 1 unhealthy d/yr today · 2 by 30 yrs out
Nearby sold comps map
Loading sold comps map…
Walkable amenities ~0.75 mi
Loading nearby amenities…
Taxation est. · year 1
- Rental income
- $12,780
- − Mortgage interest
- −$1,619
- − Property taxes
- −$434
- − Insurance
- −$144
- − Repairs & maintenance
- −$1,022
- − Management
- −$1,022
- − Depreciation
- −$841
- Taxable income
- $7,698
- Est. tax owed @ 24.0%
- −$1,847
- After-tax cash flow
- $5,852/yr
For passive investors: Depreciation is non-cash, so a rental often shows a tax loss while cash-flowing — sheltering income. Rental losses are passive: they offset passive income freely, and up to $25,000/yr can offset ordinary (W-2) income if you actively participate and your MAGI is under $100k (phasing out to $0 by $150k); unused losses carry forward. On sale, claimed depreciation is recaptured at up to 25%, and gains may owe capital-gains tax (a 1031 exchange can defer both). Figures are a year-1 estimate at your 24.0% rate — not tax advice; consult a CPA.
Schools (NCES district)
- District
- Tussey Mountain SD
- NCES district ID
- 4223970
- Math proficiency
- 26% ▼ -8.00%
- Reading proficiency
- 46% ▼ -10.00%
- Median HH income
- $40,095
- Composite
- 30.15/100
- National rank
- #6329
- State rank
- #412 of 539 in PA
Livability — Wood
No livability data for this city. (Only ~50 U.S. cities are tracked.)
Census & demographics
- Census place
- Wood, PA
- Population (ZIP)
- 325
Population outlook (Huntingdon County) Hauer SSP2
- Today (2025)
- 44,212 people
- By 2030
- 43,057 · -2.6%
- By 2040
- 40,537 · -8.3%
- By 2050
- 37,844 · -14.4%
- By 2075
- 31,411 · -29.0%
- By 2100
- 23,907 · -45.9%
Race, ethnicity, and origin ACS 2023
- Neighborhood character
- Predominantly White (100%)
- Race & ethnicity
- White 100%
- Common ancestry
- Romanian 2% English 1% Slovak 1%
Political lean MEDSL · Huntingdon
- 2024 margin
- Solid R (+52.9) · D 23.2% · R 76.1%
- 2008→2024 swing
- -25.4pp toward R · 2008: -27.5pp · 2024: -52.9pp
- All cycles
- 2024: R+52.9 2020: R+51.0 2016: R+50.7 2012: R+37.4 2008: R+27.5
Not yet ingested
- Civics
- —
Market trends
- HPI YoY
- —
- Current HPI
- —
- Rent YoY
- —
- Metro
- —
- State GDP YoY
- ▲ 1.68%
- F500 in state
- 34
Industry mix (Fortune 500 HQ in PA)
| Industry | F500 HQs | Revenue |
|---|---|---|
| Healthcare | 2 | $309B |
|
||
| Insurance | 2 | $27B |
|
||
| Telecommunications / Media | 1 | $124B |
|
||
| Industrial Distribution | 1 | $22B |
|
||
| Financial Services | 1 | $20B |
|
||
| Chemicals / Materials | 1 | $18B |
|
||
Price history
-47.4% since first listed3 events — show timeline
- 2025-10-08 Price Changed $28,900 CSMLS
- 2025-10-06 Listed $54,900 CSMLS
- 2024-07-24 Listed $54,900 CSMLS
Property tax history
+2.7%/yrLatest (2026): $1,712 · +1.9% YoY. Source: county tax records.
Cash-flow waterfall
monthlySold comps — $/sqft
last 12 mo · ≤1 miLoading sold comps…