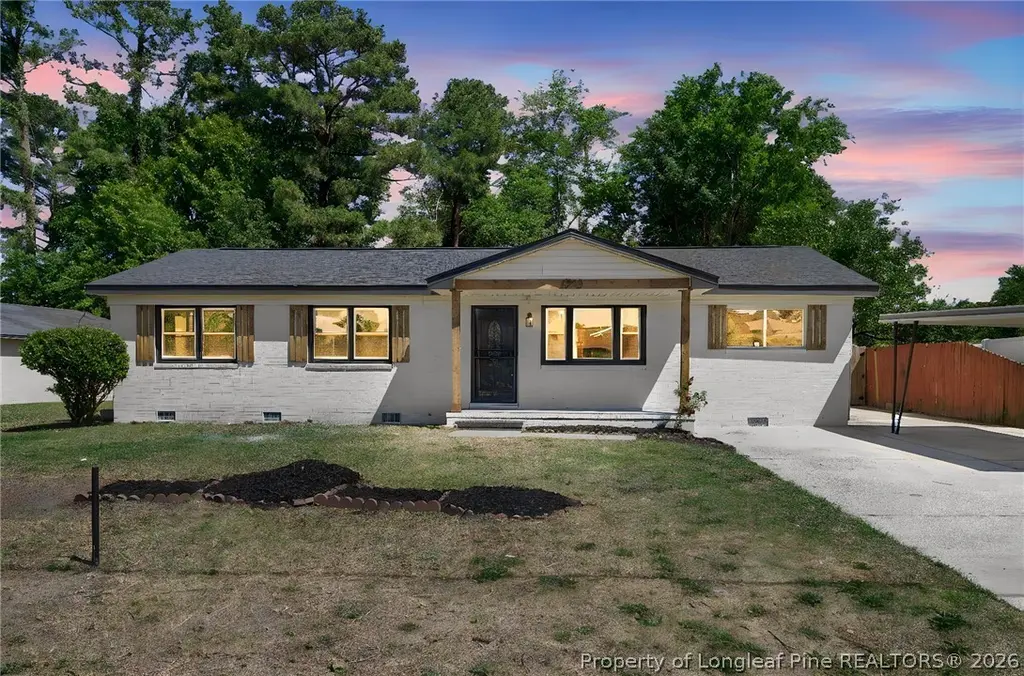
6222 Timberland Dr · Fayetteville, NC
Flood risk 1/10 · Minimal
- FEMA flood zone
- X (unshaded)
- Chance of flooding over 30 yrs
- 0.0%
- Est. flood insurance / yr
- $507 – $1,088
Fire risk 4/10 · Minor
- Est. fire insurance / yr
- $906 – $1,684
Heat risk 7/10 · Major
- Hot days now (above 107°F)
- 7 days/yr
- Hot days in 30 yrs
- 16 days/yr
Wind risk 7/10 · Major
- Chance of severe wind over 30 yrs
- 78.0%
Air-quality risk 2/10 · Minimal
- Unhealthy air days now
- 0 days/yr
- Unhealthy air days in 30 yrs
- 1 days/yr
Risk factors via First Street. Map © Google.
Why this score? — see what drove the D grade
The composite is a weighted blend of 9 inputs, each scored 0–100. Each bar is that input's sub-score; the figure is the points it added to the 100-point composite (weight × sub-score).
- ARV discount +11.2/15.0
- Cash flow +10.8/30.0
- Livability +3.8/5.0
- Rent growth +3.3/5.0
- DSCR +3.1/10.0
- Schools +3.1/10.0
- 1% rule +2.6/10.0
- Condition / age +2.5/5.0
- Appreciation +0.0/10.0
$199,900
🖨 Deal sheet (PDF) 📄 Offer letter ✓ Due diligence
Listing remarks
Welcome to this beautifully renovated home that blends modern style with everyday comfort. This move-in-ready property features a stunning updated kitchen complete with sleek stainless steel appliances, elegant quartz countertops, and a spacious island with a statement hood vent positioned over the cooktop perfect for both cooking and entertaining. Throughout the home, you’ll find durable and stylish luxury vinyl plank flooring, adding warmth and continuity to every room. The thoughtful renovations continue with contemporary finishes that create a fresh, inviting atmosphere. Step outside to enjoy a fully fenced yard, ideal for pets, gatherings, or simply relaxing in your own private s
Key facts
- Spacious island
- Quartz countertops
- Updated kitchen
Tags
Property features AI
Exterior
- Parking: 1 covered parking space; 1-car carport
- Utilities: Public water; Public sewer
- Home design: Single family residence; Residential property
- Construction: Brick veneer construction
- Exterior features: Front porch; Porch; Fenced yard; Cleared, level lot; Paved road access
Interior
- Kitchen: Refrigerator; Dishwasher; Range; Range hood
- Bedrooms: 6 total rooms
- Flooring: Carpet; Vinyl
- Bathrooms: 2 full bathrooms
- Heating & cooling: Central heating; Whole house fan
- Interior features: Eat-in kitchen; Kitchen island; Crawl space basement
- Laundry & utility: Washer hookup; In-unit laundry
Neighborhood map
What this means for you Summary
Snapshot
- This is a 3-bed/2.0-bath single-family listed at $200k.
Deal economics
- At list price, monthly cash flow is $-93 ($-1k/yr) — negative.
- To cash-flow at today's rent, offer at most $183k (8.2% below list).
- To meet the 1% rule (rent ≥ 1% of price), the offer needs to be $153k (23.5% below list).
- Recommended offer: $153k (23.5% below list) — sets the bar for 1% rule.
Location & tenants
- Location reads 75/100 on livability (#45 in NC, #4,031 nationally) — a middle-class / working-renter tenant base. Strengths: commute A+, cost of living A+, housing A+; Watch: crime F, employment D-.
- Cumberland County Schools (urban): math 32% / reading 41% proficiency, ranked #126 of 178 in NC (top 71%) — families likely to look elsewhere, expect single-tenant / working-renter base with shorter leases.
- Zoned schools: Cliffdale Elementary (math 19% / reading 27%, grade F, #1,168 of 1,410 statewide, top 83%, 658 students, 100% FRL); Anne Chesnutt Middle (math 22% / reading 42%, grade F, #317 of 475 statewide, top 68%, 443 students, 99% FRL); Westover High (math 42% / reading 39%, grade F, #387 of 535 statewide, top 73%, 1,202 students, 100% FRL) — zoned schools average 100% FRL vs 55% district-wide (45 pts higher); higher-poverty schools than district average — tighter screening recommended.
- Market conditions: Rents rising (+3.1%/yr); 435 active listings in the ZIP; 40 comparable units currently listed for rent nearby; rentals at typical pace (median 26d on market — plan ~3-4 weeks tenant-placement turnaround); 1,125 units permitted in Cumberland County in 2024 (104 in 5+ unit buildings).
Forward outlook
- Local home prices are declining (-3.0%/yr); year-one equity from $1k of loan paydown is wiped out by about $6k of value loss. Plan a longer hold.
Negotiation context
- It's been on market 44 days — a 3% lower offer ($194k) is reasonable based on typical stale-listing flexibility.
- 2 sale attempts with the ask held roughly flat each time — persistent listings suggest the price (not the market) is what's stuck; bring a comps-based counter.
Risks & watch-outs
- Climate carrying-cost: major wind risk, 78% chance of damaging wind over 30y; extreme-heat days projected 7→16/yr by 2055 (HVAC capex compounding) — expect insurance premiums to compound above CPI over the hold.
Questions for the listing agent
- What do current leases actually rent for vs. the listed asking? Can we see a recent rent roll and the last 12 months of T-12 income?
- It's been on market 44 days. Have you received any prior offers? Is the seller open to a 24% concession, seller financing, or rate buy-down credit?
- Built in 1969 — when were the roof, HVAC, electrical panel, plumbing, and water heater last replaced?
- Is there a deadline driving the sale (1031 exchange, divorce, estate, relocation)? That informs how much negotiation room exists.
- Crime grade is F in this area — have there been break-ins, vandalism, or insurance claims at this property in the last 3 years? What carrier currently insures it and at what premium?
- The area grade is low — what's the realistic commute time and amenity access for the typical tenant pool here? Any planned neighborhood developments (good or bad) we should know about?
- What's the average days-on-market for RENTAL listings here right now (not sales)? A rising rental-DOM trend means longer vacancies and softer asking-rent achievability than the comps imply.
- What's the recent tenant-quality profile in this submarket — average credit score on applications, eviction rate, late-payment / NSF rate, and stable-employment percentage? A property-management company in the area should have these aggregated.
- How much new for-sale + rental construction is in the pipeline within 1–3 miles? Heavy new supply typically softens prices + rents 12–24 months out; constrained supply supports both.
Investment metrics
- 1% rule
- 0.76% ✗
- Cap rate
- 5.73%
- Cash-on-cash
- -1.99%
- DSCR
- 0.91
- GRM
- 10.9
CMA / ARV
- ARV (on-the-fly)
- $217,620
- Comps found
- 12
Show comp detail 12 sales within ~0.75 mi
| Address | Dist | Beds/Ba | Sqft | Sold | Price | $/sf | Match |
|---|---|---|---|---|---|---|---|
| 6207 Glenlea Cir | 0.24mi | 3/2.0 | 1,471 (+5%) | 8mo | $270,000 | $184 | 74 |
| 6313 Lynette Cir | 0.36mi | 3/1.5 | 1,446 (+3%) | 3mo | $215,000 | $149 | 74 |
| 6310 Glenlea Cir | 0.26mi | 3/1.5 | 1,275 (-9%) | 1mo | $165,000 | $129 | 69 |
| 6004 Dunbridge Dr | 0.50mi | 3/2.0 | 1,295 (-8%) | 4mo | $192,500 | $149 | 61 |
| 5811 Waters Edge Dr | 0.68mi | 3/2.0 | 1,356 (-3%) | 3mo | $180,600 | $133 | 60 |
| 6526 Lark Dr | 0.51mi | 3/2.0 | 1,534 (+9%) | 2mo | $185,000 | $121 | 59 |
| 6493 Portsmouth Dr | 0.28mi | 3/2.0 | 1,200 (-14%) | 5mo | $193,500 | $161 | 59 |
| 525 Offing Dr | 0.53mi | 3/2.0 | 1,265 (-10%) | 3mo | $220,000 | $174 | 56 |
| 6341 Cliffdale Rd | 0.41mi | 3/1.0 | 1,258 (-10%) | 6mo | $134,500 | $107 | 55 |
| 521 Offing Dr | 0.54mi | 3/2.5 | 1,610 (+15%) | 2mo | $267,000 | $166 | 47 |
| 419 Offing Dr | 0.73mi | 3/2.5 | 1,572 (+12%) | 1mo | $243,000 | $155 | 43 |
| 314 Narwhal Ct | 0.73mi | 3/2.0 | 1,598 (+14%) | 5mo | $256,000 | $160 | 39 |
Match score weights: distance 35% · size 25% · config 20% · recency 20%. Top-matched comps best support the ARV.
Projected returns pro-forma
-3.0% appreciation · 3.11% rent growth · sell at horizon
- IRR
- -19.5%
- Equity multiple
- 0.32×
- Total profit
- $-38,174
- Equity at exit
- $29,806
- IRR
- -12.1%
- Equity multiple
- 0.28×
- Total profit
- $-40,280
- Equity at exit
- $17,284
Cash invested: $55,972 (down + closing). Projections, not guarantees.
Landlord ↔ Tenant lean methodology
- Overall (STATE)
- 85 Strongly Landlord-Friendly
- State North Carolina
- 85 Strongly Landlord-Friendly · R+3
- County
- — inherits STATE
- City
- — inherits STATE
ZIP-level market 28314
- Home prices YoY
- -15.7%
- Rents YoY
- 3.1%
- Active inventory
- 435
- Price-to-rent
- 10.9×
Monthly cashflow live
- Estimated rent
- $1,529 high interval (Pro) →
- Mortgage (P&I)
- −$1,048
- Tax from tax record
- −$170 /mo · $2,034/yr
- Insurance
- −$83
- HOA
- −$0
- Vacancy / Maint / Mgmt
- −$321
- Net cashflow
- $-93
Break-even live
Sensitivity live
| Price | -10% $20 | -5% $-36 | +0% $-93 | +5% $-150 | +10% $-206 |
|---|---|---|---|---|---|
| Rent | -10% $-214 | -5% $-153 | +0% $-93 | +5% $-33 | +10% $28 |
| Rate | -1.0pp $8 | -0.5pp $-42 | base $-93 | +0.5pp $-145 | +1.0pp $-198 |
UW: 25.0% down · 7.5% · 30yr · 1.5% tax · 5.0% vac · 8.0% maint · 8.0% mgmt
Financing live
Cash to close
- Down payment
- $49,975
- Closing costs
- $5,997
- Reserves months
- —
- Total cash needed
- —
Loan-product check · same deal, 3 products live
Conventional
25% down · 7.5% · 30yr
- Down + closing
- —
- Monthly P&I
- —
- Monthly cashflow
- —
- DSCR
- —
- Eligible?
- —
Personal DTI + credit; lowest rate.
DSCR
20% down · 8.5% · 30yr
- Down + closing
- —
- Monthly P&I
- —
- Monthly cashflow
- —
- DSCR
- —
- Eligible?
- —
No personal income docs; deal must DSCR.
Hard money
10% down · 12.0% · 12mo
- Down + closing
- —
- Monthly P&I
- —
- Monthly cashflow
- —
- DSCR
- —
- Eligible?
- —
Short-term bridge; refi at stabilization.
Rent comps 40 comps
| Address | Beds | Baths | Sqft | Rent | $/sqft | DOM | Units | Dist |
|---|---|---|---|---|---|---|---|---|
| 564 Jennings Farm Rd Fayetteville, NC | 3.0 | 2.0 | 1540 | $1,400 | $0.91 | 25d | 1 | 0.29mi |
| 6309 Lynette Cir Fayetteville, NC | 3.0 | 1.5 | 1014 | $1,300 | $1.28 | 25d | 1 | 0.33mi |
| 3500 Carlson Bay Ct Fayetteville, NC | 1.0–3.0 | 1.0–2.0 | 850 | $1,350 | $1.59 | 16d | 4 | 0.38mi |
| 6517 Portsmouth Dr Fayetteville, NC | 3.0 | 1.5 | 1125 | $1,250 | $1.11 | 25d | 1 | 0.44mi |
| 3119 Wisteria Ln Unit 102 Fayetteville, NC | 3.0 | 2.0 | 1415 | $1,550 | $1.10 | 16d | 1 | 0.49mi |
| 944 Lark Dr Fayetteville, NC | 3.0 | 2.0 | 1100 | $1,395 | $1.27 | 16d | 1 | 0.51mi |
| 812 Crescent Commons Way Fayetteville, NC | 1.0–2.0 | 1.0–2.0 | 963 | $1,385 | $1.44 | 16d | 10 | 0.51mi |
| 6132 Dandy Loop Rd Fayetteville, NC | 3.0 | 1.0 | 1456 | $1,325 | $0.91 | 25d | 1 | 0.52mi |
| 6340 Ginger Cir Fayetteville, NC | 3.0 | 1.5 | 1052 | $1,400 | $1.33 | 25d | 1 | 0.56mi |
| 420 Mangum Ct Fayetteville, NC | 3.0 | 2.0 | 1127 | $1,550 | $1.38 | 25d | 1 | 0.56mi |
| 5817 Horton Pl Fayetteville, NC | 3.0 | 2.0 | 1680 | $1,650 | $0.98 | 25d | 1 | 0.61mi |
| 698 Bartons Landing Pl #5 Fayetteville, NC | 2.0 | 2.0 | 1136 | $1,100 | $0.97 | 25d | 1 | 0.63mi |
| 5761 Waterwood Dr Fayetteville, NC | 3.0 | 2.0 | 1452 | $1,600 | $1.10 | 23d | 1 | 0.65mi |
| 5831 Waters Edge Dr Fayetteville, NC | 3.0 | 2.0 | 1344 | $1,545 | $1.15 | 25d | 1 | 0.66mi |
| 5713 Waterwood Dr Fayetteville, NC | 3.0 | 2.0 | 1440 | $1,650 | $1.15 | 23d | 1 | 0.66mi |
| 417 Watergap Dr Fayetteville, NC | 3.0 | 3.0 | 1648 | $1,950 | $1.18 | 25d | 1 | 0.66mi |
| 663 Bartons Landing Pl Unit 2 Fayetteville, NC | 2.0 | 2.0 | 1150 | $1,200 | $1.04 | 16d | 1 | 0.68mi |
| 672 Bartons Landing Pl Fayetteville, NC | 2.0 | 2.0 | 1145 | $1,100 | $0.96 | 16d | 1 | 0.76mi |
| 679 Bartons Landing Pl Unit 6 Fayetteville, NC | 2.0 | 2.0 | 1145 | $1,200 | $1.05 | 25d | 1 | 0.76mi |
| 679 Bartons Landing Pl Fayetteville, NC | 2.0 | 2.0 | 1145 | $1,150 | $1.00 | 25d | 1 | 0.76mi |
| 3325 Oak Forest Dr Fayetteville, NC | 1.0–3.0 | 1.0–2.0 | 1112 | $1,745 | $1.57 | 16d | 66 | 0.79mi |
| 495 Stiles Pl Fayetteville, NC | 3.0 | 2.0 | 1300 | $1,250 | $0.96 | 16d | 1 | 0.86mi |
| 3330 Harbour Pointe Pl #12 Fayetteville, NC | 3.0 | 2.0 | 1401 | $1,700 | $1.21 | 16d | 1 | 0.86mi |
| 600 Scotia Ln Fayetteville, NC | 1.0–3.0 | 1.0–2.0 | 1070 | $1,380 | $1.29 | 16d | 29 | 0.87mi |
| 425 Woodstream Trl Fayetteville, NC | 1.0–2.0 | 1.0–1.5 | 810 | $1,330 | $1.64 | 25d | 12 | 0.91mi |
| 457 Lands End Rd Fayetteville, NC | 3.0 | 3.0 | 1545 | $1,895 | $1.23 | 25d | 1 | 0.96mi |
| 202 Bertram Pl Fayetteville, NC | 3.0 | 2.0 | 1175 | $1,300 | $1.11 | 16d | 1 | 0.97mi |
| 567 Cutchen Ln Fayetteville, NC | 1.0–3.0 | 1.0–2.0 | 975 | $1,425 | $1.46 | 16d | 61 | 0.98mi |
| 1070 Rulnick St Fayetteville, NC | 3.0 | 1.0 | 1014 | $1,200 | $1.18 | 25d | 1 | 1.02mi |
| 321 Bahama Loop Fayetteville, NC | 3.0 | 2.0 | 1759 | $2,100 | $1.19 | 16d | 1 | 1.02mi |
| 3374 Starboard Way Fayetteville, NC | 3.0 | 2.5 | 1481 | $2,150 | $1.45 | 16d | 1 | 1.03mi |
| 6793 Candlewood Dr Fayetteville, NC | 3.0 | 2.0 | 1240 | $1,475 | $1.19 | 16d | 1 | 1.07mi |
| 1131 Capeharbor Ct Fayetteville, NC | 2.0 | 2.0 | 1100 | $1,345 | $1.22 | 16d | 14 | 1.08mi |
| 7298 Ryan St Fayetteville, NC | 4.0 | 1.5 | 1315 | $1,400 | $1.06 | 25d | 1 | 1.08mi |
| 419 Georgetown Cir Fayetteville, NC | 2.0 | 2.5 | 1648 | $1,500 | $0.91 | 25d | 1 | 1.08mi |
| 540 Auburndale Ln Fayetteville, NC | 3.0 | 2.0 | 1100 | $1,600 | $1.45 | 16d | 1 | 1.10mi |
| 604 Raven Pl Fayetteville, NC | 3.0 | 2.0 | 1624 | $1,750 | $1.08 | 25d | 1 | 1.11mi |
| 7252 Ainsley St Fayetteville, NC | 3.0 | 1.0 | 1265 | $1,299 | $1.03 | 25d | 1 | 1.15mi |
| 1066 Strickland Bridge Rd Fayetteville, NC | 3.0 | 2.0 | 1427 | $2,050 | $1.44 | 16d | 1 | 1.17mi |
| 425 Windermere Dr Fayetteville, NC | 2.0 | 1.0 | 900 | $950 | $1.06 | 25d | 1 | 1.19mi |
Listing history 14 events
-
2026-06-13statusdays on market $199,900 Pending 44 DOM
-
2026-06-10days on market $199,900 Active 43 DOM
-
2026-06-09days on market $199,900 Active 42 DOM
-
2026-06-08days on market $199,900 Active 41 DOM
-
2026-06-07days on market $199,900 Active 40 DOM
-
2026-06-03days on market $199,900 Active 36 DOM
-
2026-06-02days on market $199,900 Active 35 DOM
-
2026-06-01days on market $199,900 Active 34 DOM
-
2026-05-31days on market $199,900 Active 33 DOM
-
2026-05-30days on market $199,900 Active 32 DOM
-
2026-05-12price $199,900
-
2026-04-28$205,000 Active
-
2025-08-27historical $1,350
-
2025-08-12$1,350
ⓘ Source: listings_history table (triggers on properties + properties_extension) + one-shot
backfill from property_details.listing_events for pre-trigger history.
Tax reassessment forecast NC · Resets to sale price
- Current annual tax
- $2,034 · $170/mo
- Projected year-2 tax
- $2,034 · $170/mo
- Expected delta
- $0/yr ($0/mo · 0.0%)
ⓘ Screening estimate from a state-policy table — verify with the county assessor before closing.
Climate risk First Street
- Flood 1/10 Low FEMA zone X (unshaded) · 0% chance over 30 yrs
- Wildfire 4/10 Moderate
- Heat 7/10 Severe 7 d/yr ≥107°F today · 16 d/yr by 30 yrs out
- Wind 7/10 Severe 78% chance of damaging wind over 30 yrs
- Air quality 2/10 Low 0 unhealthy d/yr today · 1 by 30 yrs out
Nearby sold comps map
Loading sold comps map…
Walkable amenities ~0.75 mi
Loading nearby amenities…
Taxation est. · year 1
- Rental income
- $18,351
- − Mortgage interest
- −$11,198
- − Property taxes
- −$2,034
- − Insurance
- −$1,000
- − Repairs & maintenance
- −$1,468
- − Management
- −$1,468
- − Depreciation
- −$5,815
- Taxable loss
- −$4,632
- Est. tax savings @ 24.0%
- +$1,112
- After-tax cash flow
- $-5/yr
For passive investors: Depreciation is non-cash, so a rental often shows a tax loss while cash-flowing — sheltering income. Rental losses are passive: they offset passive income freely, and up to $25,000/yr can offset ordinary (W-2) income if you actively participate and your MAGI is under $100k (phasing out to $0 by $150k); unused losses carry forward. On sale, claimed depreciation is recaptured at up to 25%, and gains may owe capital-gains tax (a 1031 exchange can defer both). Figures are a year-1 estimate at your 24.0% rate — not tax advice; consult a CPA.
Schools (NCES district)
- District
- Cumberland County Schools
- NCES district ID
- 3700011
- Math proficiency
- 32% ▼ -2.00%
- Reading proficiency
- 41% ▼ -1.00%
- Median HH income
- $44,168
- Composite
- 31.0/100
- National rank
- #6096
- State rank
- #126 of 178 in NC
Livability — Fayetteville
- Score
- 75/100
- State rank
- #45
- US rank
- #4031
Category grades
Schools grade is shown separately in the Schools card above.
Census & demographics
- Census place
- Fayetteville, NC
- County
- Cumberland County · 265,314 people
- City population
- 226,118
- Metro
- Fayetteville, NC
- Population (ZIP)
- 55,834
- Household income
- $62,249
- Rent vs Own
- Severe rent burden
- 2511.0
Population outlook (Cumberland County) Hauer SSP2
- Today (2025)
- 330,855 people
- By 2030
- 333,523 · +0.8%
- By 2040
- 335,583 · +1.4%
- By 2050
- 335,325 · +1.4%
- By 2075
- 342,853 · +3.6%
- By 2100
- 340,698 · +3.0%
Race, ethnicity, and origin ACS 2023
- Neighborhood character
- Diverse neighborhood (Simpson 0.67)
- Race & ethnicity
- Black 49% White 25% Hispanic / Latino 16% Two or more races 11% Asian 3%
- Hispanic origin (detail)
- Mexican 5% Puerto Rican 6% Dominican 1%
- Common ancestry
- Slovak 1% Romanian 1% Lithuanian 1%
- Foreign-born
- 9% · Canada, South Korea
- Languages at home
- 84% English-only · Spanish 10% Korean 1% Other Asian/Pacific 1%
Political lean MEDSL · Cumberland
- 2024 margin
- D (+13.4) · D 56.1% · R 42.7% · Other 1.2%
- 2008→2024 swing
- -4.3pp toward R · 2008: 17.7pp · 2024: 13.4pp
- All cycles
- 2024: D+13.4 2020: D+16.6 2016: D+16.0 2012: D+19.7 2008: D+17.7
Not yet ingested
- Civics
- —
Market trends
- HPI YoY
- ▼ -43.20%
- Current HPI
- 231.873
- Rent YoY
- ▲ 3.11%
- Metro
- Fayetteville, NC
- State GDP YoY
- ▲ 3.28%
- F500 in state
- 26
Industry mix (Fortune 500 HQ in NC)
| Industry | F500 HQs | Revenue |
|---|---|---|
| Financial Services | 2 | $213B |
|
||
| Retail | 2 | $95B |
|
||
| Industrial Conglomerate | 1 | $38B |
|
||
| Metals / Steel | 1 | $35B |
|
||
| Utilities | 1 | $30B |
|
||
| Industrial Machinery | 1 | $19B |
|
||
Price history
+14707.4% since first listed4 events — show timeline
- 2026-05-12 Price Changed $199,900 LPRMLS
- 2026-04-28 Listed $205,000 LPRMLS
- 2025-08-27 Rental Removed $1,350 TMLS
- 2025-08-12 Listed for Rent $1,350 TMLS
Property tax history
+15.1%/yrLatest (2025): $2,034 · +53.7% YoY. Source: county tax records.
Cash-flow waterfall
monthlySold comps — $/sqft
last 12 mo · ≤1 miLoading sold comps…