 🏷️ Likely Rental
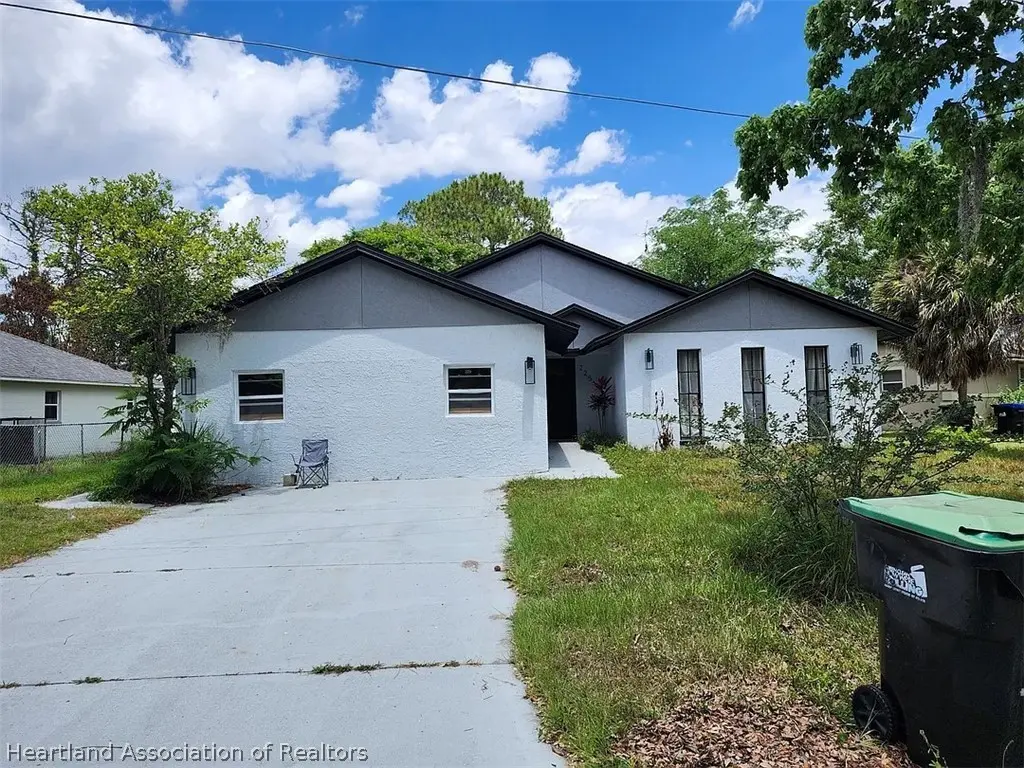
225 Ronnie Cir · Orlovista, FL
Flood risk 5/10 · Moderate
- FEMA flood zone
- AE
- Chance of flooding over 30 yrs
- 0.27%
- Est. flood insurance / yr
- $1,737 – $8,500
Fire risk 1/10 · Minimal
- Est. fire insurance / yr
- $947 – $1,759
Heat risk 8/10 · Major
- Hot days now (above 108°F)
- 7 days/yr
- Hot days in 30 yrs
- 21 days/yr
Wind risk 9/10 · Severe
- Chance of severe wind over 30 yrs
- 99.0%
Air-quality risk 1/10 · Minimal
- Unhealthy air days now
- 0 days/yr
- Unhealthy air days in 30 yrs
- 0 days/yr
Risk factors via First Street. Map © Google.
Why this score? — see what drove the D+ grade
The composite is a weighted blend of 9 inputs, each scored 0–100. Each bar is that input's sub-score; the figure is the points it added to the 100-point composite (weight × sub-score).
- Cash flow +15.0/30.0
- ARV discount +7.5/15.0
- 1% rule +5.0/10.0
- DSCR +5.0/10.0
- Schools +4.1/10.0
- Livability +3.7/5.0
- Rent growth +2.5/5.0
- Condition / age +2.5/5.0
- Appreciation +0.0/10.0
$5,000
🖨 Deal sheet (PDF) 📄 Offer letter ✓ Due diligence
Listing remarks MLS
One or more photo(s) has been virtually staged. WAIT NO LONGER……HERE IS THE HOME YOU HAVE BEEN WAITING FOR! This 3 bedroom 2 bathroom is located in the heart of Orlando. The home has been updated inside and out with fresh paint, vinyl flooring, upgraded bathrooms, new light fixtures, new kitchen cabinets, granite waterfall countertops, fashionable backsplash, and stainless steel appliances. The property has a brand new 2023 roof and a spacious patio area. The property has a lake behind the home which is undergoing maintenance. Move-in ready, don’t miss this opportunity to make this home Your Own!
Key facts
- 0.26 acre lot
- Built 1989
- Listed 6 days
Property features AI
Exterior
- Parking: Driveway; On-street parking
- Utilities: Other water source; Other sewer
- Home design: Single family residence; One story; Residential property
- Construction: Construction materials: see remarks
- Exterior features: Front porch; Other roof
Interior
- Bedrooms: 1 room total
- Flooring: Other
- Bathrooms: 2 full bathrooms
- Heating & cooling: No heating; No cooling
- Interior features: Other flooring
Neighborhood map
What this means for you Summary
Snapshot
- This is a 3-bed/2.0-bath single-family listed at $5k.
Deal economics
- At list price, monthly cash flow is $1k ($15k/yr) — positive.
- The deal already cash-flows at list — no discount required.
- Meets the 1% rule at list price ($2k rent vs $5k).
Location & tenants
- Location reads 74/100 on livability (#268 in FL, #4,405 nationally) — a middle-class / working-renter tenant base. Strengths: commute A+, cost of living A+, housing A+; Watch: employment D, amenities F.
- Orange (suburban): math 46% / reading 51% proficiency, ranked #43 of 73 in FL (top 59%) — families likely to look elsewhere, expect single-tenant / working-renter base with shorter leases.
- Market conditions: Rents flat; 238 active listings in the ZIP; 19 comparable units currently listed for rent nearby; rentals at typical pace (median 16d on market — plan ~3-4 weeks tenant-placement turnaround); 8,053 units permitted in Orange County in 2024 (3,133 in 5+ unit buildings).
- At $2,167/mo this rent would consume 48% of the median local household income ($54k/yr) (locally 2728% of renters already pay >50% of income on rent) — very limited rent-growth headroom before tenants either downsize or default.
Forward outlook
- Local home prices are declining (-3.0%/yr); year-one equity from $35 of loan paydown is wiped out by about $150 of value loss. Plan a longer hold.
- Orange County population projected at +52% by 2050 — long-run rental-demand tailwind backs the buy-and-hold thesis.
- At projected returns (-3.0% appreciation + 0.1% rent growth), your $1k cash investment doubles in ~1 year — after that, you're playing with house money.
Negotiation context
- Only 6 days on market — expect competitive offers; lowballing is unlikely to land.
- 5 sale attempts since 4y ago with the ask held roughly flat each time — persistent listings suggest the price (not the market) is what's stuck; bring a comps-based counter.
Risks & watch-outs
- Watch-outs: flood insurance adds $427/mo.
- Climate carrying-cost: in FEMA flood zone AE (mandatory federal flood insurance); severe wind risk, 99% chance of damaging wind over 30y; extreme-heat days projected 7→21/yr by 2055 (HVAC capex compounding) — expect insurance premiums to compound above CPI over the hold.
Questions for the listing agent
- What's the actual annual flood-insurance premium (NFIP or private), and is the property in a SFHA with mandatory coverage?
- Is there a deadline driving the sale (1031 exchange, divorce, estate, relocation)? That informs how much negotiation room exists.
- Schools are B-rated — typically a magnet for longer-tenancy family renters. What's the average tenant stay here, and is there a school-zone premium baked into asking?
- The area grade is low — what's the realistic commute time and amenity access for the typical tenant pool here? Any planned neighborhood developments (good or bad) we should know about?
- This sits on a lake — are riparian / water-frontage rights deeded with the parcel? Any dock permits, shoreline easements, or HOA water-use restrictions?
- What's the documented flood / surge / shoreline-erosion history here (FEMA AND non-FEMA — e.g., storm surge, creek backup, septic-field saturation)?
- Any water-quality or seasonal algae-bloom issues that affect tenant satisfaction or short-term-rental demand?
- What's the average days-on-market for RENTAL listings here right now (not sales)? A rising rental-DOM trend means longer vacancies and softer asking-rent achievability than the comps imply.
- What's the recent tenant-quality profile in this submarket — average credit score on applications, eviction rate, late-payment / NSF rate, and stable-employment percentage? A property-management company in the area should have these aggregated.
- How much new for-sale + rental construction is in the pipeline within 1–3 miles? Heavy new supply typically softens prices + rents 12–24 months out; constrained supply supports both.
Investment metrics
- 1% rule
- 43.34% ✓
- Cap rate
- 408.86%
- Cash-on-cash
- 1437.72%
- DSCR
- 64.97
- GRM
- 0.2
CMA / ARV
- ARV (on-the-fly)
- $471,156
- Comps found
- 1
Show comp detail 1 sale within ~0.75 mi
| Address | Dist | Beds/Ba | Sqft | Sold | Price | $/sf | Match |
|---|---|---|---|---|---|---|---|
| 128 N Hudson St | 0.58mi | 3/2.0 | 1,898 (-4%) | 23mo | $450,000 | $237 | 47 |
Match score weights: distance 35% · size 25% · config 20% · recency 20%. Top-matched comps best support the ARV.
Projected returns pro-forma
-3.0% appreciation · 0.15% rent growth · sell at horizon
- IRR
- —
- Equity multiple
- 53.22×
- Total profit
- $73,107
- Equity at exit
- $746
- IRR
- —
- Equity multiple
- 103.87×
- Total profit
- $144,020
- Equity at exit
- $432
Cash invested: $1,400 (down + closing). Projections, not guarantees.
Landlord ↔ Tenant lean methodology
- Overall (STATE)
- 87 Strongly Landlord-Friendly
- State Florida
- 87 Strongly Landlord-Friendly · R+3
- County
- — inherits STATE
- City
- — inherits STATE
ZIP-level market 32811
- Home prices YoY
- -33.8%
- Rents YoY
- 0.1%
- Active inventory
- 238
- Price-to-rent
- 0.2×
Monthly cashflow live
- Estimated rent
- $2,167 high interval (Pro) →
- Mortgage (P&I)
- −$26
- Tax est. 1.5%
- −$6 /mo · $75/yr
- Insurance
- −$2
- Flood insurance flood zone
- −$427 /mo · $5,118/yr
- HOA
- −$0
- Vacancy / Maint / Mgmt
- −$455
- Net cashflow
- $1,251
Break-even live
Sensitivity live
| Price | -10% $1,254 | -5% $1,253 | +0% $1,251 | +5% $1,249 | +10% $1,247 |
|---|---|---|---|---|---|
| Rent | -10% $1,080 | -5% $1,165 | +0% $1,251 | +5% $1,336 | +10% $1,422 |
| Rate | -1.0pp $1,253 | -0.5pp $1,252 | base $1,251 | +0.5pp $1,250 | +1.0pp $1,248 |
UW: 25.0% down · 7.5% · 30yr · 1.5% tax · 5.0% vac · 8.0% maint · 8.0% mgmt
Financing live
Cash to close
- Down payment
- $1,250
- Closing costs
- $150
- Reserves months
- —
- Total cash needed
- —
Loan-product check · same deal, 3 products live
Conventional
25% down · 7.5% · 30yr
- Down + closing
- —
- Monthly P&I
- —
- Monthly cashflow
- —
- DSCR
- —
- Eligible?
- —
Personal DTI + credit; lowest rate.
DSCR
20% down · 8.5% · 30yr
- Down + closing
- —
- Monthly P&I
- —
- Monthly cashflow
- —
- DSCR
- —
- Eligible?
- —
No personal income docs; deal must DSCR.
Hard money
10% down · 12.0% · 12mo
- Down + closing
- —
- Monthly P&I
- —
- Monthly cashflow
- —
- DSCR
- —
- Eligible?
- —
Short-term bridge; refi at stabilization.
Rent comps 19 comps
| Address | Beds | Baths | Sqft | Rent | $/sqft | DOM | Units | Dist |
|---|---|---|---|---|---|---|---|---|
| 686 Walkup Dr Orlando, FL | 4.0 | 2.0 | 1400 | $2,050 | $1.46 | 24d | 1 | 0.58mi |
| 4995 Mercer St Orlando, FL | 3.0 | 2.0 | 1386 | $2,500 | $1.80 | 3d | 1 | 0.60mi |
| 5036 College Dr Orlando, FL | 3.0 | 1.0 | 1500 | $1,800 | $1.20 | 24d | 1 | 0.70mi |
| 5425 Wood Crossing St Orlando, FL | 4.0 | 2.0 | 1300 | $2,200 | $1.69 | 5d | 1 | 0.74mi |
| 464 S Kirkman Rd Orlando, FL | 1.0–3.0 | 1.0–2.0 | 977 | $2,375 | $2.43 | 3d | 19 | 0.77mi |
| 4957 Vista Lago Dr Orlando, FL | 4.0 | 2.0 | 1364 | $2,228 | $1.63 | 8d | 1 | 0.89mi |
| 6215 Melbourne Ave Orlando, FL | 3.0 | 2.0 | 1250 | $850 | $0.68 | 18d | 1 | 0.92mi |
| 5979 Westgate Dr #1021 Orlando, FL | 3.0 | 2.0 | 1308 | $1,800 | $1.38 | 15d | 1 | 1.03mi |
| 907 S Kirkman Rd Orlando, FL | 2.0–4.0 | 2.0 | 1131 | $1,660 | $1.47 | 3d | 14 | 1.08mi |
| 5915 Raleigh St Orlando, FL | 1.0–3.0 | 1.0–2.0 | 1039 | $3,204 | $3.08 | 2d | 28 | 1.18mi |
| 4529 W Gore Ave Orlando, FL | 3.0 | 2.0 | 1439 | $2,549 | $1.77 | 20d | 1 | 1.27mi |
| 6101 Raleigh St Orlando, FL | 1.0–4.0 | 1.0–2.0 | 1120 | $1,956 | $1.75 | 3d | 41 | 1.30mi |
| 5377 Rosegay Ct Orlando, FL | 4.0 | 2.0 | 1815 | $2,100 | $1.16 | 24d | 1 | 1.30mi |
| 1303 Charles St Orlando, FL | 3.0 | 2.0 | 1780 | $2,200 | $1.24 | 22d | 1 | 1.30mi |
| 6033 Balboa Dr Orlando, FL | 3.0 | 2.0 | 1269 | $2,300 | $1.81 | 22d | 1 | 1.33mi |
| 1343 Croyle Dr Orlando, FL | 4.0 | 2.0 | 1273 | $1,900 | $1.49 | 24d | 1 | 1.37mi |
| 1213 Roger Babson Rd Unit 1 Orlando, FL | 4.0 | 2.0 | 1380 | $2,499 | $1.81 | 8d | 1 | 1.38mi |
| 6168 Raleigh St Orlando, FL | 1.0–4.0 | 1.0–2.0 | 1261 | $2,388 | $1.89 | 3d | 34 | 1.42mi |
| 325 Crabtree Ave Orlando, FL | 3.0 | 2.0 | 1749 | $2,106 | $1.20 | 22d | 1 | 1.44mi |
Listing history 5 events
-
2026-06-09days on market $5,000 Active 6 DOM
-
2026-06-08days on market $5,000 Active 5 DOM
-
2026-06-07days on market $5,000 Active 4 DOM
-
2026-06-04remarks 295-char remark
-
2026-06-04$5,000 Active 1 DOM
ⓘ Source: listings_history table (triggers on properties + properties_extension) + one-shot
backfill from property_details.listing_events for pre-trigger history.
Climate risk First Street
- Flood 5/10 Major FEMA zone AE · 27% chance over 30 yrs
- Wildfire 1/10 Low
- Heat 8/10 Severe 7 d/yr ≥108°F today · 21 d/yr by 30 yrs out
- Wind 9/10 Extreme 99% chance of damaging wind over 30 yrs
- Air quality 1/10 Low 0 unhealthy d/yr today · 0 by 30 yrs out
Nearby sold comps map
Loading sold comps map…
Walkable amenities ~0.75 mi
Loading nearby amenities…
Taxation est. · year 1
- Rental income
- $26,004
- − Mortgage interest
- −$280
- − Property taxes
- −$75
- − Insurance
- −$5,144
- − Repairs & maintenance
- −$2,080
- − Management
- −$2,080
- − Depreciation
- −$145
- Taxable income
- $16,199
- Est. tax owed @ 24.0%
- −$3,888
- After-tax cash flow
- $11,122/yr
For passive investors: Depreciation is non-cash, so a rental often shows a tax loss while cash-flowing — sheltering income. Rental losses are passive: they offset passive income freely, and up to $25,000/yr can offset ordinary (W-2) income if you actively participate and your MAGI is under $100k (phasing out to $0 by $150k); unused losses carry forward. On sale, claimed depreciation is recaptured at up to 25%, and gains may owe capital-gains tax (a 1031 exchange can defer both). Figures are a year-1 estimate at your 24.0% rate — not tax advice; consult a CPA.
Schools (NCES district)
- District
- Orange
- NCES district ID
- 1201440
- Math proficiency
- 46% ▼ -9.00%
- Reading proficiency
- 51% ▼ -2.00%
- Median HH income
- $49,350
- Composite
- 41.47/100
- National rank
- #3461
- State rank
- #43 of 73 in FL
Livability — Orlovista
- Score
- 74/100
- State rank
- #268
- US rank
- #4405
Category grades
Schools grade is shown separately in the Schools card above.
Census & demographics
- Census place
- Orlovista, FL
- County
- Orange County · 1,471,359 people
- Metro
- Orlando-Kissimmee-Sanford, FL
- Population (ZIP)
- 41,475
- Household income
- $54,082
- Rent vs Own
- Severe rent burden
- 2728.0
Population outlook (Orange County) Hauer SSP2
- Today (2025)
- 1,618,226 people
- By 2030
- 1,787,404 · +10.5%
- By 2040
- 2,125,621 · +31.4%
- By 2050
- 2,454,016 · +51.6%
- By 2075
- 3,173,711 · +96.1%
- By 2100
- 3,607,781 · +122.9%
Race, ethnicity, and origin ACS 2023
- Neighborhood character
- Diverse neighborhood (Simpson 0.66)
- Race & ethnicity
- Black 50% Hispanic / Latino 27% Two or more races 17% White 12% Asian 2%
- Hispanic origin (detail)
- Mexican 2% Puerto Rican 8% Dominican 2%
- Common ancestry
- Hispanic 7% Estonian 4% Russian 1%
- Foreign-born
- 31% · Canada, Jamaica, China
- Languages at home
- 62% English-only · Spanish 21% French/Haitian/Cajun 8% Other Indo-European 6%
Political lean MEDSL · Orange
- 2024 margin
- D (+13.6) · D 56.1% · R 42.5% · Other 1.3%
- 2008→2024 swing
- -5.0pp toward R · 2008: 18.6pp · 2024: 13.6pp
- All cycles
- 2024: D+13.6 2020: D+23.1 2016: D+24.6 2012: D+18.2 2008: D+18.6
Not yet ingested
- Civics
- —
Market trends
- HPI YoY
- ▼ -145.37%
- Current HPI
- 284.9191
- Rent YoY
- ▲ 0.15%
- Metro
- Orlando-Kissimmee-Sanford, FL
- State GDP YoY
- ▲ 3.28%
- F500 in state
- 36
Industry mix (Fortune 500 HQ in FL)
| Industry | F500 HQs | Revenue |
|---|---|---|
| Industrial Technology | 2 | $29B |
|
||
| Insurance | 2 | $17B |
|
||
| Retail | 1 | $60B |
|
||
| Technology Distribution | 1 | $58B |
|
||
| Homebuilding | 1 | $35B |
|
||
| Technology Manufacturing | 1 | $35B |
|
||
Price history
-93.8% since first listed12 events — show timeline
- 2026-06-03 Listed $5,000 HAOR as distributed by MLS GRID
- 2025-04-29 Listed $297,900 Stellar MLS as Distributed by MLS Grid
- 2024-03-19 Sold (Public Records) $343,500 Public Records
- 2024-03-15 Sold (MLS) $343,500 Stellar MLS as Distributed by MLS Grid
- 2024-02-02 Pending — Stellar MLS as Distributed by MLS Grid
- 2024-01-21 Listed $355,000 Stellar MLS as Distributed by MLS Grid
- 2023-10-03 Sold (Public Records) $200,000 Public Records
- 2022-06-28 Pending — Stellar MLS as Distributed by MLS Grid
- 2022-06-10 Relisted — Stellar MLS as Distributed by MLS Grid
- 2022-06-03 Pending — Stellar MLS as Distributed by MLS Grid
- 2022-05-13 Listed $210,000 Stellar MLS as Distributed by MLS Grid
- 2000-08-30 Sold (Public Records) $80,000 Public Records
Property tax history
+15.9%/yrLatest (2025): $5,019 · -23.3% YoY. Source: county tax records.
Cash-flow waterfall
monthlySold comps — $/sqft
last 12 mo · ≤1 miLoading sold comps…