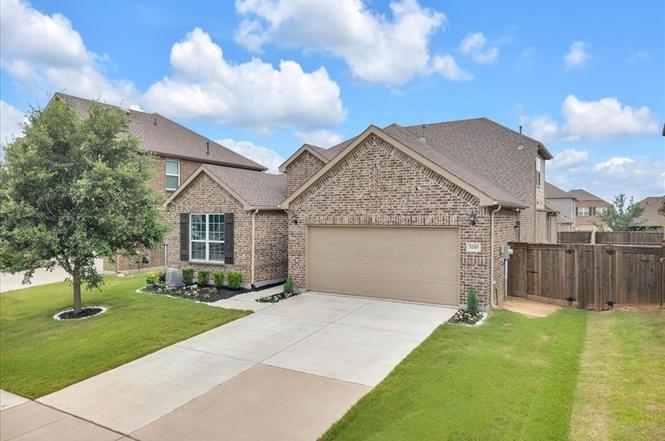
3210 S Linham Dr · Mansfield, TX
Flood risk 1/10 · Minimal
- FEMA flood zone
- X (unshaded)
- Chance of flooding over 30 yrs
- 0.0%
- Est. flood insurance / yr
- $507 – $1,088
Fire risk 5/10 · Moderate
- Est. fire insurance / yr
- $1,222 – $2,270
Heat risk 8/10 · Major
- Hot days now (above 110°F)
- 7 days/yr
- Hot days in 30 yrs
- 24 days/yr
Wind risk 6/10 · Moderate
- Chance of severe wind over 30 yrs
- 27.0%
Air-quality risk 2/10 · Minimal
- Unhealthy air days now
- 2 days/yr
- Unhealthy air days in 30 yrs
- 2 days/yr
Risk factors via First Street. Map © Google.
Why this score? — see what drove the D grade
The composite is a weighted blend of 9 inputs, each scored 0–100. Each bar is that input's sub-score; the figure is the points it added to the 100-point composite (weight × sub-score).
- ARV discount +10.7/15.0
- Appreciation +8.7/10.0
- Cash flow +5.3/30.0
- Schools +4.6/10.0
- Livability +3.6/5.0
- Rent growth +3.1/5.0
- Condition / age +2.5/5.0
- 1% rule +2.1/10.0
- DSCR +0.0/10.0
$474,900
🖨 Deal sheet (PDF) 📄 Offer letter ✓ Due diligence
Listing remarks
Welcome to this beautifully maintained Pulte Homes residence, built in 2020, and located in the highly desirable Somerset community in Mansfield, Texas. Offering an ideal blend of comfort, functionality, and convenience, this spacious home features 4 bedrooms, 3 full bathrooms, and multiple living areas designed for today’s lifestyle. The private primary suite serves as a relaxing retreat with a large walk-in closet, double vanity, and a luxurious ensuite bath featuring a separate shower and soaking tub. Three additional bedrooms provide flexibility for family, guests, or a home office. The thoughtfully designed floor plan includes a spacious game room, second living area, perfect for
Key facts
- Double vanity
- Soaking tub
- Separate shower
Tags
Property features AI
Finance
- Other: Deed restrictions apply; Listing possession: 30–60 days or at closing/funding
- Financial info: Acceptable financing: Cash, Conventional, FHA, VA
- HOA & community: Mandatory HOA with annual fee; fee covers grounds maintenance; HOA managed by First Service Residential; Community amenities include pool, community sprinkler, lake, perimeter fencing, restaurant, and sidewalks
Exterior
- Parking: Attached 2-car garage with automatic garage door opener; 2 covered parking spaces; Driveway
- Security: Fire sprinkler system; Smoke detectors
- Utilities: City water; City sewer; No municipal utility district
- Home design: Single-family residence; Two stories; Property attached: Yes; Built in 2020; Smart home features present; Planned development community
- Construction: Brick construction; Composition roof; Slab foundation
- Exterior features: Covered porch(es); Covered patio/porch; Gutters; Outdoor lighting; Private yard; Wood fencing; Sprinkler system; Landscaped, interior lot; Subdivision setting; Access to Joe Pool (waterbody nearby)
Interior
- Kitchen: Built-in gas range; Gas range; Dishwasher; Disposal; Microwave; Farm sink; Granite countertops; Kitchen island; Eat-in area; Water line to refrigerator; Space for a freezer; Pantry
- Bedrooms: 4 bedrooms total; Primary bedroom on main level with walk-in closet; Additional bedrooms include three with walk-in closets (two on main level, one upstairs)
- Flooring: Carpet; Tile; Vinyl
- Bathrooms: 3 full bathrooms; Primary bathroom with garden tub, separate vanities and sitting area
- Heating & cooling: Central heating; Electric heating; Electric cooling
- Interior features: Cable TV available; Double vanity; Eat-in kitchen; Granite counters; Kitchen island; Pantry; Walk-in closets; 2 living areas; 2 dining areas; 13 total rooms; Fireplace (gas)
- Laundry & utility: Laundry room with washer hookup (in hall); Dryer included (appliance listed)
Neighborhood map
What this means for you Summary
Snapshot
- This is a 4-bed/3.0-bath single-family listed at $475k.
Deal economics
- At list price, monthly cash flow is $-1k ($-13k/yr) — negative.
- To cash-flow at today's rent, offer at most $290k (39.0% below list).
- To meet the 1% rule (rent ≥ 1% of price), the offer needs to be $335k (29.4% below list).
- Recommended offer: $290k (39.0% below list) — sets the bar for cash-flow.
- Cap rate 3.6% vs local median 2.8% in Mansfield — meaningfully above typical; check what's discounted (condition, days-on-market, listing class) to confirm the premium yield is real.
Location & tenants
- Location reads 72/100 on livability (#243 in TX) — a middle-class / working-renter tenant base. Strengths: employment A+, housing A+, crime A; Watch: amenities F, commute F, health & safety D-.
- Mansfield ISD (suburban): math 47% / reading 53% proficiency, ranked #125 of 826 in TX (top 15%) — acceptable for families but not a draw, mixed tenant base, ~2y average lease.
- Zoned schools: Brenda Norwood El (647 students, 36% FRL); Rogene Worley Middle (math 46% / reading 51%, grade C-, #392 of 1,662 statewide, top 24%, 686 students, 48% FRL); Mansfield Lake Ridge H S (math 62% / reading 72%, grade B, #163 of 1,632 statewide, top 11%, 2,653 students, 28% FRL) — zoned schools at 37% FRL track the district average.
- Market conditions: Rents rising (+2.4%/yr); 427 active listings in the ZIP; 3 comparable units currently listed for rent nearby; rentals at typical pace (median 26d on market — plan ~3-4 weeks tenant-placement turnaround); solid renter incomes; 2,152 units permitted in Johnson County in 2024 (76 in 5+ unit buildings).
- This rent runs 39% of the median local income ($102k/yr) — at the standard rent-burdened threshold; future hikes will face affordability resistance.
Forward outlook
- In year one you build about $38k of equity ($3k loan paydown + $35k appreciation (7.3% local appreciation)).
- Johnson County population projected at +24% by 2050 — long-run rental-demand tailwind backs the buy-and-hold thesis.
- By year 2, paydown + projected appreciation supports a ~$61k cash-out refi (75% LTV) — recoverable capital for the next deal without selling this one.
Negotiation context
- Only 5 days on market — expect competitive offers; lowballing is unlikely to land.
Risks & watch-outs
- Climate carrying-cost: major wind risk, 27% chance of damaging wind over 30y; moderate wildfire risk; extreme-heat days projected 7→24/yr by 2055 (HVAC capex compounding) — expect insurance premiums to compound above CPI over the hold.
Questions for the listing agent
- What do current leases actually rent for vs. the listed asking? Can we see a recent rent roll and the last 12 months of T-12 income?
- What does the HOA fee cover, when was the last increase, and are there any pending special assessments or reserve-fund shortfalls?
- Is there a deadline driving the sale (1031 exchange, divorce, estate, relocation)? That informs how much negotiation room exists.
- Schools are A-rated — typically a magnet for longer-tenancy family renters. What's the average tenant stay here, and is there a school-zone premium baked into asking?
- The area grade is low — what's the realistic commute time and amenity access for the typical tenant pool here? Any planned neighborhood developments (good or bad) we should know about?
- What's the average days-on-market for RENTAL listings here right now (not sales)? A rising rental-DOM trend means longer vacancies and softer asking-rent achievability than the comps imply.
- What's the recent tenant-quality profile in this submarket — average credit score on applications, eviction rate, late-payment / NSF rate, and stable-employment percentage? A property-management company in the area should have these aggregated.
- How much new for-sale + rental construction is in the pipeline within 1–3 miles? Heavy new supply typically softens prices + rents 12–24 months out; constrained supply supports both.
Investment metrics
- 1% rule
- 0.71% ✗
- Cap rate
- 3.64%
- Cash-on-cash
- -9.46%
- DSCR
- 0.58
- GRM
- 11.8
CMA / ARV
- ARV (on-the-fly)
- $511,420
- Comps found
- 12
Show comp detail 12 sales within ~0.75 mi
| Address | Dist | Beds/Ba | Sqft | Sold | Price | $/sf | Match |
|---|---|---|---|---|---|---|---|
| 3204 Paxon Dr | 0.13mi | 4/3.5 | 2,804 (-0%) | 5mo | $480,000 | $171 | 88 |
| 2514 Wallingford Dr | 0.20mi | 4/2.5 | 2,821 (+0%) | 2mo | $460,000 | $163 | 86 |
| 3113 Linham Dr | 0.08mi | 4/3.5 | 2,650 (-6%) | 2mo | $440,000 | $166 | 83 |
| 3212 Linham Dr | 0.01mi | 4/3.5 | 3,122 (+11%) | 5mo | $459,990 | $147 | 75 |
| 2515 Wallingford Dr | 0.17mi | 4/2.5 | 2,557 (-9%) | 1mo | $475,000 | $186 | 74 |
| 2523 Linwood Dr | 0.12mi | 4/3.5 | 3,126 (+11%) | 4mo | $490,000 | $157 | 70 |
| 2508 Lakeway Ln | 0.20mi | 3/3.0 (-1) | 2,527 (-10%) | 2mo | $554,990 | $220 | 67 |
| 2411 Hagen Dr | 0.49mi | 3/2.5 (-1) | 2,778 (-1%) | 2mo | $549,990 | $198 | 67 |
| 2611 Alden Ln | 0.33mi | 4/3.0 | 2,554 (-9%) | 4mo | $490,000 | $192 | 66 |
| 2812 Creswick Dr | 0.41mi | 4/3.0 | 3,042 (+8%) | 4mo | $515,000 | $169 | 64 |
| 2209 Birch St | 0.63mi | 4/4.0 | 2,932 (+4%) | 3mo | $624,990 | $213 | 57 |
| 2504 Veranda Way | 0.69mi | 4/3.0 | 2,524 (-10%) | 1mo | $459,900 | $182 | 50 |
Match score weights: distance 35% · size 25% · config 20% · recency 20%. Top-matched comps best support the ARV.
Projected returns pro-forma
7.32% appreciation · 2.39% rent growth · sell at horizon
- IRR
- 11.1%
- Equity multiple
- 1.80×
- Total profit
- $106,701
- Equity at exit
- $339,088
- IRR
- 11.7%
- Equity multiple
- 3.68×
- Total profit
- $355,847
- Equity at exit
- $653,376
Cash invested: $132,972 (down + closing). Projections, not guarantees.
Landlord ↔ Tenant lean methodology
- Overall (STATE)
- 87 Strongly Landlord-Friendly
- State Texas
- 87 Strongly Landlord-Friendly · R+5
- County
- — inherits STATE
- City
- — inherits STATE
ZIP-level market 76084
- Home prices YoY
- 2.1%
- Rents YoY
- 2.4%
- Active inventory
- 427
- Price-to-rent
- 11.8×
Monthly cashflow live
- Estimated rent
- $3,354 medium interval (Pro) →
- Mortgage (P&I)
- −$2,490
- Tax from tax record
- −$934 /mo · $11,204/yr
- Insurance
- −$198
- HOA
- −$76
- Vacancy / Maint / Mgmt
- −$704
- Net cashflow
- $-1,049
Break-even live
Sensitivity live
| Price | -10% $-780 | -5% $-914 | +0% $-1,049 | +5% $-1,183 | +10% $-1,317 |
|---|---|---|---|---|---|
| Rent | -10% $-1,314 | -5% $-1,181 | +0% $-1,049 | +5% $-916 | +10% $-784 |
| Rate | -1.0pp $-809 | -0.5pp $-928 | base $-1,049 | +0.5pp $-1,172 | +1.0pp $-1,297 |
UW: 25.0% down · 7.5% · 30yr · 1.5% tax · 5.0% vac · 8.0% maint · 8.0% mgmt
Financing live
Cash to close
- Down payment
- $118,725
- Closing costs
- $14,247
- Reserves months
- —
- Total cash needed
- —
Loan-product check · same deal, 3 products live
Conventional
25% down · 7.5% · 30yr
- Down + closing
- —
- Monthly P&I
- —
- Monthly cashflow
- —
- DSCR
- —
- Eligible?
- —
Personal DTI + credit; lowest rate.
DSCR
20% down · 8.5% · 30yr
- Down + closing
- —
- Monthly P&I
- —
- Monthly cashflow
- —
- DSCR
- —
- Eligible?
- —
No personal income docs; deal must DSCR.
Hard money
10% down · 12.0% · 12mo
- Down + closing
- —
- Monthly P&I
- —
- Monthly cashflow
- —
- DSCR
- —
- Eligible?
- —
Short-term bridge; refi at stabilization.
Rent comps 3 comps
| Address | Beds | Baths | Sqft | Rent | $/sqft | DOM | Units | Dist |
|---|---|---|---|---|---|---|---|---|
| 3406 Woodford Dr Venus, TX | 4.0 | 4.0 | 3494 | $3,500 | $1.00 | 45d | 1 | 0.44mi |
| 3406 Woodford Dr Venus, TX | 4.0 | 3.5 | 3494 | $3,500 | $1.00 | 0d | 1 | 0.44mi |
| 1612 Birch St Mansfield, TX | 4.0 | 3.0 | 2593 | $3,399 | $1.31 | 26d | 1 | 1.15mi |
HOA detail
- Monthly dues
- $76 · $912/yr
Listing history 4 events
-
2026-06-21days on market $474,900 Active 5 DOM
-
2026-06-18days on market $474,900 Active 2 DOM
-
2026-06-17remarks 693-char remark
-
2026-06-17$474,900 Active 1 DOM
ⓘ Source: listings_history table (triggers on properties + properties_extension) + one-shot
backfill from property_details.listing_events for pre-trigger history.
Tax reassessment forecast TX · Resets to sale price
- Current annual tax
- $11,204 · $934/mo
- Projected year-2 tax
- $11,204 · $934/mo
- Expected delta
- $0/yr ($0/mo · 0.0%)
ⓘ Screening estimate from a state-policy table — verify with the county assessor before closing.
Climate risk First Street
- Flood 1/10 Low FEMA zone X (unshaded) · 0% chance over 30 yrs
- Wildfire 5/10 Major
- Heat 8/10 Severe 7 d/yr ≥110°F today · 24 d/yr by 30 yrs out
- Wind 6/10 Major 27% chance of damaging wind over 30 yrs
- Air quality 2/10 Low 2 unhealthy d/yr today · 2 by 30 yrs out
Nearby sold comps map
Loading sold comps map…
Walkable amenities ~0.75 mi
Loading nearby amenities…
Taxation est. · year 1
- Rental income
- $40,243
- − Mortgage interest
- −$26,602
- − Property taxes
- −$11,204
- − Insurance
- −$2,374
- − Repairs & maintenance
- −$3,219
- − Management
- −$3,219
- − HOA
- −$912
- − Depreciation
- −$13,815
- Taxable loss
- −$21,103
- Est. tax savings @ 24.0%
- +$5,065
- After-tax cash flow
- $-7,519/yr
For passive investors: Depreciation is non-cash, so a rental often shows a tax loss while cash-flowing — sheltering income. Rental losses are passive: they offset passive income freely, and up to $25,000/yr can offset ordinary (W-2) income if you actively participate and your MAGI is under $100k (phasing out to $0 by $150k); unused losses carry forward. On sale, claimed depreciation is recaptured at up to 25%, and gains may owe capital-gains tax (a 1031 exchange can defer both). Figures are a year-1 estimate at your 24.0% rate — not tax advice; consult a CPA.
Schools (NCES district)
- District
- Mansfield ISD
- NCES district ID
- 4828920
- Math proficiency
- 47% ▼ -17.00%
- Reading proficiency
- 53% ▼ -6.00%
- Median HH income
- $81,934
- Composite
- 45.82/100
- National rank
- #2558
- State rank
- #125 of 826 in TX
Livability — Mansfield
- Score
- 72/100
- State rank
- #243
- US rank
- #5833
Category grades
Schools grade is shown separately in the Schools card above.
Census & demographics
- Census place
- Mansfield, TX
- County
- Johnson County · 147,987 people
- City population
- 82,625
- Metro
- Dallas-Fort Worth-Arlington, TX
- Population (ZIP)
- 14,097
- Household income
- $102,115
- Rent vs Own
- Severe rent burden
- 70.0
Population outlook (Johnson County) Hauer SSP2
- Today (2025)
- 179,678 people
- By 2030
- 189,208 · +5.3%
- By 2040
- 207,261 · +15.4%
- By 2050
- 223,064 · +24.1%
- By 2075
- 259,979 · +44.7%
- By 2100
- 275,395 · +53.3%
Race, ethnicity, and origin ACS 2023
- Neighborhood character
- Diverse neighborhood (Simpson 0.63)
- Race & ethnicity
- White 52% Hispanic / Latino 30% Two or more races 24% Black 11% Asian 1%
- Hispanic origin (detail)
- Mexican 25% Puerto Rican 1%
- Common ancestry
- Romanian 2% Lithuanian 1% Slovak 1%
- Foreign-born
- 8% · Canada
- Languages at home
- 78% English-only · Spanish 18% Arabic 1% French/Haitian/Cajun 1%
Political lean MEDSL · Johnson
- 2024 margin
- Solid R (+51.4) · D 23.9% · R 75.3%
- 2008→2024 swing
- -3.9pp toward R · 2008: -47.5pp · 2024: -51.4pp
- All cycles
- 2024: R+51.4 2020: R+53.0 2016: R+58.3 2012: R+55.6 2008: R+47.5
Not yet ingested
- Civics
- —
Market trends
- HPI YoY
- ▲ 7.32%
- Current HPI
- 355.74
- Rent YoY
- ▲ 2.39%
- Metro
- Dallas-Fort Worth-Arlington, TX
- State GDP YoY
- ▲ 3.95%
- F500 in state
- 110
Industry mix (Fortune 500 HQ in TX)
| Industry | F500 HQs | Revenue |
|---|---|---|
| Energy | 16 | $1,198B |
|
||
| Technology | 5 | $198B |
|
||
| Engineering / Construction | 4 | $72B |
|
||
| Energy Services | 3 | $60B |
|
||
| Utilities | 3 | $41B |
|
||
| Healthcare | 2 | $330B |
|
||
Price history
1 event — show timeline
- 2026-06-10 Listed $474,900 NTREIS
Property tax history
+52.4%/yrLatest (2025): $11,204 · +0.2% YoY. Source: county tax records.
Cash-flow waterfall
monthlySold comps — $/sqft
last 12 mo · ≤1 miLoading sold comps…