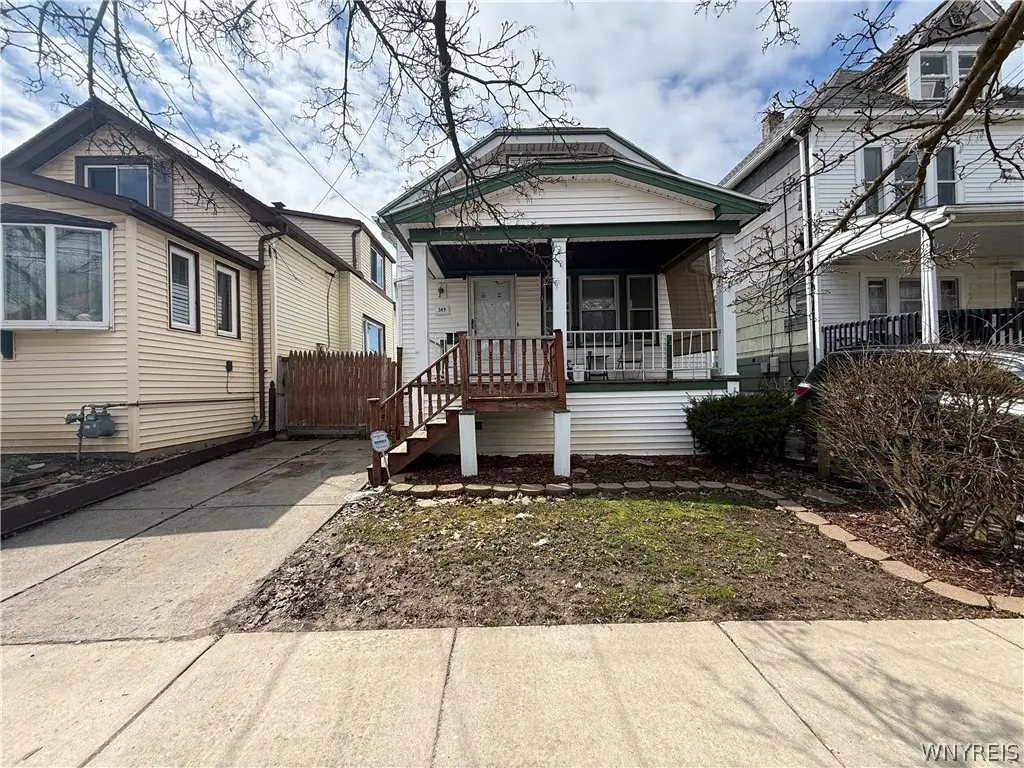
349 Riverside Ave · Buffalo, NY
Flood risk 1/10 · Minimal
- FEMA flood zone
- X (unshaded)
- Chance of flooding over 30 yrs
- 0.0%
- Est. flood insurance / yr
- $507 – $1,088
Fire risk 1/10 · Minimal
- Est. fire insurance / yr
- $691 – $1,283
Heat risk 3/10 · Minor
- Hot days now (above 93°F)
- 7 days/yr
- Hot days in 30 yrs
- 15 days/yr
Wind risk 1/10 · Minimal
- Chance of severe wind over 30 yrs
- —
Air-quality risk 3/10 · Minor
- Unhealthy air days now
- 3 days/yr
- Unhealthy air days in 30 yrs
- 4 days/yr
Risk factors via First Street. Map © Google.
Why this score? — see what drove the C grade
The composite is a weighted blend of 9 inputs, each scored 0–100. Each bar is that input's sub-score; the figure is the points it added to the 100-point composite (weight × sub-score).
- Cash flow +19.6/30.0
- ARV discount +15.0/15.0
- DSCR +6.2/10.0
- Rent growth +4.5/5.0
- Livability +3.9/5.0
- 1% rule +3.8/10.0
- Schools +3.3/10.0
- Condition / age +2.5/5.0
- Appreciation +0.0/10.0
$164,900
🖨 Deal sheet 📄 Offer letter ✓ Due diligence
Listing remarks MLS
This charming single-family home at 349 Riverside Ave in Buffalo offers a fantastic opportunity for both owner-occupants and investors. Featuring 4 bedroom and 1 bathrooms, the layout includes a convenient first-floor bedroom ideal for accessibility or flexible living arrangements. The property boasts solid mechanical systems, ensuring reliability and peace of mind. Additional highlights include a full basement providing ample storage or potential for customization, and off-street parking for multiple vehicles. Located near public transportation and shopping, this home combines comfort with convenience in a desirable Buffalo neighborhood. Whether you're looking to settle in or add to your investment portfolio, this residence delivers great value and potential.
Key facts
- First-floor bedroom
- Full basement
- Shopping
Tags
Neighborhood map
What this means for you Summary
Snapshot
- This is a 4-bed/1.5-bath single-family listed at $165k.
Deal economics
- At list price, monthly cash flow is $189 ($2k/yr) — positive.
- The deal already cash-flows at list — no discount required.
- To meet the 1% rule (rent ≥ 1% of price), the offer needs to be $146k (11.7% below list).
- Recommended offer: $146k (11.7% below list) — sets the bar for 1% rule.
Location & tenants
- Location reads 77/100 on livability (#195 in NY, #3,011 nationally) — a middle-class / working-renter tenant base. Strengths: commute A+, housing A+, health & safety A+; Watch: crime F, employment D-.
- Buffalo City School District (urban): math 41% / reading 40% proficiency, ranked #535 of 590 in NY (top 91%) — families likely to look elsewhere, expect single-tenant / working-renter base with shorter leases; 75% free/reduced lunch — lower-income household profile, screen leases tightly.
- Market conditions: Rents rising fast (+8.2%/yr); 197 active listings in the ZIP; 10 comparable units currently listed for rent nearby; rentals at typical pace (median 24d on market — plan ~3-4 weeks tenant-placement turnaround); lower-income renter base — watch delinquency; 1,244 units permitted in Erie County in 2024 (563 in 5+ unit buildings).
- This rent runs 44% of the median local income ($40k/yr) — at the standard rent-burdened threshold; future hikes will face affordability resistance.
Forward outlook
- Local home prices are declining (-3.0%/yr); year-one equity from $1k of loan paydown is wiped out by about $5k of value loss. Plan a longer hold.
- At projected returns (-3.0% appreciation + 8.0% rent growth), your $46k cash investment doubles in ~10 years — after that, you're playing with house money.
Negotiation context
- It's been on market 66 days — a 6% lower offer ($155k) is reasonable based on typical stale-listing flexibility.
- Current owner paid $22k; list at $165k implies a 650% gain — meaningful room to come down on a strong offer.
Risks & watch-outs
- Watch-outs: built in 1932 — expect roof / HVAC / electrical / plumbing capex.
Questions for the listing agent
- It's been on market 66 days. Have you received any prior offers? Is the seller open to a 12% concession, seller financing, or rate buy-down credit?
- Built in 1932 — when were the roof, HVAC, electrical panel, plumbing, and water heater last replaced?
- Why hasn't it sold? Are there any deal-killer items the seller is aware of (foundation, flood, title, zoning, code violations)?
- Is there a deadline driving the sale (1031 exchange, divorce, estate, relocation)? That informs how much negotiation room exists.
- Crime grade is F in this area — have there been break-ins, vandalism, or insurance claims at this property in the last 3 years? What carrier currently insures it and at what premium?
- What's the average days-on-market for RENTAL listings here right now (not sales)? A rising rental-DOM trend means longer vacancies and softer asking-rent achievability than the comps imply.
- What's the recent tenant-quality profile in this submarket — average credit score on applications, eviction rate, late-payment / NSF rate, and stable-employment percentage? A property-management company in the area should have these aggregated.
- How much new for-sale + rental construction is in the pipeline within 1–3 miles? Heavy new supply typically softens prices + rents 12–24 months out; constrained supply supports both.
Investment metrics
- 1% rule
- 0.88% ✗
- Cap rate
- 7.67%
- Cash-on-cash
- 4.91%
- DSCR
- 1.22
- GRM
- 9.4
CMA / ARV
- ARV (median comp)
- $211,387
- List price
- $164,900
- Delta
- -21.99%
- Verdict
- UNDERPRICED
- Comps
- 20 within 1.0 mi
Show comp detail 12 sales within ~0.75 mi
| Address | Dist | Beds/Ba | Sqft | Sold | Price | $/sf | Match |
|---|---|---|---|---|---|---|---|
| 56 Gallatin Ave | 0.16mi | 3/1.5 (-1) | 1,052 (-5%) | 2mo | $178,000 | $169 | 78 |
| 82 Beatrice Ave | 0.49mi | 3/1.0 (-1) | 1,166 (+5%) | 2mo | $165,000 | $142 | 59 |
| 19 Royal Ave | 0.51mi | 4/1.0 | 1,021 (-8%) | 2mo | $159,547 | $156 | 59 |
| 221 Newfield St | 0.74mi | 4/1.5 | 1,127 (+2%) | 4mo | $75,000 | $67 | 59 |
| 36 Layer Ave | 0.54mi | 3/1.0 (-1) | 1,040 (-6%) | 0mo | $185,000 | $178 | 58 |
| 62 Chadduck Ave | 0.39mi | 3/1.0 (-1) | 1,240 (+12%) | 2mo | $155,000 | $125 | 53 |
| 94 Farmer St | 0.74mi | 3/1.0 (-1) | 1,100 (-1%) | 6mo | $35,000 | $32 | 53 |
| 63 Briggs Ave | 0.43mi | 3/1.0 (-1) | 974 (-12%) | 0mo | $180,000 | $185 | 52 |
| 38 Wyandotte Ave | 0.65mi | 4/1.0 | 1,200 (+8%) | 2mo | $150,000 | $125 | 52 |
| 136 Newfield St | 0.60mi | 3/1.5 (-1) | 1,198 (+8%) | 2mo | $167,000 | $139 | 52 |
| 195 Hertel Ave | 0.55mi | 3/1.0 (-1) | 1,236 (+12%) | 1mo | $110,000 | $89 | 47 |
| 5 Ruhl Ave | 0.53mi | 3/1.0 (-1) | 964 (-13%) | 0mo | $234,100 | $243 | 46 |
Match score weights: distance 35% · size 25% · config 20% · recency 20%. Top-matched comps best support the ARV.
Projected returns pro-forma
-3.0% appreciation · 8.0% rent growth · sell at horizon
- IRR
- -3.9%
- Equity multiple
- 0.85×
- Total profit
- $-7,082
- Equity at exit
- $24,587
- IRR
- 10.2%
- Equity multiple
- 1.95×
- Total profit
- $44,004
- Equity at exit
- $14,258
Cash invested: $46,172 (down + closing). Projections, not guarantees.
Landlord ↔ Tenant lean methodology
- Overall (STATE)
- 15 Strongly Tenant-Friendly
- State New York
- 15 Strongly Tenant-Friendly · D+10
- County
- — inherits STATE
- City
- — inherits STATE
ZIP-level market 14207
- Home prices YoY
- -18.9%
- Rents YoY
- 8.2%
- Active inventory
- 197
- Price-to-rent
- 9.4×
Monthly cashflow live
- Estimated rent
- $1,457 high interval (Pro) →
- Mortgage (P&I)
- −$865
- Tax from tax record
- −$28 /mo · $342/yr
- Insurance
- −$69
- HOA
- −$0
- Vacancy / Maint / Mgmt
- −$306
- Net cashflow
- $189
Break-even live
UW: 25.0% down · 7.5% · 30yr · 1.5% tax · 5.0% vac · 8.0% maint · 8.0% mgmt
Financing live
Cash to close
- Down payment
- $41,225
- Closing costs
- $4,947
- Reserves months
- —
- Total cash needed
- —
Loan-product check · same deal, 3 products live
Conventional
25% down · 7.5% · 30yr
- Down + closing
- —
- Monthly P&I
- —
- Monthly cashflow
- —
- DSCR
- —
- Eligible?
- —
Personal DTI + credit; lowest rate.
DSCR
20% down · 8.5% · 30yr
- Down + closing
- —
- Monthly P&I
- —
- Monthly cashflow
- —
- DSCR
- —
- Eligible?
- —
No personal income docs; deal must DSCR.
Hard money
10% down · 12.0% · 12mo
- Down + closing
- —
- Monthly P&I
- —
- Monthly cashflow
- —
- DSCR
- —
- Eligible?
- —
Short-term bridge; refi at stabilization.
Rent comps 10 comps
| Address | Beds | Baths | Sqft | Rent | $/sqft | DOM | Units | Dist |
|---|---|---|---|---|---|---|---|---|
| 118 Rano St Buffalo, NY | 3.0 | 1.0 | 1050 | $1,200 | $1.14 | 21d | 1 | 0.18mi |
| 134 Philadelphia St Buffalo, NY | 3.0 | 1.0 | 871 | $1,100 | $1.26 | 2d | 1 | 0.44mi |
| 158 Chadduck Ave Buffalo, NY | 4.0 | 1.0 | 1200 | $1,250 | $1.04 | 23d | 1 | 0.47mi |
| 15 Ontario St Unit 1 Buffalo, NY | 3.0 | 1.0 | 1000 | $1,500 | $1.50 | 1d | 1 | 0.56mi |
| 480 W Hazeltine Ave Buffalo, NY | 3.0 | 1.0 | 989 | $1,900 | $1.92 | 23d | 1 | 0.76mi |
| 72 Reservation St Unit 2 Buffalo, NY | 3.0 | 1.0 | 950 | $1,150 | $1.21 | 23d | 1 | 0.88mi |
| 62 Seabrook St Buffalo, NY | 4.0 | 1.0 | 1300 | $2,000 | $1.54 | 1d | 1 | 0.89mi |
| 62 Germain St Buffalo, NY | 3.0 | 1.0 | 1320 | $1,250 | $0.95 | 23d | 1 | 0.94mi |
| 139 Fordham Dr Buffalo, NY | 3.0 | 1.0 | 1453 | $1,700 | $1.17 | 23d | 1 | 1.32mi |
| 2522 Delaware Ave Buffalo, NY | 3.0 | 1.0 | 1150 | $1,625 | $1.41 | 1d | 1 | 1.46mi |
Listing history 16 events
-
2026-06-18days on market $164,900 Active 66 DOM
-
2026-06-17days on market $164,900 Active 65 DOM
-
2026-06-16days on market $164,900 Active 64 DOM
-
2026-06-15days on market $164,900 Active 63 DOM
-
2026-06-13days on market $164,900 Active 61 DOM
-
2026-06-13days on market $164,900 Active 60 DOM
-
2026-06-10days on market $164,900 Active 58 DOM
-
2026-06-09days on market $164,900 Active 57 DOM
-
2026-06-08days on market $164,900 Active 56 DOM
-
2026-06-07days on market $164,900 Active 55 DOM
-
2026-06-03days on market $164,900 Active 51 DOM
-
2026-06-02days on market $164,900 Active 50 DOM
-
2026-06-01days on market $164,900 Active 49 DOM
-
2026-05-31days on market $164,900 Active 48 DOM
-
2026-04-13$164,900 Active 770-char remark
Show marketing remark (770 chars)
This charming single-family home at 349 Riverside Ave in Buffalo offers a fantastic opportunity for both owner-occupants and investors. Featuring 4 bedroom and 1 bathrooms, the layout includes a convenient first-floor bedroom ideal for accessibility or flexible living arrangements. The property boasts solid mechanical systems, ensuring reliability and peace of mind. Additional highlights include a full basement providing ample storage or potential for customization, and off-street parking for multiple vehicles. Located near public transportation and shopping, this home combines comfort with convenience in a desirable Buffalo neighborhood. Whether you're looking to settle in or add to your investment portfolio, this residence delivers great value and potential.
-
2012-05-29soldstatus $22,000
ⓘ Source: listings_history table (triggers on properties + properties_extension) + one-shot
backfill from property_details.listing_events for pre-trigger history.
Tax reassessment forecast NY · Partial reset (capped growth)
- Current annual tax
- $342 · $28/mo
- Projected year-2 tax
- $1,564 · $130/mo
- Expected delta
- +$1,222/yr (+$102/mo · 357.6%)
ⓘ Screening estimate from a state-policy table — verify with the county assessor before closing.
Climate risk First Street
- Flood 1/10 Low FEMA zone X (unshaded) · 0% chance over 30 yrs
- Wildfire 1/10 Low
- Heat 3/10 Moderate 7 d/yr ≥93°F today · 15 d/yr by 30 yrs out
- Wind 1/10 Low
- Air quality 3/10 Moderate 3 unhealthy d/yr today · 4 by 30 yrs out
Nearby sold comps map
Loading sold comps map…
Walkable amenities ~0.75 mi
Loading nearby amenities…
Taxation est. · year 1
- Rental income
- $17,480
- − Mortgage interest
- −$9,237
- − Property taxes
- −$342
- − Insurance
- −$824
- − Repairs & maintenance
- −$1,398
- − Management
- −$1,398
- − Depreciation
- −$4,797
- Taxable loss
- −$517
- Est. tax savings @ 24.0%
- +$124
- After-tax cash flow
- $2,390/yr
For passive investors: Depreciation is non-cash, so a rental often shows a tax loss while cash-flowing — sheltering income. Rental losses are passive: they offset passive income freely, and up to $25,000/yr can offset ordinary (W-2) income if you actively participate and your MAGI is under $100k (phasing out to $0 by $150k); unused losses carry forward. On sale, claimed depreciation is recaptured at up to 25%, and gains may owe capital-gains tax (a 1031 exchange can defer both). Figures are a year-1 estimate at your 24.0% rate — not tax advice; consult a CPA.
Schools (NCES district)
- District
- Buffalo City School District
- NCES district ID
- 3605850
- Math proficiency
- 41% ▲ 11.00%
- Reading proficiency
- 40% ▲ 7.00%
- Median HH income
- $31,665
- Composite
- 33.17/100
- National rank
- #5544
- State rank
- #535 of 590 in NY
Livability — Buffalo
- Score
- 77/100
- State rank
- #195
- US rank
- #3011
Category grades
Schools grade is shown separately in the Schools card above.
Census & demographics
- Census place
- Buffalo, NY
- County
- Erie County · 714,559 people
- City population
- 440,021
- Metro
- Buffalo-Cheektowaga, NY
- Population (ZIP)
- 26,327
- Household income
- $39,753
- Rent vs Own
- Severe rent burden
- 2177.0
Population outlook (Erie County) Hauer SSP2
- Today (2025)
- 933,037 people
- By 2030
- 935,181 · +0.2%
- By 2040
- 928,531 · -0.5%
- By 2050
- 905,725 · -2.9%
- By 2075
- 834,037 · -10.6%
- By 2100
- 708,033 · -24.1%
Race, ethnicity, and origin ACS 2023
- Neighborhood character
- Highly diverse neighborhood (Simpson 0.74)
- Race & ethnicity
- White 40% Hispanic / Latino 23% Black 16% Asian 15% Two or more races 14%
- Hispanic origin (detail)
- Puerto Rican 18% Dominican 2%
- Common ancestry
- Romanian 8% Portuguese 1% Arab 1%
- Foreign-born
- 19% · Philippines, Canada, India
- Languages at home
- 65% English-only · Spanish 14% Other Asian/Pacific 10% Other Indo-European 5%
Political lean MEDSL · Erie
- 2024 margin
- Lean D (+9.7) · D 54.8% · R 45.2%
- 2008→2024 swing
- -7.9pp toward R · 2008: 17.5pp · 2024: 9.7pp
- All cycles
- 2024: D+9.7 2020: D+14.7 2016: D+4.8 2012: D+15.6 2008: D+17.5
Not yet ingested
- Civics
- —
Market trends
- HPI YoY
- ▼ -54.42%
- Current HPI
- 233.0902
- Rent YoY
- ▲ 8.19%
- Metro
- Buffalo-Cheektowaga, NY
- State GDP YoY
- ▲ 2.60%
- F500 in state
- 92
Industry mix (Fortune 500 HQ in NY)
| Industry | F500 HQs | Revenue |
|---|---|---|
| Financial Services | 10 | $950B |
|
||
| Consumer Goods | 9 | $162B |
|
||
| Insurance | 4 | $225B |
|
||
| Telecommunications | 2 | $144B |
|
||
| Pharmaceuticals | 2 | $112B |
|
||
| Media / Entertainment | 2 | $69B |
|
||
Price history
+649.5% since first listed2 events — show timeline
- 2026-04-13 Listed $164,900 WNYREIS
- 2012-05-29 Sold (Public Records) $22,000 Public Records
Property tax history
+4.3%/yrLatest (2025): $342 · +0.0% YoY. Source: county tax records.
Cash-flow waterfall
monthlySold comps — $/sqft
last 12 mo · ≤1 miLoading sold comps…