 Triplex
104 Norwich Ave · Norwich, CT
Flood risk 8/10 · Major
- FEMA flood zone
- X (unshaded)
- Chance of flooding over 30 yrs
- 0.99%
- Est. flood insurance / yr
- $473 – $860
Fire risk 3/10 · Minor
- Est. fire insurance / yr
- $829 – $1,539
Heat risk 5/10 · Moderate
- Hot days now (above 98°F)
- 7 days/yr
- Hot days in 30 yrs
- 16 days/yr
Wind risk 6/10 · Moderate
- Chance of severe wind over 30 yrs
- 63.0%
Air-quality risk 3/10 · Minor
- Unhealthy air days now
- 2 days/yr
- Unhealthy air days in 30 yrs
- 3 days/yr
Risk factors via First Street. Map © Google.
Why this score? — see what drove the B- grade
The composite is a weighted blend of 9 inputs, each scored 0–100. Each bar is that input's sub-score; the figure is the points it added to the 100-point composite (weight × sub-score).
- Cash flow +30.0/30.0
- 1% rule +10.0/10.0
- DSCR +10.0/10.0
- ARV discount +4.6/15.0
- Rent growth +4.2/5.0
- Livability +4.0/5.0
- Condition / age +2.5/5.0
- Schools +2.1/10.0
- Appreciation +0.0/10.0
$299,900
🖨 Deal sheet 📄 Offer letter ✓ Due diligence
Multi-family units
County records classify this as Multi-Family (2-4 Unit). Listing-text estimate: 3 units. confirmed
Listing remarks MLS
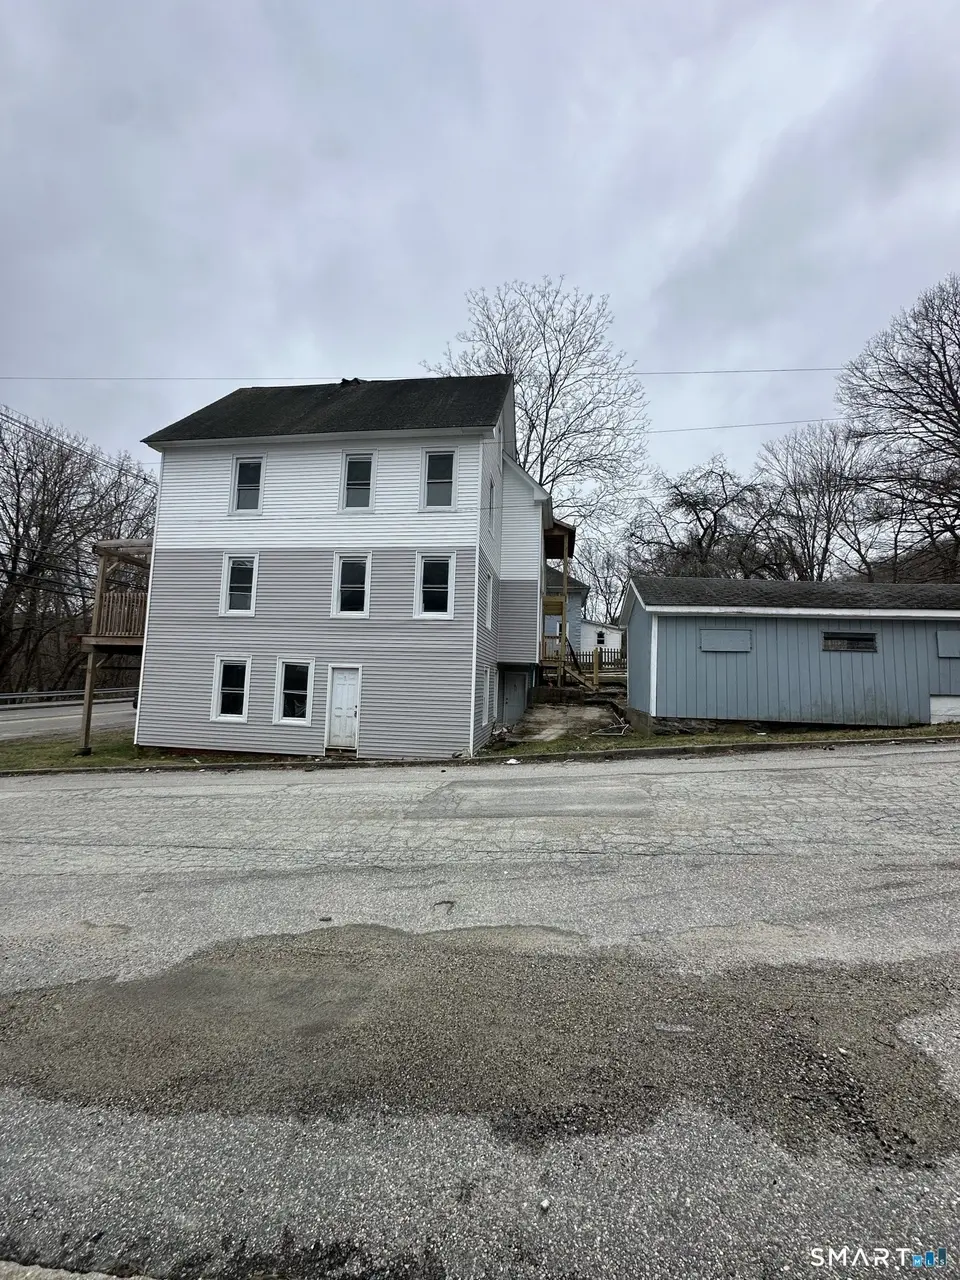
Attention investors and contractors! 104 Norwich is a 3 family and has a NEW ROOF and NEW SIDING. Besides those updated items, this is a full rehab project. Ideal for buyers looking for an investment, flip, or long-term rental. Corner lot, off-street parking, and shed. Conveniently located near local amenities, shopping, dining, hospitals, casinos, and major highways. Property is being sold as-is.
Key facts
- New siding
- Shed
- Off-street parking
Tags
Neighborhood map
What this means for you Summary
Snapshot
- This is a 3 × 2-bed/1.0-bath units multifamily listed at $300k.
Deal economics
- At list price, monthly cash flow is $2k ($26k/yr) — positive. Per door: $711/mo.
- The deal already cash-flows at list — no discount required.
- Meets the 1% rule at list price ($5k rent vs $300k).
- Recommended offer: $282k (6.0% below list) — sets the bar for market timing.
- Cap rate 15.1% vs local median 4.0% in Norwich — top-decile yield for the area; either an underpriced asset or a hidden risk that comps aren't pricing in. Stress-test before assuming the spread holds.
Location & tenants
- Location reads 81/100 on livability (#18 in CT, #1,391 nationally) — a professional / high-income tenant draw. Strengths: housing A+, health & safety A+, commute A-; Watch: schools D+.
- Norwich School District (urban): math 19% / reading 29% proficiency, ranked #139 of 153 in CT (top 91%) — low school quality limits family demand, transient renter base, plan for 1-2y turnover; 62% free/reduced lunch — lower-income household profile, screen leases tightly.
- Market conditions: Rents rising fast (+6.6%/yr); 241 active listings in the ZIP; 487 units permitted in Southeastern Connecticut Planning Region in 2024 (244 in 5+ unit buildings).
- At $5,243/mo this rent would consume 96% of the median local household income ($66k/yr) (locally 1643% of renters already pay >50% of income on rent) — very limited rent-growth headroom before tenants either downsize or default.
Forward outlook
- Local home prices are declining (-3.0%/yr); year-one equity from $2k of loan paydown is wiped out by about $9k of value loss. Plan a longer hold.
- At projected returns (-3.0% appreciation + 6.6% rent growth), your $84k cash investment doubles in ~4 years — after that, you're playing with house money.
Negotiation context
- It's been on market 73 days — a 6% lower offer ($282k) is reasonable based on typical stale-listing flexibility.
- 7 sale attempts since 21y ago with the ask held roughly flat each time — persistent listings suggest the price (not the market) is what's stuck; bring a comps-based counter.
- Current owner paid $140k; list at $300k implies a 114% gain — meaningful room to come down on a strong offer.
Risks & watch-outs
- Watch-outs: flood insurance adds $56/mo; built in 1890 — expect roof / HVAC / electrical / plumbing capex.
- Climate carrying-cost: severe flood risk; major wind risk, 63% chance of damaging wind over 30y; extreme-heat days projected 7→16/yr by 2055 (HVAC capex compounding) — expect insurance premiums to compound above CPI over the hold.
Questions for the listing agent
- It's been on market 73 days. Have you received any prior offers? Is the seller open to a 6% concession, seller financing, or rate buy-down credit?
- Can we see the unit-by-unit rent roll, current vacancy, and any below-market leases? What's the average tenancy length?
- What capital expenditures (roof, boiler, parking lot, exteriors) have been made in the last 5 years, and what's planned in the next 2?
- Built in 1890 — when were the roof, HVAC, electrical panel, plumbing, and water heater last replaced?
- What's the actual annual flood-insurance premium (NFIP or private), and is the property in a SFHA with mandatory coverage?
- Why hasn't it sold? Are there any deal-killer items the seller is aware of (foundation, flood, title, zoning, code violations)?
- Is there a deadline driving the sale (1031 exchange, divorce, estate, relocation)? That informs how much negotiation room exists.
- Schools are D-rated, which usually means shorter tenancies and higher turnover. Who's the typical renter profile here, and what's been the actual vacancy rate?
- What's the average days-on-market for RENTAL listings here right now (not sales)? A rising rental-DOM trend means longer vacancies and softer asking-rent achievability than the comps imply.
- What's the recent tenant-quality profile in this submarket — average credit score on applications, eviction rate, late-payment / NSF rate, and stable-employment percentage? A property-management company in the area should have these aggregated.
- How much new apartment / multifamily construction is in the pipeline within 1–3 miles? Heavy new supply (>2% of stock underway) typically softens rents 12–24 months out; light construction supports rent growth.
Investment metrics
- 1% rule
- 1.75% ✓
- Cap rate
- 15.05%
- Cash-on-cash
- 31.28%
- DSCR
- 2.39
- GRM
- 4.8
CMA / ARV
- ARV (median comp)
- $281,881
- List price
- $299,900
- Delta
- 6.39%
- Verdict
- FAIR
- Comps
- 20 within 1.0 mi
Show comp detail 1 sale within ~0.75 mi
| Address | Dist | Beds/Ba | Sqft | Sold | Price | $/sf | Match |
|---|---|---|---|---|---|---|---|
| 207 Norwich Ave | 0.26mi | 6/2.0 | 2,116 (+3%) | 6mo | $285,000 | $135 | 74 |
Match score weights: distance 35% · size 25% · config 20% · recency 20%. Top-matched comps best support the ARV.
Projected returns pro-forma
-3.0% appreciation · 6.62% rent growth · sell at horizon
- IRR
- 29.2%
- Equity multiple
- 2.28×
- Total profit
- $107,091
- Equity at exit
- $44,716
- IRR
- 38.5%
- Equity multiple
- 5.24×
- Total profit
- $355,850
- Equity at exit
- $25,930
Cash invested: $83,972 (down + closing). Projections, not guarantees.
Landlord ↔ Tenant lean methodology
- Overall (STATE)
- 27 Tenant-Leaning
- State Connecticut
- 27 Tenant-Leaning · D+7
- County
- — inherits STATE
- City
- — inherits STATE
ZIP-level market 06360
- Home prices YoY
- -19.9%
- Rents YoY
- 6.6%
- Active inventory
- 241
- Price-to-rent
- 14.3×
Monthly cashflow live
- Estimated rent
- $5,243 medium interval (Pro) →
- Mortgage (P&I)
- −$1,573
- Tax from tax record
- −$256 /mo · $3,068/yr
- Insurance
- −$125
- Flood insurance flood zone
- −$56 /mo · $666/yr
- HOA
- −$0
- Vacancy / Maint / Mgmt
- −$1,101
- Net cashflow
- $2,133
Break-even live
3-unit breakdown (identical units grouped — click to expand)
| Units | Beds | Baths | Est. rent |
|---|---|---|---|
| 3× units | 2 | 1 | $5,244 |
| #1 | 2 | 1 | $1,748 |
| #2 | 2 | 1 | $1,748 |
| #3 | 2 | 1 | $1,748 |
| Total (3 units) | $5,243 | ||
UW: 25.0% down · 7.5% · 30yr · 1.5% tax · 5.0% vac · 8.0% maint · 8.0% mgmt
Financing live
Cash to close
- Down payment
- $74,975
- Closing costs
- $8,997
- Reserves months
- —
- Total cash needed
- —
Loan-product check · same deal, 3 products live
Conventional
25% down · 7.5% · 30yr
- Down + closing
- —
- Monthly P&I
- —
- Monthly cashflow
- —
- DSCR
- —
- Eligible?
- —
Personal DTI + credit; lowest rate.
DSCR
20% down · 8.5% · 30yr
- Down + closing
- —
- Monthly P&I
- —
- Monthly cashflow
- —
- DSCR
- —
- Eligible?
- —
No personal income docs; deal must DSCR.
Hard money
10% down · 12.0% · 12mo
- Down + closing
- —
- Monthly P&I
- —
- Monthly cashflow
- —
- DSCR
- —
- Eligible?
- —
Short-term bridge; refi at stabilization.
Listing history 33 events
-
2026-06-19days on market $299,900 Active 73 DOM
-
2026-06-18days on market $299,900 Active 72 DOM
-
2026-06-17days on market $299,900 Active 71 DOM
-
2026-06-16days on market $299,900 Active 70 DOM
-
2026-06-15days on market $299,900 Active 69 DOM
-
2026-06-14days on market $299,900 Active 67 DOM
-
2026-06-13days on market $299,900 Active 66 DOM
-
2026-06-10days on market $299,900 Active 64 DOM
-
2026-06-09days on market $299,900 Active 63 DOM
-
2026-06-08days on market $299,900 Active 62 DOM
-
2026-06-07days on market $299,900 Active 61 DOM
-
2026-06-02days on market $299,900 Active 56 DOM
-
2026-06-01days on market $299,900 Active 55 DOM
-
2026-05-31days on market $299,900 Active 54 DOM
-
2026-05-30days on market $299,900 Active 53 DOM
-
2026-04-07$299,900 Active 400-char remark
Show marketing remark (400 chars)
Attention investors and contractors! 104 Norwich is a 3 family and has a NEW ROOF and NEW SIDING. Besides those updated items, this is a full rehab project. Ideal for buyers looking for an investment, flip, or long-term rental. Corner lot, off-street parking, and shed. Conveniently located near local amenities, shopping, dining, hospitals, casinos, and major highways. Property is being sold as-is.
-
2024-12-03historical
-
2024-09-11$245,000 Active
-
2024-08-29historical
-
2024-06-20$249,900 Active
-
2023-11-30soldstatus $140,000 Closed
-
2023-10-31status Under Contract
-
2023-10-25historical Under Contract - Continue to Show
-
2023-10-17price $155,000
-
2023-10-17status Active
-
2023-09-13status Under Contract
-
2023-08-16historical Under Contract - Continue to Show
-
2023-07-24$153,900 Active
-
2022-02-16soldstatus $80,000 Closed
-
2021-12-13$109,900 Active
-
2006-03-06soldstatus $22,900
-
2005-09-30$22,900
-
1988-05-26soldstatus $140,000
ⓘ Source: listings_history table (triggers on properties + properties_extension) + one-shot
backfill from property_details.listing_events for pre-trigger history.
Tax reassessment forecast CT · Partial reset (capped growth)
- Current annual tax
- $3,068 · $256/mo
- Projected year-2 tax
- $4,743 · $395/mo
- Expected delta
- +$1,675/yr (+$140/mo · 54.6%)
ⓘ Screening estimate from a state-policy table — verify with the county assessor before closing.
Climate risk First Street
- Flood 8/10 Severe FEMA zone X (unshaded) · 99% chance over 30 yrs
- Wildfire 3/10 Moderate
- Heat 5/10 Major 7 d/yr ≥98°F today · 16 d/yr by 30 yrs out
- Wind 6/10 Major 63% chance of damaging wind over 30 yrs
- Air quality 3/10 Moderate 2 unhealthy d/yr today · 3 by 30 yrs out
Nearby sold comps map
Loading sold comps map…
Walkable amenities ~0.75 mi
Loading nearby amenities…
Taxation est. · year 1
- Rental income
- $62,916
- − Mortgage interest
- −$16,799
- − Property taxes
- −$3,068
- − Insurance
- −$2,166
- − Repairs & maintenance
- −$5,033
- − Management
- −$5,033
- − Depreciation
- −$8,724
- Taxable income
- $22,092
- Est. tax owed @ 24.0%
- −$5,302
- After-tax cash flow
- $20,295/yr
For passive investors: Depreciation is non-cash, so a rental often shows a tax loss while cash-flowing — sheltering income. Rental losses are passive: they offset passive income freely, and up to $25,000/yr can offset ordinary (W-2) income if you actively participate and your MAGI is under $100k (phasing out to $0 by $150k); unused losses carry forward. On sale, claimed depreciation is recaptured at up to 25%, and gains may owe capital-gains tax (a 1031 exchange can defer both). Figures are a year-1 estimate at your 24.0% rate — not tax advice; consult a CPA.
Schools (NCES district)
- District
- Norwich School District
- NCES district ID
- 0903120
- Math proficiency
- 19% ▼ -8.00%
- Reading proficiency
- 29% ▼ -7.00%
- Median HH income
- $50,813
- Composite
- 21.27/100
- National rank
- #8395
- State rank
- #139 of 153 in CT
Livability — Norwich
- Score
- 81/100
- State rank
- #18
- US rank
- #1391
Category grades
Schools grade is shown separately in the Schools card above.
Census & demographics
- Census place
- Norwich, CT
- County
- New London County · 147,197 people
- City population
- 37,216
- Metro
- Norwich-New London, CT
- Population (ZIP)
- 37,216
- Household income
- $65,539
- Rent vs Own
- Severe rent burden
- 1643.0
Population outlook (Southeastern Connecticut County) Hauer SSP2
- By 2040
- 293,442
Race, ethnicity, and origin ACS 2023
- Neighborhood character
- Diverse neighborhood (Simpson 0.63)
- Race & ethnicity
- White 56% Hispanic / Latino 21% Two or more races 12% Black 10% Asian 7%
- Hispanic origin (detail)
- Mexican 3% Puerto Rican 9% Cuban 1% Dominican 3%
- Common ancestry
- Lithuanian 8% Romanian 5% Hispanic 4%
- Foreign-born
- 15% · Canada, China
- Languages at home
- 77% English-only · Spanish 11% French/Haitian/Cajun 4% Chinese 3%
Political lean MEDSL · Southeastern Connecticut
- 2024 margin
- D (+13.0) · D 55.6% · R 42.6% · Other 1.8%
- All cycles
- 2024: D+13.0
Not yet ingested
- Civics
- —
Market trends
- HPI YoY
- ▼ -65.27%
- Current HPI
- 261.8575
- Rent YoY
- ▲ 6.62%
- Metro
- Norwich-New London, CT
- State GDP YoY
- ▲ 1.06%
- F500 in state
- 38
Industry mix (Fortune 500 HQ in CT)
| Industry | F500 HQs | Revenue |
|---|---|---|
| Industrial Machinery | 4 | $38B |
|
||
| Insurance | 3 | $71B |
|
||
| Financial Services | 2 | $25B |
|
||
| Transportation / Logistics | 2 | $18B |
|
||
| Healthcare | 1 | $247B |
|
||
| Telecommunications | 1 | $55B |
|
||
Price history
+114.2% since first listed18 events — show timeline
- 2026-04-07 Listed $299,900 Smart MLS
- 2024-12-03 Listing Removed — Smart MLS
- 2024-09-11 Listed $245,000 Smart MLS
- 2024-08-29 Listing Removed — Smart MLS
- 2024-06-20 Listed $249,900 Smart MLS
- 2023-11-30 Sold (MLS) $140,000 Smart MLS
- 2023-10-31 Pending — Smart MLS
- 2023-10-25 Contingent — Smart MLS
- 2023-10-17 Price Changed $155,000 Smart MLS
- 2023-10-17 Relisted — Smart MLS
- 2023-09-13 Pending — Smart MLS
- 2023-08-16 Contingent — Smart MLS
- 2023-07-24 Listed $153,900 Smart MLS
- 2022-02-16 Sold (MLS) $80,000 Smart MLS
- 2021-12-13 Listed $109,900 Smart MLS
- 2006-03-06 Sold (MLS) $22,900 Smart MLS
- 2005-09-30 Listed $22,900 Smart MLS
- 1988-05-26 Sold (Public Records) $140,000 Public Records
Property tax history
+1.1%/yrLatest (2023): $3,068 · -0.8% YoY. Source: county tax records.
Cash-flow waterfall
monthlySold comps — $/sqft
last 12 mo · ≤1 miLoading sold comps…