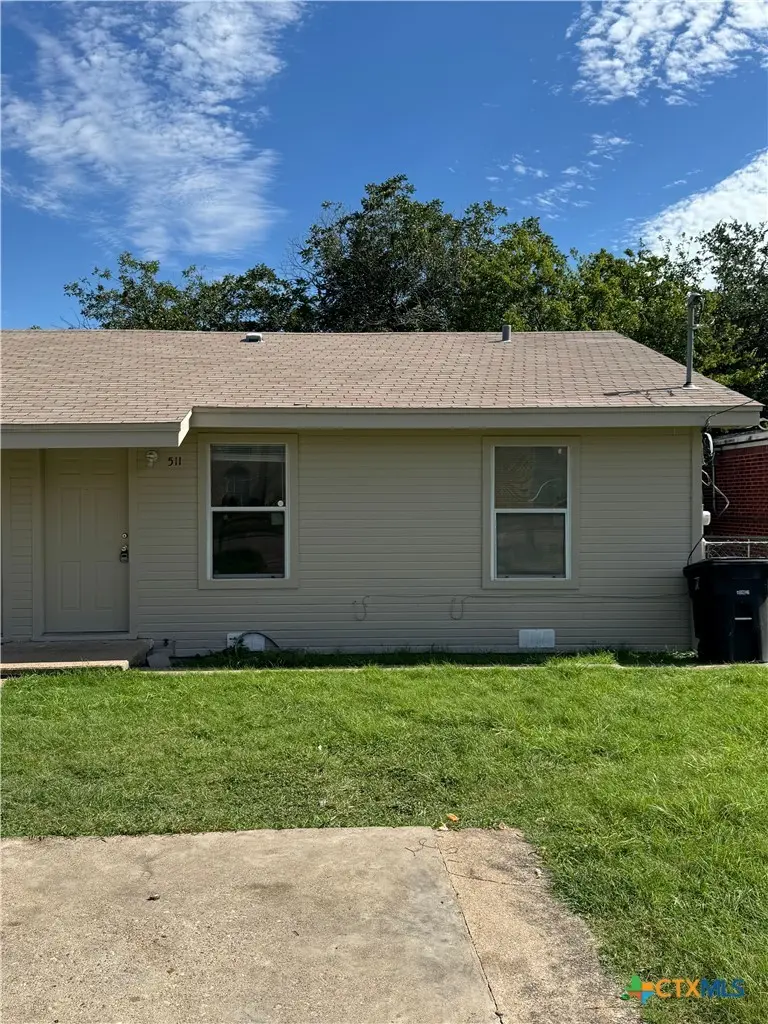
511 W Hallmark Ave · Killeen, TX
Flood risk 1/10 · Minimal
- FEMA flood zone
- X (unshaded)
- Chance of flooding over 30 yrs
- 0.0%
- Est. flood insurance / yr
- $507 – $1,088
Fire risk 4/10 · Minor
- Est. fire insurance / yr
- $1,222 – $2,270
Heat risk 8/10 · Major
- Hot days now (above 107°F)
- 7 days/yr
- Hot days in 30 yrs
- 24 days/yr
Wind risk 6/10 · Moderate
- Chance of severe wind over 30 yrs
- 60.0%
Air-quality risk 1/10 · Minimal
- Unhealthy air days now
- 0 days/yr
- Unhealthy air days in 30 yrs
- 0 days/yr
Risk factors via First Street. Map © Google.
Why this score? — see what drove the C- grade
The composite is a weighted blend of 9 inputs, each scored 0–100. Each bar is that input's sub-score; the figure is the points it added to the 100-point composite (weight × sub-score).
- Cash flow +17.6/30.0
- ARV discount +7.5/15.0
- Appreciation +6.1/10.0
- DSCR +5.5/10.0
- 1% rule +5.0/10.0
- Livability +3.2/5.0
- Schools +3.0/10.0
- Condition / age +2.5/5.0
- Rent growth +2.0/5.0
$129,000
🖨 Deal sheet 📄 Offer letter ✓ Due diligence
Listing remarks MLS
Great investment opportunity in Killeen! This well-maintained duplex at 511 W. Hallmark Ave features two separate units, each offering 2 bedrooms and 1 full bath. Both sides provide comfortable living spaces with functional layouts, perfect for tenants or owner-occupants. The property also includes a fenced-in backyard, ideal for pets, privacy, and outdoor enjoyment. Conveniently located near shopping, dining, schools, and Fort Cavazos, this duplex offers strong rental potential and long-term value.
Key facts
- Fenced in backyard
- Built 1967
- Listed 156 days
Tags
Neighborhood map
What this means for you Summary
Snapshot
- This is a 4-bed/4.0-bath townhouse listed at $129k.
Deal economics
- At list price, monthly cash flow is $101 ($1k/yr) — positive.
- The deal already cash-flows at list — no discount required.
- Meets the 1% rule at list price ($1k rent vs $129k).
- Recommended offer: $114k (12.0% below list) — sets the bar for market timing.
- Cap rate 7.2% vs local median 3.9% in Killeen — top-decile yield for the area; either an underpriced asset or a hidden risk that comps aren't pricing in. Stress-test before assuming the spread holds.
Location & tenants
- Location reads 63/100 on livability (#853 in TX) — a middle-class / working-renter tenant base. Strengths: cost of living A+, housing A+; Watch: schools D+, amenities D, employment D.
- Killeen ISD (urban): math 31% / reading 38% proficiency, ranked #524 of 826 in TX (top 63%) — families likely to look elsewhere, expect single-tenant / working-renter base with shorter leases.
- Market conditions: Rents soft (-2.0%/yr); 123 active listings in the ZIP; 40 comparable units currently listed for rent nearby; rentals lingering (median 44d on market — plan ~5-8 weeks vacancy on turnover, expect pricing pressure); 62% of comp listings sitting > 30 days — soft ceiling on asking rent; lower-income renter base — watch delinquency; 3,222 units permitted in Bell County in 2024 (246 in 5+ unit buildings).
- This rent runs 42% of the median local income ($37k/yr) — at the standard rent-burdened threshold; future hikes will face affordability resistance.
Forward outlook
- In year one you build about $4k of equity ($892 loan paydown + $3k appreciation (2.3% local appreciation)).
- Bell County population projected at +21% by 2050 — long-run rental-demand tailwind backs the buy-and-hold thesis.
- At projected returns (2.3% appreciation + 0.0% rent growth), your $36k cash investment doubles in ~7 years — after that, you're playing with house money.
- By year 9, paydown + projected appreciation supports a ~$33k cash-out refi (75% LTV) — recoverable capital for the next deal without selling this one.
Negotiation context
- It's been on market 156 days — a 12% lower offer ($114k) is reasonable based on typical stale-listing flexibility.
- 7 sale attempts since 18y ago; this cycle's ask has dropped $30k (19%) from the opening price — seller is motivated, your offer sets the floor, not the list.
- Current owner paid $51k; list at $129k implies a 153% gain — meaningful room to come down on a strong offer.
Risks & watch-outs
- Climate carrying-cost: major wind risk, 60% chance of damaging wind over 30y; extreme-heat days projected 7→24/yr by 2055 (HVAC capex compounding) — expect insurance premiums to compound above CPI over the hold.
Questions for the listing agent
- It's been on market 156 days. Have you received any prior offers? Is the seller open to a 12% concession, seller financing, or rate buy-down credit?
- Built in 1967 — when were the roof, HVAC, electrical panel, plumbing, and water heater last replaced?
- Why hasn't it sold? Are there any deal-killer items the seller is aware of (foundation, flood, title, zoning, code violations)?
- Is there a deadline driving the sale (1031 exchange, divorce, estate, relocation)? That informs how much negotiation room exists.
- Schools are D-rated, which usually means shorter tenancies and higher turnover. Who's the typical renter profile here, and what's been the actual vacancy rate?
- Crime grade is D in this area — have there been break-ins, vandalism, or insurance claims at this property in the last 3 years? What carrier currently insures it and at what premium?
- What's the average days-on-market for RENTAL listings here right now (not sales)? A rising rental-DOM trend means longer vacancies and softer asking-rent achievability than the comps imply.
- What's the recent tenant-quality profile in this submarket — average credit score on applications, eviction rate, late-payment / NSF rate, and stable-employment percentage? A property-management company in the area should have these aggregated.
- How much new for-sale + rental construction is in the pipeline within 1–3 miles? Heavy new supply typically softens prices + rents 12–24 months out; constrained supply supports both.
Investment metrics
- 1% rule
- 1.00% ✓
- Cap rate
- 7.23%
- Cash-on-cash
- 3.36%
- DSCR
- 1.15
- GRM
- 8.3
CMA / ARV
No comps found within radius.
Projected returns pro-forma
2.26% appreciation · 0.0% rent growth · sell at horizon
- IRR
- 6.8%
- Equity multiple
- 1.37×
- Total profit
- $13,256
- Equity at exit
- $52,715
- IRR
- 8.4%
- Equity multiple
- 2.11×
- Total profit
- $40,166
- Equity at exit
- $77,345
Cash invested: $36,120 (down + closing). Projections, not guarantees.
Landlord ↔ Tenant lean methodology
- Overall (STATE)
- 87 Strongly Landlord-Friendly
- State Texas
- 87 Strongly Landlord-Friendly · R+5
- County
- — inherits STATE
- City
- — inherits STATE
ZIP-level market 76541
- Home prices YoY
- 1.4%
- Rents YoY
- -2.0%
- Active inventory
- 123
- Price-to-rent
- 8.3×
Monthly cashflow live
- Estimated rent
- $1,292 high interval (Pro) →
- Mortgage (P&I)
- −$676
- Tax from tax record
- −$189 /mo · $2,270/yr
- Insurance
- −$54
- HOA
- −$0
- Vacancy / Maint / Mgmt
- −$271
- Net cashflow
- $101
Break-even live
UW: 25.0% down · 7.5% · 30yr · 1.5% tax · 5.0% vac · 8.0% maint · 8.0% mgmt
Financing live
Cash to close
- Down payment
- $32,250
- Closing costs
- $3,870
- Reserves months
- —
- Total cash needed
- —
Loan-product check · same deal, 3 products live
Conventional
25% down · 7.5% · 30yr
- Down + closing
- —
- Monthly P&I
- —
- Monthly cashflow
- —
- DSCR
- —
- Eligible?
- —
Personal DTI + credit; lowest rate.
DSCR
20% down · 8.5% · 30yr
- Down + closing
- —
- Monthly P&I
- —
- Monthly cashflow
- —
- DSCR
- —
- Eligible?
- —
No personal income docs; deal must DSCR.
Hard money
10% down · 12.0% · 12mo
- Down + closing
- —
- Monthly P&I
- —
- Monthly cashflow
- —
- DSCR
- —
- Eligible?
- —
Short-term bridge; refi at stabilization.
Rent comps 40 comps
| Address | Beds | Baths | Sqft | Rent | $/sqft | DOM | Units | Dist |
|---|---|---|---|---|---|---|---|---|
| 605 Stringer St Unit A Killeen, TX | 3.0 | 2.5 | 1334 | $1,500 | $1.12 | 43d | 1 | 0.03mi |
| 512 Raymond St Killeen, TX | 3.0 | 2.5 | 1336 | $1,300 | $0.97 | 43d | 1 | 0.06mi |
| 512 Raymond St Unit B Killeen, TX | 3.0 | 2.5 | 1336 | $1,300 | $0.97 | 23d | 1 | 0.06mi |
| 909 Houston St Killeen, TX | 3.0 | 2.0 | 1200 | $1,195 | $1.00 | 43d | 1 | 0.27mi |
| 409 Short Ave Killeen, TX | 4.0 | 2.0 | 1220 | $1,300 | $1.07 | 43d | 1 | 0.27mi |
| 907 San Antonio St Killeen, TX | 3.0 | 1.5 | 1303 | $1,195 | $0.92 | 43d | 1 | 0.29mi |
| 1003 San Antonio St Killeen, TX | 4.0 | 1.0 | 1452 | $1,095 | $0.75 | 43d | 1 | 0.31mi |
| 910 San Antonio St Killeen, TX | 3.0 | 1.0 | 1208 | $995 | $0.82 | 43d | 1 | 0.32mi |
| 919 Southside Dr Killeen, TX | 3.0 | 1.0 | 925 | $1,300 | $1.41 | 43d | 1 | 0.37mi |
| 1004 Mary Jane Cir Killeen, TX | 3.0 | 2.0 | 1628 | $1,550 | $0.95 | 23d | 1 | 0.39mi |
| 717 Norris Ave Killeen, TX | 3.0 | 1.0 | 1118 | $1,000 | $0.89 | 43d | 1 | 0.50mi |
| 205 W Vardeman Ave Unit A Killeen, TX | 3.0 | 1.0 | 1824 | $925 | $0.51 | 43d | 1 | 0.53mi |
| 1313 Elia St Killeen, TX | 3.0 | 1.5 | 1104 | $1,050 | $0.95 | 43d | 1 | 0.56mi |
| 118 E Fowler Ave Killeen, TX | 3.0 | 1.0 | 902 | $875 | $0.97 | 43d | 1 | 0.64mi |
| 208 E Voelter Ave Killeen, TX | 3.0 | 2.0 | 1215 | $995 | $0.82 | 23d | 1 | 0.67mi |
| 514 McArthur Dr Killeen, TX | 3.0 | 1.0 | 1084 | $995 | $0.92 | 43d | 1 | 0.71mi |
| 209 West Avenue A Unit A Killeen, TX | 3.0 | 2.0 | 876 | $935 | $1.07 | 13d | 1 | 0.78mi |
| 505 W Church Ave Killeen, TX | 3.0 | 1.0 | 1160 | $1,100 | $0.95 | 13d | 1 | 0.80mi |
| 1417 Jasper Garden Ct Killeen, TX | 3.0 | 2.0 | 1477 | $1,675 | $1.13 | 43d | 1 | 0.92mi |
| 907 Wells St Killeen, TX | 3.0 | 1.0 | 1050 | $950 | $0.90 | 23d | 1 | 0.95mi |
| 1105 Alta Vista Dr Killeen, TX | 3.0 | 1.5 | 1168 | $1,500 | $1.28 | 23d | 1 | 0.98mi |
| 905 N Gilmer St Killeen, TX | 1.0–3.0 | 1.0–2.0 | 925 | $1,395 | $1.51 | 13d | 5 | 0.98mi |
| 724 Carrie Ave Killeen, TX | 3.0 | 1.0 | 1100 | $1,000 | $0.91 | 43d | 1 | 1.02mi |
| 913 Estelle Ave Killeen, TX | 4.0 | 2.0 | 1292 | $1,445 | $1.12 | 13d | 1 | 1.02mi |
| 1111 N College St Unit B Killeen, TX | 3.0 | 2.0 | 1235 | $995 | $0.81 | 13d | 1 | 1.05mi |
| 1208 Ridgemont Dr Killeen, TX | 3.0 | 1.0 | 1224 | $1,150 | $0.94 | 23d | 1 | 1.08mi |
| 1214 Valentine St Killeen, TX | 3.0 | 1.0 | 1090 | $1,025 | $0.94 | 23d | 1 | 1.08mi |
| 501 N 18th St Unit B Killeen, TX | 3.0 | 1.5 | 1286 | $1,250 | $0.97 | 23d | 1 | 1.09mi |
| 506 Powell St Killeen, TX | 3.0 | 1.0 | 1546 | $1,400 | $0.91 | 43d | 1 | 1.09mi |
| 1204 Alta Vista Dr Killeen, TX | 4.0 | 2.0 | 1624 | $1,450 | $0.89 | 43d | 1 | 1.10mi |
| 1302 Redondo Dr Killeen, TX | 3.0 | 1.0 | 1327 | $1,200 | $0.90 | 43d | 1 | 1.11mi |
| 1108 Ridgeway Dr Killeen, TX | 3.0 | 2.0 | 1295 | $1,345 | $1.04 | 23d | 1 | 1.13mi |
| 1209 West Ln Killeen, TX | 3.0 | 2.0 | 1100 | $1,300 | $1.18 | 43d | 1 | 1.15mi |
| 905 Parmer Ave Unit A Killeen, TX | 3.0 | 1.0 | 1672 | $750 | $0.45 | 43d | 1 | 1.16mi |
| 1201 Greenwood Ave Killeen, TX | 4.0 | 2.0 | 1276 | $1,350 | $1.06 | 43d | 1 | 1.19mi |
| 2301 Zinnia Ct Killeen, TX | 4.0 | 2.0 | 1746 | $1,650 | $0.95 | 43d | 1 | 1.20mi |
| 1005 Bonner Dr Killeen, TX | 3.0 | 2.0 | 1347 | $1,300 | $0.97 | 43d | 1 | 1.23mi |
| 1306 Duvall Dr Killeen, TX | 3.0 | 1.0 | 1000 | $1,025 | $1.02 | 43d | 1 | 1.23mi |
| 1015 N 10th St Unit B Killeen, TX | 3.0 | 2.0 | 1118 | $1,100 | $0.98 | 43d | 1 | 1.25mi |
| 1309 Greenwood Ave Killeen, TX | 3.0 | 1.0 | 925 | $900 | $0.97 | 21d | 1 | 1.25mi |
Listing history 36 events
-
2026-06-18days on market $129,000 Active 156 DOM
-
2026-06-17days on market $129,000 Active 155 DOM
-
2026-06-16days on market $129,000 Active 154 DOM
-
2026-06-15days on market $129,000 Active 153 DOM
-
2026-06-14days on market $129,000 Active 151 DOM
-
2026-06-13days on market $129,000 Active 150 DOM
-
2026-06-10days on market $129,000 Active 148 DOM
-
2026-06-09days on market $129,000 Active 147 DOM
-
2026-06-08pricedays on market $129,000 Active 146 DOM
-
2026-06-07days on market $149,000 Active 145 DOM
-
2026-06-03days on market $149,000 Active 141 DOM
-
2026-06-02days on market $149,000 Active 140 DOM
-
2026-06-01days on market $149,000 Active 139 DOM
-
2026-05-31days on market $149,000 Active 138 DOM
-
2026-05-30days on market $149,000 Active 137 DOM
-
2026-05-14status Active 504-char remark
Show marketing remark (504 chars)
Great investment opportunity in Killeen! This well-maintained duplex at 511 W. Hallmark Ave features two separate units, each offering 2 bedrooms and 1 full bath. Both sides provide comfortable living spaces with functional layouts, perfect for tenants or owner-occupants. The property also includes a fenced-in backyard, ideal for pets, privacy, and outdoor enjoyment. Conveniently located near shopping, dining, schools, and Fort Cavazos, this duplex offers strong rental potential and long-term value.
-
2026-04-22historical Active Under Contract 504-char remark
Show marketing remark (504 chars)
Great investment opportunity in Killeen! This well-maintained duplex at 511 W. Hallmark Ave features two separate units, each offering 2 bedrooms and 1 full bath. Both sides provide comfortable living spaces with functional layouts, perfect for tenants or owner-occupants. The property also includes a fenced-in backyard, ideal for pets, privacy, and outdoor enjoyment. Conveniently located near shopping, dining, schools, and Fort Cavazos, this duplex offers strong rental potential and long-term value.
-
2026-02-11price $149,000 504-char remark
Show marketing remark (504 chars)
Great investment opportunity in Killeen! This well-maintained duplex at 511 W. Hallmark Ave features two separate units, each offering 2 bedrooms and 1 full bath. Both sides provide comfortable living spaces with functional layouts, perfect for tenants or owner-occupants. The property also includes a fenced-in backyard, ideal for pets, privacy, and outdoor enjoyment. Conveniently located near shopping, dining, schools, and Fort Cavazos, this duplex offers strong rental potential and long-term value.
-
2026-01-13$159,000 Active 504-char remark
Show marketing remark (504 chars)
Great investment opportunity in Killeen! This well-maintained duplex at 511 W. Hallmark Ave features two separate units, each offering 2 bedrooms and 1 full bath. Both sides provide comfortable living spaces with functional layouts, perfect for tenants or owner-occupants. The property also includes a fenced-in backyard, ideal for pets, privacy, and outdoor enjoyment. Conveniently located near shopping, dining, schools, and Fort Cavazos, this duplex offers strong rental potential and long-term value.
-
2025-10-24historical $750
-
2025-09-10price $750
-
2025-08-14price $800
-
2025-05-28price $850
-
2025-04-17$950
-
2023-05-08status Pending
-
2023-04-22$125,000 Active
-
2018-05-15historical
-
2018-05-14status Active
-
2018-05-03status Pending with Option
-
2018-04-25$55,000 Active
-
2015-07-23soldstatus
-
2009-07-07soldstatus
-
2009-06-30soldstatus $51,000
-
2008-09-30$50,000
-
2000-05-11soldstatus
-
1992-02-18soldstatus
ⓘ Source: listings_history table (triggers on properties + properties_extension) + one-shot
backfill from property_details.listing_events for pre-trigger history.
Tax reassessment forecast TX · Resets to sale price
- Current annual tax
- $2,270 · $189/mo
- Projected year-2 tax
- $2,361 · $197/mo
- Expected delta
- +$90/yr (+$8/mo · 4.0%)
ⓘ Screening estimate from a state-policy table — verify with the county assessor before closing.
Climate risk First Street
- Flood 1/10 Low FEMA zone X (unshaded) · 0% chance over 30 yrs
- Wildfire 4/10 Moderate
- Heat 8/10 Severe 7 d/yr ≥107°F today · 24 d/yr by 30 yrs out
- Wind 6/10 Major 60% chance of damaging wind over 30 yrs
- Air quality 1/10 Low 0 unhealthy d/yr today · 0 by 30 yrs out
Nearby sold comps map
Loading sold comps map…
Walkable amenities ~0.75 mi
Loading nearby amenities…
Taxation est. · year 1
- Rental income
- $15,501
- − Mortgage interest
- −$7,226
- − Property taxes
- −$2,270
- − Insurance
- −$645
- − Repairs & maintenance
- −$1,240
- − Management
- −$1,240
- − Depreciation
- −$3,753
- Taxable loss
- −$873
- Est. tax savings @ 24.0%
- +$210
- After-tax cash flow
- $1,422/yr
For passive investors: Depreciation is non-cash, so a rental often shows a tax loss while cash-flowing — sheltering income. Rental losses are passive: they offset passive income freely, and up to $25,000/yr can offset ordinary (W-2) income if you actively participate and your MAGI is under $100k (phasing out to $0 by $150k); unused losses carry forward. On sale, claimed depreciation is recaptured at up to 25%, and gains may owe capital-gains tax (a 1031 exchange can defer both). Figures are a year-1 estimate at your 24.0% rate — not tax advice; consult a CPA.
Schools (NCES district)
- District
- Killeen ISD
- NCES district ID
- 4825660
- Math proficiency
- 31% ▼ -16.00%
- Reading proficiency
- 38% ▼ -3.00%
- Median HH income
- $47,665
- Composite
- 29.69/100
- National rank
- #6458
- State rank
- #524 of 826 in TX
Livability — Killeen
- Score
- 63/100
- State rank
- #853
- US rank
- #15359
Category grades
Schools grade is shown separately in the Schools card above.
Census & demographics
- Census place
- Killeen, TX
- County
- Bell County · 345,090 people
- City population
- 163,398
- Metro
- Killeen-Temple, TX
- Population (ZIP)
- 19,011
- Household income
- $37,349
- Rent vs Own
- Severe rent burden
- 1668.0
Population outlook (Bell County) Hauer SSP2
- Today (2025)
- 371,114 people
- By 2030
- 389,104 · +4.8%
- By 2040
- 420,592 · +13.3%
- By 2050
- 447,779 · +20.7%
- By 2075
- 499,130 · +34.5%
- By 2100
- 505,680 · +36.3%
Race, ethnicity, and origin ACS 2023
- Neighborhood character
- Highly diverse neighborhood (Simpson 0.73)
- Race & ethnicity
- Hispanic / Latino 32% White 31% Black 27% Two or more races 10% Asian 3% Pacific Islander 1%
- Hispanic origin (detail)
- Mexican 21% Puerto Rican 6% Dominican 1%
- Common ancestry
- Italian 2% Slovak 1% Lithuanian 1%
- Foreign-born
- 14% · Canada, Vietnam, South Korea
- Languages at home
- 69% English-only · Spanish 25% German/W. Germanic 2% Korean 1%
Political lean MEDSL · Bell
- 2024 margin
- R (+16.2) · D 41.3% · R 57.6% · Other 1.1%
- 2008→2024 swing
- -6.5pp toward R · 2008: -9.8pp · 2024: -16.2pp
- All cycles
- 2024: R+16.2 2020: R+8.5 2016: R+15.1 2012: R+16.4 2008: R+9.8
Not yet ingested
- Civics
- —
Market trends
- HPI YoY
- ▲ 2.26%
- Current HPI
- 168.1206
- Rent YoY
- ▼ -2.00%
- Metro
- Killeen-Temple, TX
- State GDP YoY
- ▲ 3.95%
- F500 in state
- 110
Industry mix (Fortune 500 HQ in TX)
| Industry | F500 HQs | Revenue |
|---|---|---|
| Energy | 16 | $1,198B |
|
||
| Technology | 5 | $198B |
|
||
| Engineering / Construction | 4 | $72B |
|
||
| Energy Services | 3 | $60B |
|
||
| Utilities | 3 | $41B |
|
||
| Healthcare | 2 | $330B |
|
||
Price history
+198.0% since first listed21 events — show timeline
- 2026-05-14 Relisted — CTXMLS
- 2026-04-22 Contingent — CTXMLS
- 2026-02-11 Price Changed $149,000 CTXMLS
- 2026-01-13 Listed $159,000 CTXMLS
- 2025-10-24 Rental Removed $750 APPFOLIO
- 2025-09-10 Price Changed $750 APPFOLIO
- 2025-08-14 Price Changed $800 APPFOLIO
- 2025-05-28 Price Changed $850 APPFOLIO
- 2025-04-17 Listed for Rent $950 APPFOLIO
- 2023-05-08 Pending — CTXMLS
- 2023-04-22 Listed $125,000 CTXMLS
- 2018-05-15 Listing Removed — CTXMLS
- 2018-05-14 Relisted — CTXMLS
- 2018-05-03 Pending — CTXMLS
- 2018-04-25 Listed $55,000 CTXMLS
- 2015-07-23 Sold (Public Records) — Public Records
- 2009-07-07 Sold (Public Records) — Public Records
- 2009-06-30 Sold (MLS) $51,000 CTXMLS
- 2008-09-30 Listed $50,000 CTXMLS
- 2000-05-11 Sold (Public Records) — Public Records
- 1992-02-18 Sold (Public Records) — Public Records
Property tax history
+20.6%/yrLatest (2025): $2,270 · +4.6% YoY. Source: county tax records.
Cash-flow waterfall
monthlySold comps — $/sqft
last 12 mo · ≤1 miLoading sold comps…