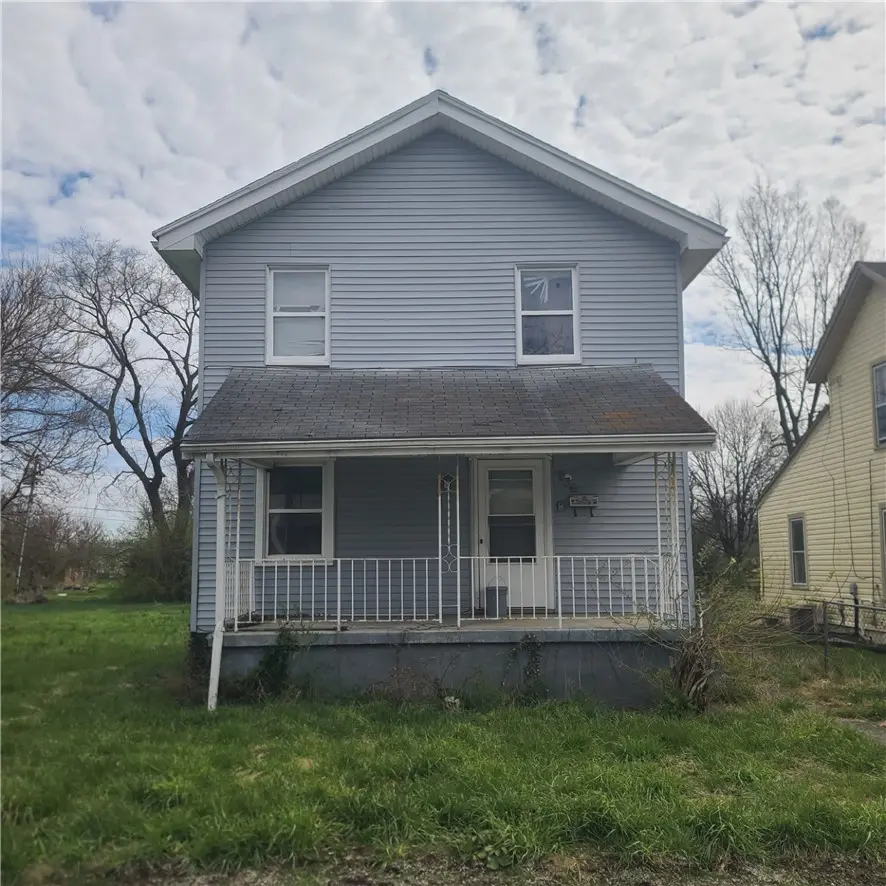
236 S Ardmore Ave · Dayton, OH
Flood risk 1/10 · Minimal
- FEMA flood zone
- X (unshaded)
- Chance of flooding over 30 yrs
- 0.0%
- Est. flood insurance / yr
- $473 – $860
Fire risk 1/10 · Minimal
- Est. fire insurance / yr
- $713 – $1,323
Heat risk 3/10 · Minor
- Hot days now (above 104°F)
- 7 days/yr
- Hot days in 30 yrs
- 18 days/yr
Wind risk 2/10 · Minimal
- Chance of severe wind over 30 yrs
- 0.0%
Air-quality risk 3/10 · Minor
- Unhealthy air days now
- 3 days/yr
- Unhealthy air days in 30 yrs
- 5 days/yr
Risk factors via First Street. Map © Google.
Why this score? — see what drove the B+ grade
The composite is a weighted blend of 9 inputs, each scored 0–100. Each bar is that input's sub-score; the figure is the points it added to the 100-point composite (weight × sub-score).
- Cash flow +30.0/30.0
- ARV discount +15.0/15.0
- 1% rule +10.0/10.0
- DSCR +10.0/10.0
- Rent growth +3.5/5.0
- Livability +3.2/5.0
- Condition / age +2.5/5.0
- Schools +1.3/10.0
- Appreciation +0.0/10.0
$54,900
🖨 Deal sheet (PDF) 📄 Offer letter ✓ Due diligence
Listing remarks MLS
There is plenty of potential with this itwo-story residence. The property offers three bedrooms and one full bathroom across 1192 square feet, hardwood flooring and this excellent investment awaits your personal touch, providing a blank canvas for personalization. The versatile living areas and kitchen present unique opportunities for renovation and customization. A classic staircase leads to the upper level, while a cozy fireplace promises warm ambiance. With cable TV hookups readily available, modern conveniences are seamlessly integrated. This residence offers an exceptional chance to create your dream home on South Ardmore Avenue.
Key facts
- 4,447 sq ft lot
- Built 1900
- Listed 63 days
Neighborhood map
What this means for you Summary
Snapshot
- This is a 3-bed/1.0-bath single-family listed at $55k.
Deal economics
- At list price, monthly cash flow is $523 ($6k/yr) — positive.
- The deal already cash-flows at list — no discount required.
- Meets the 1% rule at list price ($1k rent vs $55k).
- Recommended offer: $52k (6.0% below list) — sets the bar for market timing.
- Cap rate 17.7% vs local median 7.4% in Dayton — top-decile yield for the area; either an underpriced asset or a hidden risk that comps aren't pricing in. Stress-test before assuming the spread holds.
Location & tenants
- Location reads 65/100 on livability (#716 in OH) — a middle-class / working-renter tenant base. Strengths: cost of living A+, housing A+, health & safety A; Watch: schools C-, amenities C-, crime F.
- Dayton City (urban): math 12% / reading 21% proficiency, ranked #641 of 656 in OH (top 98%) — low school quality limits family demand, transient renter base, plan for 1-2y turnover; 74% free/reduced lunch — lower-income household profile, screen leases tightly.
- Market conditions: Rents rising fast (+4.1%/yr); 135 active listings in the ZIP; 31 comparable units currently listed for rent nearby; rentals at typical pace (median 15d on market — plan ~3-4 weeks tenant-placement turnaround); lower-income renter base — watch delinquency; 907 units permitted in Montgomery County in 2024 (416 in 5+ unit buildings).
- This rent runs 38% of the median local income ($37k/yr) — at the standard rent-burdened threshold; future hikes will face affordability resistance.
Forward outlook
- Local home prices are declining (-3.0%/yr); year-one equity from $380 of loan paydown is wiped out by about $2k of value loss. Plan a longer hold.
- Montgomery County population projected at -10% by 2050 — secular population decline; favor cash flow + early exit over multi-decade hold.
- At projected returns (-3.0% appreciation + 4.1% rent growth), your $15k cash investment doubles in ~3 years — after that, you're playing with house money.
Negotiation context
- It's been on market 63 days — a 6% lower offer ($52k) is reasonable based on typical stale-listing flexibility.
- 2 sale attempts since 12y ago; this cycle's ask has dropped $14k (20%) from the opening price — seller is motivated, your offer sets the floor, not the list.
- Current owner paid $10k; list at $55k implies a 449% gain — meaningful room to come down on a strong offer.
Risks & watch-outs
- Watch-outs: built in 1900 — expect roof / HVAC / electrical / plumbing capex.
Questions for the listing agent
- It's been on market 63 days. Have you received any prior offers? Is the seller open to a 6% concession, seller financing, or rate buy-down credit?
- Built in 1900 — when were the roof, HVAC, electrical panel, plumbing, and water heater last replaced?
- Why hasn't it sold? Are there any deal-killer items the seller is aware of (foundation, flood, title, zoning, code violations)?
- Is there a deadline driving the sale (1031 exchange, divorce, estate, relocation)? That informs how much negotiation room exists.
- Crime grade is F in this area — have there been break-ins, vandalism, or insurance claims at this property in the last 3 years? What carrier currently insures it and at what premium?
- What's the average days-on-market for RENTAL listings here right now (not sales)? A rising rental-DOM trend means longer vacancies and softer asking-rent achievability than the comps imply.
- What's the recent tenant-quality profile in this submarket — average credit score on applications, eviction rate, late-payment / NSF rate, and stable-employment percentage? A property-management company in the area should have these aggregated.
- How much new for-sale + rental construction is in the pipeline within 1–3 miles? Heavy new supply typically softens prices + rents 12–24 months out; constrained supply supports both.
Investment metrics
- 1% rule
- 2.11% ✓
- Cap rate
- 17.73%
- Cash-on-cash
- 40.83%
- DSCR
- 2.82
- GRM
- 3.9
CMA / ARV
- ARV (median comp)
- $76,637
- List price
- $54,900
- Delta
- -28.36%
- Verdict
- UNDERPRICED
- Comps
- 20 within 1.0 mi
Show comp detail 12 sales within ~0.75 mi
| Address | Dist | Beds/Ba | Sqft | Sold | Price | $/sf | Match |
|---|---|---|---|---|---|---|---|
| 236 S Ardmore Ave | 0.00mi | 3/1.0 | 1,192 (0%) | 0mo | $45,000 | $38 | 100 |
| 2230 Lakeview Ave | 0.34mi | 3/1.0 | 1,102 (-8%) | 5mo | $40,000 | $36 | 68 |
| 32 Anna St | 0.43mi | 3/1.0 | 1,140 (-4%) | 8mo | $10,000 | $9 | 66 |
| 32 S Plaza Ave | 0.55mi | 2/1.0 (-1) | 1,218 (+2%) | 3mo | $34,000 | $28 | 64 |
| 233 Westwood Ave | 0.66mi | 3/1.0 | 1,236 (+4%) | 1mo | $45,000 | $36 | 62 |
| 493 S Kilmer St | 0.26mi | 2/1.0 (-1) | 1,344 (+13%) | 7mo | $54,500 | $41 | 56 |
| 467 Groveland Ave | 0.36mi | 3/1.5 | 1,368 (+15%) | 2mo | $50,000 | $37 | 55 |
| 200 N Orchard Ave | 0.71mi | 3/1.5 | 1,256 (+5%) | 4mo | $35,000 | $28 | 53 |
| 273 Westwood Ave | 0.71mi | 3/1.0 | 1,248 (+5%) | 9mo | $16,000 | $13 | 51 |
| 113 Anna St | 0.52mi | 3/1.0 | 1,344 (+13%) | 5mo | $88,000 | $65 | 50 |
| 1045 Bunche Dr | 0.65mi | 3/2.0 | 1,355 (+14%) | 2mo | $171,900 | $127 | 41 |
| 130 Westwood Ave | 0.56mi | 2/1.0 (-1) | 1,036 (-13%) | 9mo | $52,000 | $50 | 40 |
Match score weights: distance 35% · size 25% · config 20% · recency 20%. Top-matched comps best support the ARV.
Projected returns pro-forma
-3.0% appreciation · 4.06% rent growth · sell at horizon
- IRR
- 38.6%
- Equity multiple
- 2.67×
- Total profit
- $25,694
- Equity at exit
- $8,186
- IRR
- 45.6%
- Equity multiple
- 5.59×
- Total profit
- $70,620
- Equity at exit
- $4,747
Cash invested: $15,372 (down + closing). Projections, not guarantees.
Landlord ↔ Tenant lean methodology
- Overall (STATE)
- 73 Landlord-Friendly
- State Ohio
- 73 Landlord-Friendly · R+6
- County
- — inherits STATE
- City
- — inherits STATE
ZIP-level market 45417
- Home prices YoY
- -32.3%
- Rents YoY
- 4.1%
- Active inventory
- 135
- Price-to-rent
- 3.9×
Monthly cashflow live
- Estimated rent
- $1,160 high interval (Pro) →
- Mortgage (P&I)
- −$288
- Tax from tax record
- −$83 /mo · $991/yr
- Insurance
- −$23
- HOA
- −$0
- Vacancy / Maint / Mgmt
- −$244
- Net cashflow
- $523
Break-even live
Sensitivity live
| Price | -10% $554 | -5% $539 | +0% $523 | +5% $508 | +10% $492 |
|---|---|---|---|---|---|
| Rent | -10% $431 | -5% $477 | +0% $523 | +5% $569 | +10% $615 |
| Rate | -1.0pp $551 | -0.5pp $537 | base $523 | +0.5pp $509 | +1.0pp $494 |
UW: 25.0% down · 7.5% · 30yr · 1.5% tax · 5.0% vac · 8.0% maint · 8.0% mgmt
Financing live
Cash to close
- Down payment
- $13,725
- Closing costs
- $1,647
- Reserves months
- —
- Total cash needed
- —
Loan-product check · same deal, 3 products live
Conventional
25% down · 7.5% · 30yr
- Down + closing
- —
- Monthly P&I
- —
- Monthly cashflow
- —
- DSCR
- —
- Eligible?
- —
Personal DTI + credit; lowest rate.
DSCR
20% down · 8.5% · 30yr
- Down + closing
- —
- Monthly P&I
- —
- Monthly cashflow
- —
- DSCR
- —
- Eligible?
- —
No personal income docs; deal must DSCR.
Hard money
10% down · 12.0% · 12mo
- Down + closing
- —
- Monthly P&I
- —
- Monthly cashflow
- —
- DSCR
- —
- Eligible?
- —
Short-term bridge; refi at stabilization.
Rent comps 31 comps
| Address | Beds | Baths | Sqft | Rent | $/sqft | DOM | Units | Dist |
|---|---|---|---|---|---|---|---|---|
| 623 Clifton Dr Apt B Dayton, OH | 2.0 | 1.0 | 1200 | $1,174 | $0.98 | 4d | 1 | 0.25mi |
| 623 Clifton Dr Apt A Dayton, OH | 2.0 | 1.0 | 1200 | $1,200 | $1.00 | 3d | 1 | 0.25mi |
| 652 Dennison Ave Dayton, OH | 2.0 | 2.0 | 988 | $1,095 | $1.11 | 22d | 1 | 0.26mi |
| 673 Randolph St Dayton, OH | 2.0 | 1.0 | 792 | $950 | $1.20 | 44d | 1 | 0.30mi |
| 2240 Lakeview Ave Dayton, OH | 3.0 | 1.0 | 1056 | $1,025 | $0.97 | 44d | 1 | 0.32mi |
| 70 Gramont Ave Dayton, OH | 3.0 | 1.5 | 966 | $1,300 | $1.35 | 3d | 1 | 0.50mi |
| 42 S Mathison St Dayton, OH | 3.0 | 1.0 | 1300 | $1,220 | $0.94 | 4d | 1 | 0.51mi |
| 40 S Mathison St Dayton, OH | 3.0 | 1.0 | 1300 | $1,200 | $0.92 | 15d | 1 | 0.51mi |
| 137 Westwood Ave Dayton, OH | 2.0 | 1.0 | 784 | $900 | $1.15 | 4d | 1 | 0.61mi |
| 216 N Ardmore Ave Dayton, OH | 3.0 | 1.0 | 1500 | $1,100 | $0.73 | 4d | 1 | 0.69mi |
| 1272 Clement Ave Dayton, OH | 3.0 | 1.0 | 1025 | $1,350 | $1.32 | 3d | 1 | 0.74mi |
| 47 Leroy St Dayton, OH | 3.0 | 1.0 | 1456 | $1,200 | $0.82 | 44d | 1 | 0.78mi |
| 1515 W Stewart St Dayton, OH | 2.0 | 1.0 | 925 | $1,000 | $1.08 | 44d | 1 | 0.79mi |
| 500 Bowie Dr Unit 122 Dayton, OH | 2.0 | 1.0 | 850 | $910 | $1.07 | 44d | 1 | 0.81mi |
| 437 Lorenz Ave Dayton, OH | 3.0 | 1.0 | 1322 | $1,200 | $0.91 | 24d | 1 | 0.94mi |
| 342 Lookout Ave Dayton, OH | 2.0 | 1.0 | 800 | $775 | $0.97 | 44d | 1 | 0.95mi |
| 342 Lookout Ave Dayton, OH | 2.0 | 1.0 | 800 | $750 | $0.94 | 3d | 1 | 0.95mi |
| 725 Maplehurst Ave Dayton, OH | 2.0 | 1.0 | 1104 | $895 | $0.81 | 44d | 1 | 1.06mi |
| 617 Westwood Ave Dayton, OH | 3.0 | 1.0 | 1304 | $1,050 | $0.81 | 44d | 1 | 1.12mi |
| 4109 Midway Ave Dayton, OH | 3.0 | 1.0 | 971 | $1,000 | $1.03 | 4d | 1 | 1.21mi |
| 635 Anna St Dayton, OH | 3.0 | 1.0 | 960 | $1,300 | $1.35 | 15d | 1 | 1.24mi |
| 828 Walton Ave Unit 832 Walton Dayton, OH | 2.0 | 1.0 | 750 | $795 | $1.06 | 24d | 1 | 1.25mi |
| 660 Gramont Ave Dayton, OH | 3.0 | 1.0 | 1142 | $1,050 | $0.92 | 4d | 1 | 1.29mi |
| 863 N Upland Ave Dayton, OH | 3.0 | 1.0 | 1042 | $1,200 | $1.15 | 44d | 1 | 1.33mi |
| 3925 Hoover Ave Dayton, OH | 2.0 | 1.0 | 936 | $1,100 | $1.18 | 3d | 1 | 1.36mi |
| 920 Huron Ave Dayton, OH | 2.0 | 1.0 | 950 | $995 | $1.05 | 4d | 1 | 1.40mi |
| 3939 Nicholas Rd Dayton, OH | 3.0 | 1.0 | 912 | $1,200 | $1.32 | 44d | 1 | 1.40mi |
| 1045 Philadelphia Dr Dayton, OH | 2.0 | 1.0 | 1290 | $1,150 | $0.89 | 3d | 1 | 1.46mi |
| 1119 Superior Ave Unit 1119 Dayton, OH | 3.0 | 1.0 | 1435 | $1,350 | $0.94 | 4d | 1 | 1.47mi |
| 3964 Nicholas Rd Dayton, OH | 3.0 | 1.0 | 912 | $1,000 | $1.10 | 4d | 1 | 1.47mi |
| 1045 Shakespeare Ave Dayton, OH | 3.0 | 1.0 | 1435 | $1,275 | $0.89 | 44d | 1 | 1.47mi |
Listing history 15 events
-
2026-06-05statusdays on market $54,900 Pending 63 DOM
-
2026-06-03days on market $54,900 Active 62 DOM
-
2026-06-02days on market $54,900 Active 61 DOM
-
2026-06-01days on market $54,900 Active 60 DOM
-
2026-05-31days on market $54,900 Active 59 DOM
-
2026-05-06price $59,900 642-char remark
Show marketing remark (642 chars)
There is plenty of potential with this itwo-story residence. The property offers three bedrooms and one full bathroom across 1192 square feet, hardwood flooring and this excellent investment awaits your personal touch, providing a blank canvas for personalization. The versatile living areas and kitchen present unique opportunities for renovation and customization. A classic staircase leads to the upper level, while a cozy fireplace promises warm ambiance. With cable TV hookups readily available, modern conveniences are seamlessly integrated. This residence offers an exceptional chance to create your dream home on South Ardmore Avenue.
-
2026-04-15price $64,900 642-char remark
Show marketing remark (642 chars)
There is plenty of potential with this itwo-story residence. The property offers three bedrooms and one full bathroom across 1192 square feet, hardwood flooring and this excellent investment awaits your personal touch, providing a blank canvas for personalization. The versatile living areas and kitchen present unique opportunities for renovation and customization. A classic staircase leads to the upper level, while a cozy fireplace promises warm ambiance. With cable TV hookups readily available, modern conveniences are seamlessly integrated. This residence offers an exceptional chance to create your dream home on South Ardmore Avenue.
-
2026-04-02$68,900 Active 642-char remark
Show marketing remark (642 chars)
There is plenty of potential with this itwo-story residence. The property offers three bedrooms and one full bathroom across 1192 square feet, hardwood flooring and this excellent investment awaits your personal touch, providing a blank canvas for personalization. The versatile living areas and kitchen present unique opportunities for renovation and customization. A classic staircase leads to the upper level, while a cozy fireplace promises warm ambiance. With cable TV hookups readily available, modern conveniences are seamlessly integrated. This residence offers an exceptional chance to create your dream home on South Ardmore Avenue.
-
2015-05-01historical
-
2014-05-06$8,000
-
2001-06-29soldstatus $10,000
-
2001-06-29soldstatus $10,000
-
1991-05-31soldstatus $10,200
-
1990-07-27soldstatus $14,500
-
1990-07-26soldstatus $14,500
ⓘ Source: listings_history table (triggers on properties + properties_extension) + one-shot
backfill from property_details.listing_events for pre-trigger history.
Tax reassessment forecast OH · Partial reset (capped growth)
- Current annual tax
- $991 · $83/mo
- Projected year-2 tax
- $991 · $83/mo
- Expected delta
- $0/yr ($0/mo · 0.0%)
ⓘ Screening estimate from a state-policy table — verify with the county assessor before closing.
Climate risk First Street
- Flood 1/10 Low FEMA zone X (unshaded) · 0% chance over 30 yrs
- Wildfire 1/10 Low
- Heat 3/10 Moderate 7 d/yr ≥104°F today · 18 d/yr by 30 yrs out
- Wind 2/10 Low 0% chance of damaging wind over 30 yrs
- Air quality 3/10 Moderate 3 unhealthy d/yr today · 5 by 30 yrs out
Nearby sold comps map
Loading sold comps map…
Walkable amenities ~0.75 mi
Loading nearby amenities…
Taxation est. · year 1
- Rental income
- $13,920
- − Mortgage interest
- −$3,075
- − Property taxes
- −$991
- − Insurance
- −$274
- − Repairs & maintenance
- −$1,114
- − Management
- −$1,114
- − Depreciation
- −$1,597
- Taxable income
- $5,755
- Est. tax owed @ 24.0%
- −$1,381
- After-tax cash flow
- $4,896/yr
For passive investors: Depreciation is non-cash, so a rental often shows a tax loss while cash-flowing — sheltering income. Rental losses are passive: they offset passive income freely, and up to $25,000/yr can offset ordinary (W-2) income if you actively participate and your MAGI is under $100k (phasing out to $0 by $150k); unused losses carry forward. On sale, claimed depreciation is recaptured at up to 25%, and gains may owe capital-gains tax (a 1031 exchange can defer both). Figures are a year-1 estimate at your 24.0% rate — not tax advice; consult a CPA.
Schools (NCES district)
- District
- Dayton City
- NCES district ID
- 3904384
- Math proficiency
- 12% ▼ -12.00%
- Reading proficiency
- 21% ▼ -11.00%
- Median HH income
- $28,688
- Composite
- 12.94/100
- National rank
- #9579
- State rank
- #641 of 656 in OH
Livability — Dayton
- Score
- 65/100
- State rank
- #716
- US rank
- #12895
Category grades
Schools grade is shown separately in the Schools card above.
Census & demographics
- Census place
- Dayton, OH
- County
- Montgomery County · 459,541 people
- City population
- 164,387
- Metro
- Dayton-Kettering, OH
- Population (ZIP)
- 28,186
- Household income
- $36,945
- Rent vs Own
- Severe rent burden
- 1822.0
Population outlook (Montgomery County) Hauer SSP2
- Today (2025)
- 523,241 people
- By 2030
- 514,948 · -1.6%
- By 2040
- 493,378 · -5.7%
- By 2050
- 469,639 · -10.2%
- By 2075
- 418,360 · -20.0%
- By 2100
- 353,315 · -32.5%
Race, ethnicity, and origin ACS 2023
- Neighborhood character
- Predominantly Black (71%)
- Race & ethnicity
- Black 71% White 20% Two or more races 8% Hispanic / Latino 3%
- Common ancestry
- Romanian 0%
- Foreign-born
- 3% · Canada
- Languages at home
- 96% English-only · Spanish 2% French/Haitian/Cajun 1%
Political lean MEDSL · Montgomery
- 2024 margin
- Toss-up / Even · D 49.8% · R 49.3%
- 2008→2024 swing
- -5.8pp toward R · 2008: 6.2pp · 2024: 0.5pp
- All cycles
- 2024: D+0.5 2020: D+2.2 2016: R+1.2 2012: D+3.1 2008: D+6.2
Not yet ingested
- Civics
- —
Market trends
- HPI YoY
- ▼ -92.43%
- Current HPI
- 193.4175
- Rent YoY
- ▲ 4.06%
- Metro
- Dayton-Kettering, OH
- State GDP YoY
- ▲ 1.98%
- F500 in state
- 48
Industry mix (Fortune 500 HQ in OH)
| Industry | F500 HQs | Revenue |
|---|---|---|
| Insurance | 3 | $145B |
|
||
| Industrial Machinery | 3 | $49B |
|
||
| Financial Services | 3 | $24B |
|
||
| Consumer Goods | 2 | $93B |
|
||
| Aerospace / Defense | 2 | $47B |
|
||
| Utilities | 2 | $33B |
|
||
Price history
+313.1% since first listed10 events — show timeline
- 2026-05-06 Price Changed $59,900 Dayton MLS
- 2026-04-15 Price Changed $64,900 Dayton MLS
- 2026-04-02 Listed $68,900 Dayton MLS
- 2015-05-01 Listing Removed — Dayton MLS
- 2014-05-06 Listed $8,000 Dayton MLS
- 2001-06-29 Sold (Public Records) $10,000 Public Records
- 2001-06-29 Sold (Public Records) $10,000 Public Records
- 1991-05-31 Sold (Public Records) $10,200 Public Records
- 1990-07-27 Sold (Public Records) $14,500 Public Records
- 1990-07-26 Sold (Public Records) $14,500 Public Records
Property tax history
+1.3%/yrLatest (2025): $991 · +2.0% YoY. Source: county tax records.
Cash-flow waterfall
monthlySold comps — $/sqft
last 12 mo · ≤1 miLoading sold comps…