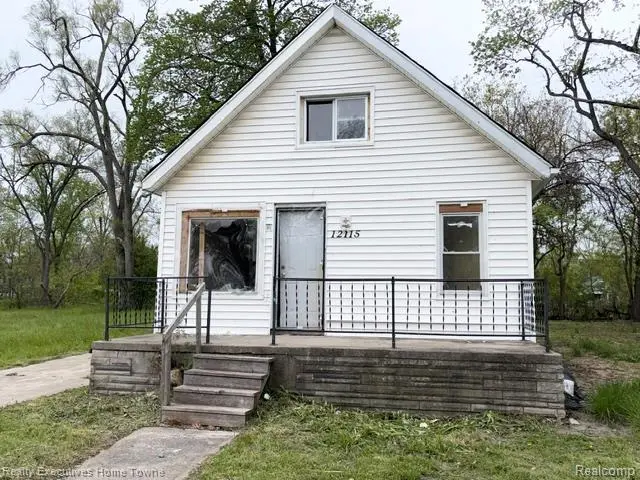
12115 Woodmont Ave · Detroit, MI
Flood risk 1/10 · Minimal
- FEMA flood zone
- X (unshaded)
- Chance of flooding over 30 yrs
- 0.0%
- Est. flood insurance / yr
- $507 – $1,088
Fire risk 1/10 · Minimal
- Est. fire insurance / yr
- $784 – $1,456
Heat risk 3/10 · Minor
- Hot days now (above 98°F)
- 7 days/yr
- Hot days in 30 yrs
- 15 days/yr
Wind risk 2/10 · Minimal
- Chance of severe wind over 30 yrs
- —
Air-quality risk 3/10 · Minor
- Unhealthy air days now
- 2 days/yr
- Unhealthy air days in 30 yrs
- 5 days/yr
Risk factors via First Street. Map © Google.
Why this score? — see what drove the D grade
The composite is a weighted blend of 9 inputs, each scored 0–100. Each bar is that input's sub-score; the figure is the points it added to the 100-point composite (weight × sub-score).
- Cash flow +15.0/30.0
- ARV discount +7.5/15.0
- 1% rule +5.0/10.0
- DSCR +5.0/10.0
- Rent growth +3.9/5.0
- Livability +3.7/5.0
- Condition / age +2.5/5.0
- Schools +1.3/10.0
- Appreciation +0.0/10.0
$26,950
🖨 Deal sheet (PDF) 📄 Offer letter ✓ Due diligence
Listing remarks MLS
3 bedroom, 1 bathroom frame bungalow home on a large lot located in the Grandale neighborhood.
Key facts
- 4,356 sq ft lot
- Built 1925
- Listed 39 days
Property features AI
Finance
- Other: Listed by Realty Executives Home Towne
Exterior
- Parking: No garage
- Utilities: Public water; Sewer available
- Home design: Single-family residence; One and one-half story; Entry at ground level with steps
- Construction: Aluminum siding; Slab foundation; Built area above grade: 693 (square feet)
- Exterior features: Paved road access; Lot approximately 0.1 acre (35 x 124.25)
Interior
- Bathrooms: One full bathroom
- Heating & cooling: Forced air heating (natural gas); No cooling
- Interior features: Five total rooms; Ground-level entry with steps
Neighborhood map
What this means for you Summary
Snapshot
- This is a 3-bed/1.0-bath single-family listed at $27k.
Deal economics
- At list price, monthly cash flow is $745 ($9k/yr) — positive.
- The deal already cash-flows at list — no discount required.
- Meets the 1% rule at list price ($1k rent vs $27k).
- Recommended offer: $26k (3.0% below list) — sets the bar for market timing.
- Cap rate 39.5% vs local median 10.0% in Detroit — top-decile yield for the area; either an underpriced asset or a hidden risk that comps aren't pricing in. Stress-test before assuming the spread holds.
Location & tenants
- Location reads 73/100 on livability (#218 in MI) — a middle-class / working-renter tenant base. Strengths: amenities A+, commute A+, cost of living A+; Watch: crime F, employment F.
- Detroit Public Schools Community District (urban): math 10% / reading 24% proficiency, ranked #499 of 540 in MI (top 92%) — low school quality limits family demand, transient renter base, plan for 1-2y turnover; 90% free/reduced lunch — lower-income household profile, screen leases tightly.
- Zoned schools: Henderson Academy (math 10% / reading 10%, grade F, #1,230 of 1,397 statewide, top 91%, 520 students, 91% FRL); Cody High School (math 24% / reading 24%, grade F, #481 of 713 statewide, top 81%, 466 students, 88% FRL) — zoned schools at 89% FRL track the district average.
- Market conditions: Rents rising fast (+5.6%/yr); 392 active listings in the ZIP; 3 comparable units currently listed for rent nearby; rentals leasing fast (median 7d on market — plan ~1-2 weeks tenant-placement turnaround); lower-income renter base — watch delinquency; 2,639 units permitted in Wayne County in 2024 (1,216 in 5+ unit buildings).
- This rent runs 42% of the median local income ($37k/yr) — at the standard rent-burdened threshold; future hikes will face affordability resistance.
Forward outlook
- Local home prices are declining (-3.0%/yr); year-one equity from $186 of loan paydown is wiped out by about $808 of value loss. Plan a longer hold.
- Wayne County population projected at -17% by 2050 — secular population decline; favor cash flow + early exit over multi-decade hold.
- At projected returns (-3.0% appreciation + 5.6% rent growth), your $8k cash investment doubles in ~1 year — after that, you're playing with house money.
Negotiation context
- It's been on market 39 days — a 3% lower offer ($26k) is reasonable based on typical stale-listing flexibility.
- 14 sale attempts since 14y ago with the ask held roughly flat each time — persistent listings suggest the price (not the market) is what's stuck; bring a comps-based counter.
- Current owner paid $17k; list at $27k implies a 59% gain — meaningful room to come down on a strong offer.
Risks & watch-outs
- Watch-outs: property tax is 4.9% of price; built in 1925 — expect roof / HVAC / electrical / plumbing capex.
Questions for the listing agent
- It's been on market 39 days. Have you received any prior offers? Is the seller open to a 3% concession, seller financing, or rate buy-down credit?
- Built in 1925 — when were the roof, HVAC, electrical panel, plumbing, and water heater last replaced?
- Property tax is high relative to price — has the assessment been appealed recently, and will the sale trigger a re-assessment?
- Is there a deadline driving the sale (1031 exchange, divorce, estate, relocation)? That informs how much negotiation room exists.
- Schools are F-rated, which usually means shorter tenancies and higher turnover. Who's the typical renter profile here, and what's been the actual vacancy rate?
- Crime grade is F in this area — have there been break-ins, vandalism, or insurance claims at this property in the last 3 years? What carrier currently insures it and at what premium?
- The area grade is low — what's the realistic commute time and amenity access for the typical tenant pool here? Any planned neighborhood developments (good or bad) we should know about?
- What's the average days-on-market for RENTAL listings here right now (not sales)? A rising rental-DOM trend means longer vacancies and softer asking-rent achievability than the comps imply.
- What's the recent tenant-quality profile in this submarket — average credit score on applications, eviction rate, late-payment / NSF rate, and stable-employment percentage? A property-management company in the area should have these aggregated.
- How much new for-sale + rental construction is in the pipeline within 1–3 miles? Heavy new supply typically softens prices + rents 12–24 months out; constrained supply supports both.
Investment metrics
- 1% rule
- 4.73% ✓
- Cap rate
- 39.46%
- Cash-on-cash
- 118.44%
- DSCR
- 6.27
- GRM
- 1.8
CMA / ARV
- ARV (median comp)
- $59,436
- List price
- $26,950
- Delta
- -54.66%
- Verdict
- UNDERPRICED
- Comps
- 20 within 1.0 mi
Show comp detail 9 sales within ~0.75 mi
| Address | Dist | Beds/Ba | Sqft | Sold | Price | $/sf | Match |
|---|---|---|---|---|---|---|---|
| 12217 Mansfield St | 0.26mi | 2/1.0 (-1) | 683 (-1%) | 4mo | $46,000 | $67 | 77 |
| 12257 Abington Ave | 0.16mi | 3/1.0 | 768 (+11%) | 21mo | $46,350 | $60 | 57 |
| 11694 Forrer St | 0.43mi | 3/1.0 | 768 (+11%) | 6mo | $58,000 | $76 | 57 |
| 9950 Memorial St | 0.57mi | 3/1.0 | 746 (+8%) | 7mo | $5,500 | $7 | 55 |
| 10000 Montrose St | 0.67mi | 2/1.0 (-1) | 732 (+6%) | 4mo | $25,000 | $34 | 51 |
| 11738 Greenview Ave | 0.73mi | 2/1.0 (-1) | 692 (-0%) | 12mo | $43,000 | $62 | 51 |
| 11330 Mansfield St | 0.48mi | 2/1.0 (-1) | 729 (+5%) | 19mo | $21,000 | $29 | 48 |
| 9924 Montrose St | 0.73mi | 2/1.0 (-1) | 716 (+3%) | 12mo | $55,000 | $77 | 45 |
| 10009 Archdale St | 0.61mi | 3/1.0 | 772 (+11%) | 18mo | $51,000 | $66 | 38 |
Match score weights: distance 35% · size 25% · config 20% · recency 20%. Top-matched comps best support the ARV.
Projected returns pro-forma
-3.0% appreciation · 5.59% rent growth · sell at horizon
- IRR
- —
- Equity multiple
- 7.17×
- Total profit
- $46,541
- Equity at exit
- $4,018
- IRR
- —
- Equity multiple
- 16.45×
- Total profit
- $116,613
- Equity at exit
- $2,330
Cash invested: $7,546 (down + closing). Projections, not guarantees.
Landlord ↔ Tenant lean methodology
- Overall (STATE)
- 62 Landlord-Friendly
- State Michigan
- 62 Landlord-Friendly · EVEN
- County
- — inherits STATE
- City
- — inherits STATE
ZIP-level market 48227
- Rents YoY
- 5.6%
- Active inventory
- 392
- Price-to-rent
- 1.8×
Monthly cashflow live
- Estimated rent
- $1,274 medium interval (Pro) →
- Mortgage (P&I)
- −$141
- Tax from tax record
- −$109 /mo · $1,310/yr
- Insurance
- −$11
- HOA
- −$0
- Vacancy / Maint / Mgmt
- −$268
- Net cashflow
- $745
Break-even live
Sensitivity live
| Price | -10% $839 | -5% $830 | +0% $745 | +5% $737 | +10% $730 |
|---|---|---|---|---|---|
| Rent | -10% $644 | -5% $694 | +0% $745 | +5% $795 | +10% $845 |
| Rate | -1.0pp $758 | -0.5pp $752 | base $745 | +0.5pp $738 | +1.0pp $731 |
UW: 25.0% down · 7.5% · 30yr · 1.5% tax · 5.0% vac · 8.0% maint · 8.0% mgmt
Financing live
Cash to close
- Down payment
- $6,738
- Closing costs
- $808
- Reserves months
- —
- Total cash needed
- —
Loan-product check · same deal, 3 products live
Conventional
25% down · 7.5% · 30yr
- Down + closing
- —
- Monthly P&I
- —
- Monthly cashflow
- —
- DSCR
- —
- Eligible?
- —
Personal DTI + credit; lowest rate.
DSCR
20% down · 8.5% · 30yr
- Down + closing
- —
- Monthly P&I
- —
- Monthly cashflow
- —
- DSCR
- —
- Eligible?
- —
No personal income docs; deal must DSCR.
Hard money
10% down · 12.0% · 12mo
- Down + closing
- —
- Monthly P&I
- —
- Monthly cashflow
- —
- DSCR
- —
- Eligible?
- —
Short-term bridge; refi at stabilization.
Rent comps 3 comps
| Address | Beds | Baths | Sqft | Rent | $/sqft | DOM | Units | Dist |
|---|---|---|---|---|---|---|---|---|
| 11345 Greenfield Rd Detroit, MI | 2.0 | 1.0 | 700 | $1,050 | $1.50 | 14d | 1 | 0.67mi |
| 12875 Faust Ave Detroit, MI | 2.0 | 1.0 | 735 | $1,200 | $1.63 | 7d | 1 | 0.84mi |
| 18450 W Chicago Detroit, MI | 1.0–2.0 | 1.0 | 687 | $1,117 | $1.62 | 0d | 15 | 0.98mi |
Listing history 47 events
-
2026-06-21days on market $26,950 Active 39 DOM
-
2026-06-18days on market $26,950 Active 36 DOM
-
2026-06-17days on market $26,950 Active 35 DOM
-
2026-06-15days on market $26,950 Active 33 DOM
-
2026-06-13days on market $26,950 Active 31 DOM
-
2026-06-13days on market $26,950 Active 30 DOM
-
2026-06-09days on market $26,950 Active 27 DOM
-
2026-06-08days on market $26,950 Active 26 DOM
-
2026-06-07days on market $26,950 Active 25 DOM
-
2026-06-04days on market $26,950 Active 22 DOM
-
2026-06-03days on market $26,950 Active 21 DOM
-
2026-06-02days on market $26,950 Active 20 DOM
-
2026-06-01days on market $26,950 Active 19 DOM
-
2026-05-31days on market $26,950 Active 18 DOM
-
2026-05-13$26,950 Active 94-char remark
Show marketing remark (94 chars)
3 bedroom, 1 bathroom frame bungalow home on a large lot located in the Grandale neighborhood.
-
2026-05-13$26,950 Active 94-char remark
Show marketing remark (94 chars)
3 bedroom, 1 bathroom frame bungalow home on a large lot located in the Grandale neighborhood.
-
2021-01-12soldstatus $17,000 Sold
Show marketing remark (163 chars)
this lovely 3 bedroom 1 bathroom would make a great family home! this home is location in the Grandale neighborhood, the school district is Detroit public schools.
-
2021-01-12soldstatus $17,000 Closed
Show marketing remark (163 chars)
this lovely 3 bedroom 1 bathroom would make a great family home! this home is location in the Grandale neighborhood, the school district is Detroit public schools.
-
2020-11-23status Pending
Show marketing remark (163 chars)
this lovely 3 bedroom 1 bathroom would make a great family home! this home is location in the Grandale neighborhood, the school district is Detroit public schools.
-
2020-11-23status Pending
Show marketing remark (163 chars)
this lovely 3 bedroom 1 bathroom would make a great family home! this home is location in the Grandale neighborhood, the school district is Detroit public schools.
-
2020-10-21historical Accepting Backup Offers
Show marketing remark (163 chars)
this lovely 3 bedroom 1 bathroom would make a great family home! this home is location in the Grandale neighborhood, the school district is Detroit public schools.
-
2020-10-21historical Accepting Backup Offers
Show marketing remark (163 chars)
this lovely 3 bedroom 1 bathroom would make a great family home! this home is location in the Grandale neighborhood, the school district is Detroit public schools.
-
2020-09-17$19,900 Active
Show marketing remark (163 chars)
this lovely 3 bedroom 1 bathroom would make a great family home! this home is location in the Grandale neighborhood, the school district is Detroit public schools.
-
2020-09-17$19,900 Active
Show marketing remark (163 chars)
this lovely 3 bedroom 1 bathroom would make a great family home! this home is location in the Grandale neighborhood, the school district is Detroit public schools.
-
2020-09-16historical
-
2020-09-16historical
-
2020-08-18price $27,900
-
2020-08-18price $27,900
-
2020-08-07$24,900 Active
-
2020-08-07$24,900 Active
-
2013-12-17soldstatus $200
-
2013-12-17soldstatus $200
-
2013-10-23historical
-
2013-04-26$200
-
2013-04-26$200
-
2013-04-23historical
-
2013-04-23historical
-
2012-12-27$490
-
2012-12-27$490
-
2012-11-29historical
-
2012-11-28historical
-
2012-11-01$700
-
2012-11-01$700
-
2012-10-31historical
-
2012-10-30historical
-
2012-04-27$700
-
2012-04-27$700
ⓘ Source: listings_history table (triggers on properties + properties_extension) + one-shot
backfill from property_details.listing_events for pre-trigger history.
Tax reassessment forecast MI · Partial reset (capped growth)
- Current annual tax
- $1,310 · $109/mo
- Projected year-2 tax
- $1,310 · $109/mo
- Expected delta
- $0/yr ($0/mo · 0.0%)
ⓘ Screening estimate from a state-policy table — verify with the county assessor before closing.
Climate risk First Street
- Flood 1/10 Low FEMA zone X (unshaded) · 0% chance over 30 yrs
- Wildfire 1/10 Low
- Heat 3/10 Moderate 7 d/yr ≥98°F today · 15 d/yr by 30 yrs out
- Wind 2/10 Low
- Air quality 3/10 Moderate 2 unhealthy d/yr today · 5 by 30 yrs out
Nearby sold comps map
Loading sold comps map…
Walkable amenities ~0.75 mi
Loading nearby amenities…
Taxation est. · year 1
- Rental income
- $15,288
- − Mortgage interest
- −$1,510
- − Property taxes
- −$1,310
- − Insurance
- −$135
- − Repairs & maintenance
- −$1,223
- − Management
- −$1,223
- − Depreciation
- −$784
- Taxable income
- $9,104
- Est. tax owed @ 24.0%
- −$2,185
- After-tax cash flow
- $6,752/yr
For passive investors: Depreciation is non-cash, so a rental often shows a tax loss while cash-flowing — sheltering income. Rental losses are passive: they offset passive income freely, and up to $25,000/yr can offset ordinary (W-2) income if you actively participate and your MAGI is under $100k (phasing out to $0 by $150k); unused losses carry forward. On sale, claimed depreciation is recaptured at up to 25%, and gains may owe capital-gains tax (a 1031 exchange can defer both). Figures are a year-1 estimate at your 24.0% rate — not tax advice; consult a CPA.
Schools (NCES district)
- District
- Detroit Public Schools Community District
- NCES district ID
- 2601103
- Math proficiency
- 10% ▼ -2.00%
- Reading proficiency
- 24% ▲ 6.00%
- Median HH income
- $25,815
- Composite
- 13.06/100
- National rank
- #9564
- State rank
- #499 of 540 in MI
Livability — Detroit
- Score
- 73/100
- State rank
- #218
- US rank
- #5427
Category grades
Schools grade is shown separately in the Schools card above.
Census & demographics
- Census place
- Detroit, MI
- County
- Wayne County · 1,562,939 people
- City population
- 572,865
- Metro
- Detroit-Warren-Dearborn, MI
- Population (ZIP)
- 40,302
- Household income
- $36,527
- Rent vs Own
- Severe rent burden
- 2371.0
Population outlook (Wayne County) Hauer SSP2
- Today (2025)
- 1,675,273 people
- By 2030
- 1,620,300 · -3.3%
- By 2040
- 1,502,341 · -10.3%
- By 2050
- 1,384,039 · -17.4%
- By 2075
- 1,124,592 · -32.9%
- By 2100
- 881,193 · -47.4%
Race, ethnicity, and origin ACS 2023
- Neighborhood character
- Predominantly Black (95%)
- Race & ethnicity
- Black 95% Two or more races 3% White 1%
- Foreign-born
- 1%
- Languages at home
- 98% English-only · Spanish 1% French/Haitian/Cajun 1%
Political lean MEDSL · Wayne
- 2024 margin
- Strong D (+29.0) · D 62.7% · R 33.7% · Other 3.6%
- 2008→2024 swing
- -20.5pp toward R · 2008: 49.5pp · 2024: 29.0pp
- All cycles
- 2024: D+29.0 2020: D+38.1 2016: D+37.3 2012: D+46.9 2008: D+49.5
Not yet ingested
- Civics
- —
Market trends
- HPI YoY
- ▼ -125.00%
- Current HPI
- 186.4158
- Rent YoY
- ▲ 5.59%
- Metro
- Detroit-Warren-Dearborn, MI
- State GDP YoY
- ▲ 1.37%
- F500 in state
- 28
Industry mix (Fortune 500 HQ in MI)
| Industry | F500 HQs | Revenue |
|---|---|---|
| Automotive Parts | 3 | $48B |
|
||
| Automotive | 2 | $372B |
|
||
| Chemicals | 1 | $45B |
|
||
| Automotive Retail | 1 | $29B |
|
||
| Healthcare / Medical Devices | 1 | $23B |
|
||
| Automotive Technology | 1 | $20B |
|
||
Price history
+8.2% since first listed33 events — show timeline
- 2026-05-13 Listed $26,950 MiRealSource-MiMLS
- 2026-05-13 Listed $26,950 REALCOMP
- 2021-01-12 Sold (MLS) $17,000 MiRealSource-MiMLS
- 2021-01-12 Sold (MLS) $17,000 REALCOMP
- 2020-11-23 Pending — MiRealSource-MiMLS
- 2020-11-23 Pending — REALCOMP
- 2020-10-21 Contingent — MiRealSource-MiMLS
- 2020-10-21 Contingent — REALCOMP
- 2020-09-17 Listed $19,900 MiRealSource-MiMLS
- 2020-09-17 Listed $19,900 REALCOMP
- 2020-09-16 Listing Removed — REALCOMP
- 2020-09-16 Listing Removed — MiRealSource-MiMLS
- 2020-08-18 Price Changed $27,900 MiRealSource-MiMLS
- 2020-08-18 Price Changed $27,900 REALCOMP
- 2020-08-07 Listed $24,900 MiRealSource-MiMLS
- 2020-08-07 Listed $24,900 REALCOMP
- 2013-12-17 Sold (MLS) $200 MiRealSource-MiMLS
- 2013-12-17 Sold (MLS) $200 REALCOMP
- 2013-10-23 Listing Removed — MiRealSource-MiMLS
- 2013-04-26 Listed $200 MiRealSource-MiMLS
- 2013-04-26 Listed $200 REALCOMP
- 2013-04-23 Listing Removed — REALCOMP
- 2013-04-23 Listing Removed — MiRealSource-MiMLS
- 2012-12-27 Listed $490 REALCOMP
- 2012-12-27 Listed $490 MiRealSource-MiMLS
- 2012-11-29 Listing Removed — MiRealSource-MiMLS
- 2012-11-28 Listing Removed — REALCOMP
- 2012-11-01 Listed $700 REALCOMP
- 2012-11-01 Listed $700 MiRealSource-MiMLS
- 2012-10-31 Listing Removed — MiRealSource-MiMLS
- 2012-10-30 Listing Removed — REALCOMP
- 2012-04-27 Listed $700 REALCOMP
- 2012-04-27 Listed $700 MiRealSource-MiMLS
Property tax history
+14.5%/yrLatest (2025): $1,310 · +1.7% YoY. Source: county tax records.
Cash-flow waterfall
monthlySold comps — $/sqft
last 12 mo · ≤1 miLoading sold comps…