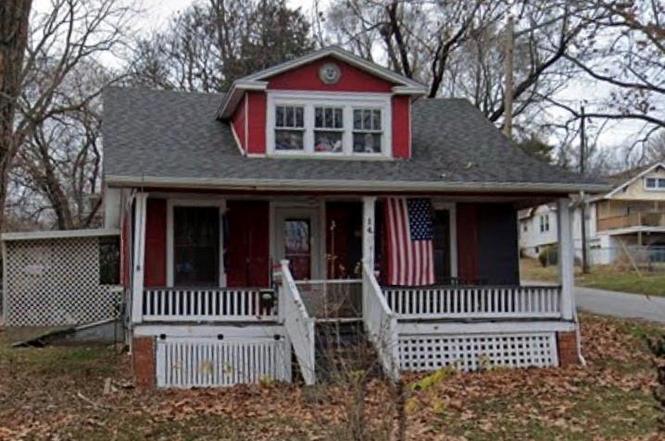
144 N Hardy Ave · Independence, MO
Flood risk 1/10 · Minimal
- FEMA flood zone
- X (unshaded)
- Chance of flooding over 30 yrs
- 0.0%
- Est. flood insurance / yr
- $473 – $860
Fire risk 1/10 · Minimal
- Est. fire insurance / yr
- $1,054 – $1,958
Heat risk 4/10 · Minor
- Hot days now (above 107°F)
- 7 days/yr
- Hot days in 30 yrs
- 17 days/yr
Wind risk 2/10 · Minimal
- Chance of severe wind over 30 yrs
- —
Air-quality risk 3/10 · Minor
- Unhealthy air days now
- 2 days/yr
- Unhealthy air days in 30 yrs
- 3 days/yr
Risk factors via First Street. Map © Google.
Why this score? — see what drove the B+ grade
The composite is a weighted blend of 9 inputs, each scored 0–100. Each bar is that input's sub-score; the figure is the points it added to the 100-point composite (weight × sub-score).
- Cash flow +30.0/30.0
- 1% rule +10.0/10.0
- DSCR +10.0/10.0
- Appreciation +10.0/10.0
- ARV discount +7.5/15.0
- Livability +4.1/5.0
- Schools +2.7/10.0
- Rent growth +2.5/5.0
- Condition / age +2.5/5.0
$80,000
🖨 Deal sheet (PDF) 📄 Offer letter ✓ Due diligence
Listing remarks
BEING SOLD AS-IS - Seller will not fix anything. House has never been lived in by Seller - she is the trustee
Key facts
- 0.3 acre lot
- Built 1912
- Listed 44 days
Property features AI
Finance
- HOA & community: No association fees
Exterior
- Parking: Off-street parking
- Utilities: Public water; Public sewer
- Home design: Single-family residence; Attached property; 1.5-story layout
- Construction: Frame construction; Composition roof
- Exterior features: Lot approximately 13,049 sq ft; Not in a flood plain; Off-street parking
Interior
- Bedrooms: 3 bedrooms (two on the first floor, one on the second floor)
- Bathrooms: 1 full bathroom
- Heating & cooling: Natural gas heating; Window air conditioning units
- Interior features: Full basement
Neighborhood map
What this means for you Summary
Snapshot
- This is a 4-bed/1.0-bath single-family listed at $80k.
Deal economics
- At list price, monthly cash flow is $650 ($8k/yr) — positive.
- The deal already cash-flows at list — no discount required.
- Meets the 1% rule at list price ($2k rent vs $80k).
- Recommended offer: $78k (3.0% below list) — sets the bar for market timing.
- Cap rate 16.0% vs local median 5.0% in Independence — top-decile yield for the area; either an underpriced asset or a hidden risk that comps aren't pricing in. Stress-test before assuming the spread holds.
Location & tenants
- Location reads 82/100 on livability (#10 in MO, #1,296 nationally) — a professional / high-income tenant draw. Strengths: amenities A+, commute A+, cost of living A+; Watch: employment D+, crime F.
- Independence 30 (suburban): math 26% / reading 38% proficiency, ranked #252 of 324 in MO (top 78%) — families likely to look elsewhere, expect single-tenant / working-renter base with shorter leases.
- Zoned schools: Fairmount Elem. (math 27% / reading 37%, grade F, #761 of 1,115 statewide, top 72%, 312 students, 82% FRL); Clifford H. Nowlin Middle (math 13% / reading 29%, grade F, #342 of 391 statewide, top 88%, 875 students, 80% FRL); Van Horn High (math 13% / reading 27%, grade F, #472 of 521 statewide, top 91%, 1,047 students, 72% FRL) — zoned schools average 78% FRL vs 58% district-wide (20 pts higher); higher-poverty schools than district average — tighter screening recommended.
- Market conditions: 45 active listings in the ZIP; 14 comparable units currently listed for rent nearby; rentals at typical pace (median 23d on market — plan ~3-4 weeks tenant-placement turnaround); 43% of comp listings sitting > 30 days — soft ceiling on asking rent; 4,002 units permitted in Jackson County in 2024 (2,271 in 5+ unit buildings).
- This rent runs 39% of the median local income ($47k/yr) — at the standard rent-burdened threshold; future hikes will face affordability resistance.
Forward outlook
- In year one you build about $9k of equity ($553 loan paydown + $8k appreciation (10.0% local appreciation)).
- Jackson County population projected at +4% by 2050 — modest demand growth; plan on rents tracking national, not racing it.
- At projected returns (10.0% appreciation + 3.0% rent growth), your $22k cash investment doubles in ~2 years — after that, you're playing with house money.
- By year 4, paydown + projected appreciation supports a ~$30k cash-out refi (75% LTV) — recoverable capital for the next deal without selling this one.
Negotiation context
- It's been on market 44 days — a 3% lower offer ($78k) is reasonable based on typical stale-listing flexibility.
- 2 sale attempts with the ask held roughly flat each time — persistent listings suggest the price (not the market) is what's stuck; bring a comps-based counter.
Risks & watch-outs
- Watch-outs: built in 1912 — expect roof / HVAC / electrical / plumbing capex.
Questions for the listing agent
- It's been on market 44 days. Have you received any prior offers? Is the seller open to a 3% concession, seller financing, or rate buy-down credit?
- Built in 1912 — when were the roof, HVAC, electrical panel, plumbing, and water heater last replaced?
- Is there a deadline driving the sale (1031 exchange, divorce, estate, relocation)? That informs how much negotiation room exists.
- Crime grade is F in this area — have there been break-ins, vandalism, or insurance claims at this property in the last 3 years? What carrier currently insures it and at what premium?
- What's the average days-on-market for RENTAL listings here right now (not sales)? A rising rental-DOM trend means longer vacancies and softer asking-rent achievability than the comps imply.
- What's the recent tenant-quality profile in this submarket — average credit score on applications, eviction rate, late-payment / NSF rate, and stable-employment percentage? A property-management company in the area should have these aggregated.
- How much new for-sale + rental construction is in the pipeline within 1–3 miles? Heavy new supply typically softens prices + rents 12–24 months out; constrained supply supports both.
Investment metrics
- 1% rule
- 1.90% ✓
- Cap rate
- 16.04%
- Cash-on-cash
- 34.81%
- DSCR
- 2.55
- GRM
- 4.4
CMA / ARV
- ARV (on-the-fly)
- $181,304
- Comps found
- 12
Show comp detail 12 sales within ~0.75 mi
| Address | Dist | Beds/Ba | Sqft | Sold | Price | $/sf | Match |
|---|---|---|---|---|---|---|---|
| 108 S Hardy Ave | 0.15mi | 3/1.5 (-1) | 1,472 (+6%) | 10mo | $130,000 | $88 | 67 |
| 10503 E Scarritt Ave | 0.09mi | 3/1.0 (-1) | 1,190 (-14%) | 8mo | $79,900 | $67 | 61 |
| 309 N Cedar Ave | 0.23mi | 3/2.0 (-1) | 1,550 (+12%) | 1mo | $272,000 | $175 | 59 |
| 107 S Claremont Ave | 0.68mi | 3/2.0 (-1) | 1,342 (-3%) | 3mo | $199,900 | $149 | 52 |
| 531 S Cedar Ave | 0.49mi | 4/2.0 | 1,256 (-9%) | 8mo | $164,000 | $131 | 51 |
| 11208 Chicago Ave | 0.62mi | 3/1.0 (-1) | 1,250 (-10%) | 0mo | $135,000 | $108 | 50 |
| 11225 Felton St | 0.63mi | 3/2.0 (-1) | 1,300 (-6%) | 2mo | $299,000 | $230 | 50 |
| 534 S Evanston Ave | 0.64mi | 4/1.0 | 1,176 (-15%) | 3mo | $129,900 | $110 | 42 |
| 911 N High St | 0.74mi | 3/1.5 (-1) | 1,321 (-5%) | 12mo | $180,000 | $136 | 41 |
| 229 N Crescent Ave | 0.54mi | 3/2.0 (-1) | 1,460 (+6%) | 21mo | $189,900 | $130 | 39 |
| 11216 Felton St | 0.60mi | 3/2.0 (-1) | 1,310 (-5%) | 20mo | $219,500 | $168 | 37 |
| 619 S Hardy Ave | 0.71mi | 4/2.0 | 1,567 (+13%) | 11mo | $144,500 | $92 | 32 |
Match score weights: distance 35% · size 25% · config 20% · recency 20%. Top-matched comps best support the ARV.
Projected returns pro-forma
10.0% appreciation · 3.0% rent growth · sell at horizon
- IRR
- 51.0%
- Equity multiple
- 4.79×
- Total profit
- $84,972
- Equity at exit
- $72,070
- IRR
- 44.6%
- Equity multiple
- 10.72×
- Total profit
- $217,731
- Equity at exit
- $155,422
Cash invested: $22,400 (down + closing). Projections, not guarantees.
Landlord ↔ Tenant lean methodology
- Overall (STATE)
- 81 Strongly Landlord-Friendly
- State Missouri
- 81 Strongly Landlord-Friendly · R+10
- County
- — inherits STATE
- City
- — inherits STATE
ZIP-level market 64053
- Home prices YoY
- 17.9%
- Active inventory
- 45
- Price-to-rent
- 4.4×
Monthly cashflow live
- Estimated rent
- $1,520 high interval (Pro) →
- Mortgage (P&I)
- −$420
- Tax from tax record
- −$98 /mo · $1,176/yr
- Insurance
- −$33
- HOA
- −$0
- Vacancy / Maint / Mgmt
- −$319
- Net cashflow
- $650
Break-even live
Sensitivity live
| Price | -10% $695 | -5% $672 | +0% $650 | +5% $627 | +10% $604 |
|---|---|---|---|---|---|
| Rent | -10% $530 | -5% $590 | +0% $650 | +5% $710 | +10% $770 |
| Rate | -1.0pp $690 | -0.5pp $670 | base $650 | +0.5pp $629 | +1.0pp $608 |
UW: 25.0% down · 7.5% · 30yr · 1.5% tax · 5.0% vac · 8.0% maint · 8.0% mgmt
Financing live
Cash to close
- Down payment
- $20,000
- Closing costs
- $2,400
- Reserves months
- —
- Total cash needed
- —
Loan-product check · same deal, 3 products live
Conventional
25% down · 7.5% · 30yr
- Down + closing
- —
- Monthly P&I
- —
- Monthly cashflow
- —
- DSCR
- —
- Eligible?
- —
Personal DTI + credit; lowest rate.
DSCR
20% down · 8.5% · 30yr
- Down + closing
- —
- Monthly P&I
- —
- Monthly cashflow
- —
- DSCR
- —
- Eligible?
- —
No personal income docs; deal must DSCR.
Hard money
10% down · 12.0% · 12mo
- Down + closing
- —
- Monthly P&I
- —
- Monthly cashflow
- —
- DSCR
- —
- Eligible?
- —
Short-term bridge; refi at stabilization.
Rent comps 14 comps
| Address | Beds | Baths | Sqft | Rent | $/sqft | DOM | Units | Dist |
|---|---|---|---|---|---|---|---|---|
| 10622 E Scarritt Ave Sugar Creek, MO | 4.0 | 1.0 | 1560 | $1,445 | $0.93 | 45d | 1 | 0.20mi |
| 100 S Oxford Ave Independence, MO | 3.0 | 2.0 | 1141 | $1,425 | $1.25 | 46d | 1 | 0.72mi |
| 554 S Arlington Ave Independence, MO | 4.0 | 1.0 | 1161 | $1,395 | $1.20 | 16d | 1 | 0.74mi |
| 11500 E Anderson St Independence, MO | 3.0 | 2.0 | 1200 | $1,599 | $1.33 | 19d | 1 | 0.80mi |
| 11323 E Thompson St Sugar Creek, MO | 3.0 | 2.5 | 1794 | $1,800 | $1.00 | 14d | 1 | 0.89mi |
| 576 S Oxford Ave Independence, MO | 3.0 | 2.0 | 1098 | $1,400 | $1.28 | 45d | 1 | 0.90mi |
| 10104 E Golf Ave Independence, MO | 3.0 | 2.0 | 1205 | $1,395 | $1.16 | 16d | 1 | 0.93mi |
| 600 S Glenwood Ave Unit G Independence, MO | 4.0 | 2.0 | 1600 | $1,675 | $1.05 | 45d | 1 | 0.93mi |
| 600 S Glenwood Ave Unit G-2 Independence, MO | 3.0 | 2.0 | 1600 | $1,650 | $1.03 | 23d | 1 | 0.93mi |
| 182 Novak St Sugar Creek, MO | 3.0 | 2.0 | 1350 | $1,800 | $1.33 | 19d | 1 | 0.98mi |
| 1109 S Appleton Ave Independence, MO | 3.0 | 2.0 | 1200 | $1,195 | $1.00 | 18d | 1 | 1.09mi |
| 9528 E Winner Rd Independence, MO | 1.0–3.0 | 1.0 | 730 | $1,099 | $1.51 | 45d | 1 | 1.18mi |
| 1416 S Hardy Ave Independence, MO | 5.0 | 2.0 | 1328 | $1,625 | $1.22 | 45d | 1 | 1.34mi |
| 1425 S Northern Blvd Independence, MO | 3.0 | 1.5 | 1275 | $1,200 | $0.94 | 9d | 1 | 1.41mi |
Listing history 5 events
-
2026-05-21status Pending
-
2026-04-10historical Active Under Contract
-
2026-04-07status Active
-
2025-10-12status Pending
-
2025-10-11$80,000 Active
ⓘ Source: listings_history table (triggers on properties + properties_extension) + one-shot
backfill from property_details.listing_events for pre-trigger history.
Tax reassessment forecast MO · Resets to sale price
- Current annual tax
- $1,176 · $98/mo
- Projected year-2 tax
- $1,176 · $98/mo
- Expected delta
- $0/yr ($0/mo · 0.0%)
ⓘ Screening estimate from a state-policy table — verify with the county assessor before closing.
Climate risk First Street
- Flood 1/10 Low FEMA zone X (unshaded) · 0% chance over 30 yrs
- Wildfire 1/10 Low
- Heat 4/10 Moderate 7 d/yr ≥107°F today · 17 d/yr by 30 yrs out
- Wind 2/10 Low
- Air quality 3/10 Moderate 2 unhealthy d/yr today · 3 by 30 yrs out
Nearby sold comps map
Loading sold comps map…
Walkable amenities ~0.75 mi
Loading nearby amenities…
Taxation est. · year 1
- Rental income
- $18,237
- − Mortgage interest
- −$4,481
- − Property taxes
- −$1,176
- − Insurance
- −$400
- − Repairs & maintenance
- −$1,459
- − Management
- −$1,459
- − Depreciation
- −$2,327
- Taxable income
- $6,934
- Est. tax owed @ 24.0%
- −$1,664
- After-tax cash flow
- $6,132/yr
For passive investors: Depreciation is non-cash, so a rental often shows a tax loss while cash-flowing — sheltering income. Rental losses are passive: they offset passive income freely, and up to $25,000/yr can offset ordinary (W-2) income if you actively participate and your MAGI is under $100k (phasing out to $0 by $150k); unused losses carry forward. On sale, claimed depreciation is recaptured at up to 25%, and gains may owe capital-gains tax (a 1031 exchange can defer both). Figures are a year-1 estimate at your 24.0% rate — not tax advice; consult a CPA.
Schools (NCES district)
- District
- Independence 30
- NCES district ID
- 2915480
- Math proficiency
- 26% ▼ -8.00%
- Reading proficiency
- 38% ▼ -5.00%
- Median HH income
- $41,843
- Composite
- 27.04/100
- National rank
- #7054
- State rank
- #252 of 324 in MO
Livability — Independence
- Score
- 82/100
- State rank
- #10
- US rank
- #1296
Category grades
Schools grade is shown separately in the Schools card above.
Census & demographics
- Census place
- Independence, MO
- County
- Jackson County · 687,798 people
- City population
- 117,675
- Metro
- Kansas City, MO-KS
- Population (ZIP)
- 6,775
- Household income
- $47,285
- Rent vs Own
- Severe rent burden
- 330.0
Population outlook (Jackson County) Hauer SSP2
- Today (2025)
- 719,589 people
- By 2030
- 731,456 · +1.6%
- By 2040
- 746,689 · +3.8%
- By 2050
- 749,289 · +4.1%
- By 2075
- 736,227 · +2.3%
- By 2100
- 668,210 · -7.1%
Race, ethnicity, and origin ACS 2023
- Neighborhood character
- Diverse neighborhood (Simpson 0.57)
- Race & ethnicity
- White 59% Hispanic / Latino 28% Two or more races 14% Black 9% Native American 3%
- Hispanic origin (detail)
- Mexican 25%
- Common ancestry
- Italian 12% Lithuanian 3% Slovak 1%
- Foreign-born
- 12% · Canada, China
- Languages at home
- 78% English-only · Spanish 21%
Political lean MEDSL · Jackson
- 2024 margin
- D (+19.3) · D 58.9% · R 39.5% · Other 1.6%
- 2008→2024 swing
- -6.1pp toward R · 2008: 25.4pp · 2024: 19.3pp
- All cycles
- 2024: D+19.3 2020: D+22.0 2016: D+16.6 2012: D+19.0 2008: D+25.4
Not yet ingested
- Civics
- —
Market trends
- HPI YoY
- ▲ 52.69%
- Current HPI
- 347.9512
- Rent YoY
- —
- Metro
- Kansas City, MO-KS
- State GDP YoY
- ▲ 1.84%
- F500 in state
- 20
Industry mix (Fortune 500 HQ in MO)
| Industry | F500 HQs | Revenue |
|---|---|---|
| Healthcare | 1 | $163B |
|
||
| Insurance | 1 | $21B |
|
||
| Industrial Technology | 1 | $17B |
|
||
| Retail | 1 | $16B |
|
||
| Industrial Distribution | 1 | $10B |
|
||
| Utilities | 1 | $9B |
|
||
Price history
5 events — show timeline
- 2026-05-21 Pending — Heartland MLS as Distributed by MLS Grid
- 2026-04-10 Contingent — Heartland MLS as Distributed by MLS Grid
- 2026-04-07 Relisted — Heartland MLS as Distributed by MLS Grid
- 2025-10-12 Pending — Heartland MLS as Distributed by MLS Grid
- 2025-10-11 Listed $80,000 Heartland MLS as Distributed by MLS Grid
Property tax history
+4.5%/yrLatest (2025): $1,176 · -3.1% YoY. Source: county tax records.
Cash-flow waterfall
monthlySold comps — $/sqft
last 12 mo · ≤1 miLoading sold comps…