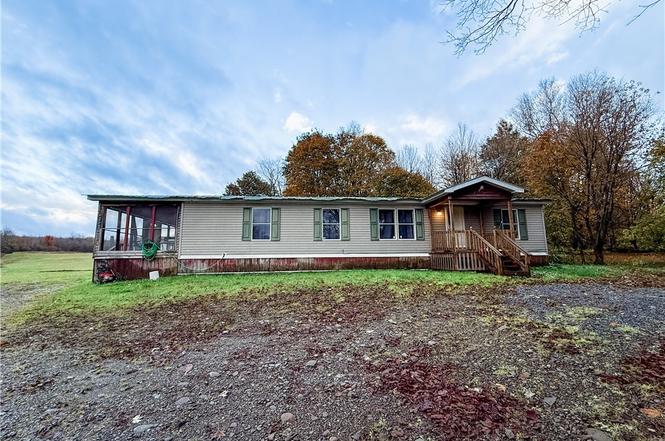
3484 County Route 22 · Altmar, NY
Flood risk 1/10 · Minimal
- FEMA flood zone
- X (unshaded)
- Chance of flooding over 30 yrs
- 0.0%
- Est. flood insurance / yr
- $507 – $1,088
Fire risk 4/10 · Minor
- Est. fire insurance / yr
- $691 – $1,283
Heat risk 1/10 · Minimal
- Hot days now (above 89°F)
- 7 days/yr
- Hot days in 30 yrs
- 16 days/yr
Wind risk 1/10 · Minimal
- Chance of severe wind over 30 yrs
- 0.0%
Air-quality risk 2/10 · Minimal
- Unhealthy air days now
- 1 days/yr
- Unhealthy air days in 30 yrs
- 2 days/yr
Risk factors via First Street. Map © Google.
Why this score? — see what drove the B+ grade
The composite is a weighted blend of 9 inputs, each scored 0–100. Each bar is that input's sub-score; the figure is the points it added to the 100-point composite (weight × sub-score).
- Cash flow +30.0/30.0
- 1% rule +10.0/10.0
- DSCR +10.0/10.0
- Appreciation +8.9/10.0
- ARV discount +7.5/15.0
- Schools +4.1/10.0
- Livability +2.9/5.0
- Rent growth +2.5/5.0
- Condition / age +2.5/5.0
$89,900
🖨 Deal sheet (PDF) 📄 Offer letter ✓ Due diligence
Listing remarks
Spacious 4-bedroom, 2-bath double-wide offering endless potential and room to make it your own! Featuring a country-style kitchen, some newer flooring throughout, and plenty of living space to work with, this home is ready for your finishing touches. Enjoy a screened-in side porch, a covered front porch perfect for relaxing, a handy little shed, and a detached 2-car garage for storage or hobbies. The property does need some TLC, but with a bit of elbow grease and cosmetic updates, it could truly shine. A diamond in the rough. Ideal for those looking to build equity, invest, or create their forever home. Great opportunity for rental income or a flip in a peaceful setting with a country feel.
Key facts
- Covered front porch
- Handy little shed
- Peaceful setting
Tags
Neighborhood map
What this means for you Summary
Snapshot
- This is a 3-bed/2.0-bath manufactured listed at $90k.
Deal economics
- At list price, monthly cash flow is $866 ($10k/yr) — positive.
- The deal already cash-flows at list — no discount required.
- Meets the 1% rule at list price ($2k rent vs $90k).
- Recommended offer: $82k (9.0% below list) — sets the bar for market timing.
- Cap rate 17.8% vs local median 3.4% in Altmar — top-decile yield for the area; either an underpriced asset or a hidden risk that comps aren't pricing in. Stress-test before assuming the spread holds.
Location & tenants
- Location reads 57/100 on livability (#1,077 in NY) — a working-class tenant base; expect higher turnover. Strengths: cost of living A+, housing A+; Watch: employment D+, health & safety D, crime F.
- Sandy Creek Central School District (rural): math 44% / reading 52% proficiency, ranked #425 of 590 in NY (top 72%) — families likely to look elsewhere, expect single-tenant / working-renter base with shorter leases.
- Zoned schools: Sandy Creek Elementary School (math 52% / reading 52%, grade C-, #988 of 2,108 statewide, top 49%, 393 students, 49% FRL); Sandy Creek Middle School (math 22% / reading 37%, grade F, #550 of 729 statewide, top 77%, 186 students, 53% FRL); Sandy Creek High School (math 95% / reading 95%, grade A+, #83 of 1,100 statewide, top 8%, 213 students, 50% FRL).
- Market conditions: 14 active listings in the ZIP; 172 units permitted in Oswego County in 2024 (27 in 5+ unit buildings).
Forward outlook
- In year one you build about $8k of equity ($622 loan paydown + $7k appreciation (7.9% local appreciation)).
- Oswego County population projected at -23% by 2050 — secular population decline; favor cash flow + early exit over multi-decade hold.
- At projected returns (7.9% appreciation + 3.0% rent growth), your $25k cash investment doubles in ~2 years — after that, you're playing with house money.
- By year 5, paydown + projected appreciation supports a ~$35k cash-out refi (75% LTV) — recoverable capital for the next deal without selling this one.
Negotiation context
- It's been on market 99 days — a 9% lower offer ($82k) is reasonable based on typical stale-listing flexibility.
Risks & watch-outs
- Watch-outs: property tax is 2.8% of price.
Questions for the listing agent
- It's been on market 99 days. Have you received any prior offers? Is the seller open to a 9% concession, seller financing, or rate buy-down credit?
- Property tax is high relative to price — has the assessment been appealed recently, and will the sale trigger a re-assessment?
- Why hasn't it sold? Are there any deal-killer items the seller is aware of (foundation, flood, title, zoning, code violations)?
- Is there a deadline driving the sale (1031 exchange, divorce, estate, relocation)? That informs how much negotiation room exists.
- Schools are F-rated, which usually means shorter tenancies and higher turnover. Who's the typical renter profile here, and what's been the actual vacancy rate?
- Crime grade is F in this area — have there been break-ins, vandalism, or insurance claims at this property in the last 3 years? What carrier currently insures it and at what premium?
- What's the average days-on-market for RENTAL listings here right now (not sales)? A rising rental-DOM trend means longer vacancies and softer asking-rent achievability than the comps imply.
- What's the recent tenant-quality profile in this submarket — average credit score on applications, eviction rate, late-payment / NSF rate, and stable-employment percentage? A property-management company in the area should have these aggregated.
- How much new for-sale + rental construction is in the pipeline within 1–3 miles? Heavy new supply typically softens prices + rents 12–24 months out; constrained supply supports both.
Investment metrics
- 1% rule
- 2.23% ✓
- Cap rate
- 17.85%
- Cash-on-cash
- 41.27%
- DSCR
- 2.84
- GRM
- 3.7
CMA / ARV
No comps found within radius.
Projected returns pro-forma
7.87% appreciation · 3.0% rent growth · sell at horizon
- IRR
- 53.4%
- Equity multiple
- 4.64×
- Total profit
- $91,512
- Equity at exit
- $67,499
- IRR
- 48.7%
- Equity multiple
- 9.93×
- Total profit
- $224,701
- Equity at exit
- $133,228
Cash invested: $25,172 (down + closing). Projections, not guarantees.
Landlord ↔ Tenant lean methodology
- Overall (STATE)
- 15 Strongly Tenant-Friendly
- State New York
- 15 Strongly Tenant-Friendly · D+10
- County
- — inherits STATE
- City
- — inherits STATE
ZIP-level market 13144
- Home prices YoY
- 2.9%
- Active inventory
- 14
- Price-to-rent
- 3.7×
Monthly cashflow live
- Estimated rent
- $2,003 medium interval (Pro) →
- Mortgage (P&I)
- −$471
- Tax from tax record
- −$207 /mo · $2,488/yr
- Insurance
- −$37
- HOA
- −$0
- Vacancy / Maint / Mgmt
- −$421
- Net cashflow
- $866
Break-even live
Sensitivity live
| Price | -10% $917 | -5% $891 | +0% $866 | +5% $840 | +10% $815 |
|---|---|---|---|---|---|
| Rent | -10% $708 | -5% $787 | +0% $866 | +5% $945 | +10% $1,024 |
| Rate | -1.0pp $911 | -0.5pp $889 | base $866 | +0.5pp $842 | +1.0pp $819 |
UW: 25.0% down · 7.5% · 30yr · 1.5% tax · 5.0% vac · 8.0% maint · 8.0% mgmt
Financing live
Cash to close
- Down payment
- $22,475
- Closing costs
- $2,697
- Reserves months
- —
- Total cash needed
- —
Loan-product check · same deal, 3 products live
Conventional
25% down · 7.5% · 30yr
- Down + closing
- —
- Monthly P&I
- —
- Monthly cashflow
- —
- DSCR
- —
- Eligible?
- —
Personal DTI + credit; lowest rate.
DSCR
20% down · 8.5% · 30yr
- Down + closing
- —
- Monthly P&I
- —
- Monthly cashflow
- —
- DSCR
- —
- Eligible?
- —
No personal income docs; deal must DSCR.
Hard money
10% down · 12.0% · 12mo
- Down + closing
- —
- Monthly P&I
- —
- Monthly cashflow
- —
- DSCR
- —
- Eligible?
- —
Short-term bridge; refi at stabilization.
Listing history 6 events
-
2026-02-10status Pending
-
2026-02-05price $89,900
-
2026-01-13price $94,900
-
2025-11-25price $99,900
-
2025-11-16price $105,000
-
2025-10-30$114,900 Active
ⓘ Source: listings_history table (triggers on properties + properties_extension) + one-shot
backfill from property_details.listing_events for pre-trigger history.
Tax reassessment forecast NY · Partial reset (capped growth)
- Current annual tax
- $2,488 · $207/mo
- Projected year-2 tax
- $2,488 · $207/mo
- Expected delta
- $0/yr ($0/mo · 0.0%)
ⓘ Screening estimate from a state-policy table — verify with the county assessor before closing.
Climate risk First Street
- Flood 1/10 Low FEMA zone X (unshaded) · 0% chance over 30 yrs
- Wildfire 4/10 Moderate
- Heat 1/10 Low 7 d/yr ≥89°F today · 16 d/yr by 30 yrs out
- Wind 1/10 Low 0% chance of damaging wind over 30 yrs
- Air quality 2/10 Low 1 unhealthy d/yr today · 2 by 30 yrs out
Nearby sold comps map
Loading sold comps map…
Walkable amenities ~0.75 mi
Loading nearby amenities…
Taxation est. · year 1
- Rental income
- $24,030
- − Mortgage interest
- −$5,036
- − Property taxes
- −$2,488
- − Insurance
- −$450
- − Repairs & maintenance
- −$1,922
- − Management
- −$1,922
- − Depreciation
- −$2,615
- Taxable income
- $9,597
- Est. tax owed @ 24.0%
- −$2,303
- After-tax cash flow
- $8,086/yr
For passive investors: Depreciation is non-cash, so a rental often shows a tax loss while cash-flowing — sheltering income. Rental losses are passive: they offset passive income freely, and up to $25,000/yr can offset ordinary (W-2) income if you actively participate and your MAGI is under $100k (phasing out to $0 by $150k); unused losses carry forward. On sale, claimed depreciation is recaptured at up to 25%, and gains may owe capital-gains tax (a 1031 exchange can defer both). Figures are a year-1 estimate at your 24.0% rate — not tax advice; consult a CPA.
Schools (NCES district)
- District
- Sandy Creek Central School District
- NCES district ID
- 3625650
- Math proficiency
- 44% ▼ -8.00%
- Reading proficiency
- 52% ▲ 8.00%
- Median HH income
- $46,647
- Composite
- 40.78/100
- National rank
- #3642
- State rank
- #425 of 590 in NY
Livability — Altmar
- Score
- 57/100
- State rank
- #1077
- US rank
- #21658
Category grades
Schools grade is shown separately in the Schools card above.
Census & demographics
- Population (ZIP)
- 1,105
Population outlook (Oswego County) Hauer SSP2
- Today (2025)
- 114,465 people
- By 2030
- 109,968 · -3.9%
- By 2040
- 99,205 · -13.3%
- By 2050
- 87,979 · -23.1%
- By 2075
- 65,100 · -43.1%
- By 2100
- 47,117 · -58.8%
Race, ethnicity, and origin ACS 2023
- Neighborhood character
- Predominantly White (92%)
- Race & ethnicity
- White 92% Two or more races 4% Black 2% Pacific Islander 1%
- Common ancestry
- Lithuanian 5% Romanian 5% Slovak 1%
- Foreign-born
- 3% · Vietnam, Canada
- Languages at home
- 97% English-only · Other Asian/Pacific 1% German/W. Germanic 1%
Political lean MEDSL · Oswego
- 2024 margin
- Strong R (+24.2) · D 37.9% · R 62.1%
- 2008→2024 swing
- -26.6pp toward R · 2008: 2.5pp · 2024: -24.2pp
- All cycles
- 2024: R+24.2 2020: R+20.2 2016: R+23.2 2012: D+7.9 2008: D+2.5
Not yet ingested
- Civics
- —
Market trends
- HPI YoY
- ▲ 7.87%
- Current HPI
- 275.1966
- Rent YoY
- —
- Metro
- —
- State GDP YoY
- ▲ 2.60%
- F500 in state
- 92
Industry mix (Fortune 500 HQ in NY)
| Industry | F500 HQs | Revenue |
|---|---|---|
| Financial Services | 10 | $950B |
|
||
| Consumer Goods | 9 | $162B |
|
||
| Insurance | 4 | $225B |
|
||
| Telecommunications | 2 | $144B |
|
||
| Pharmaceuticals | 2 | $112B |
|
||
| Media / Entertainment | 2 | $69B |
|
||
Price history
-21.8% since first listed6 events — show timeline
- 2026-02-10 Pending — CNYIS
- 2026-02-05 Price Changed $89,900 CNYIS
- 2026-01-13 Price Changed $94,900 CNYIS
- 2025-11-25 Price Changed $99,900 CNYIS
- 2025-11-16 Price Changed $105,000 CNYIS
- 2025-10-30 Listed $114,900 CNYIS
Property tax history
+1.2%/yrLatest (2025): $2,488 · -1.7% YoY. Source: county tax records.
Cash-flow waterfall
monthlySold comps — $/sqft
last 12 mo · ≤1 miLoading sold comps…