 Duplex
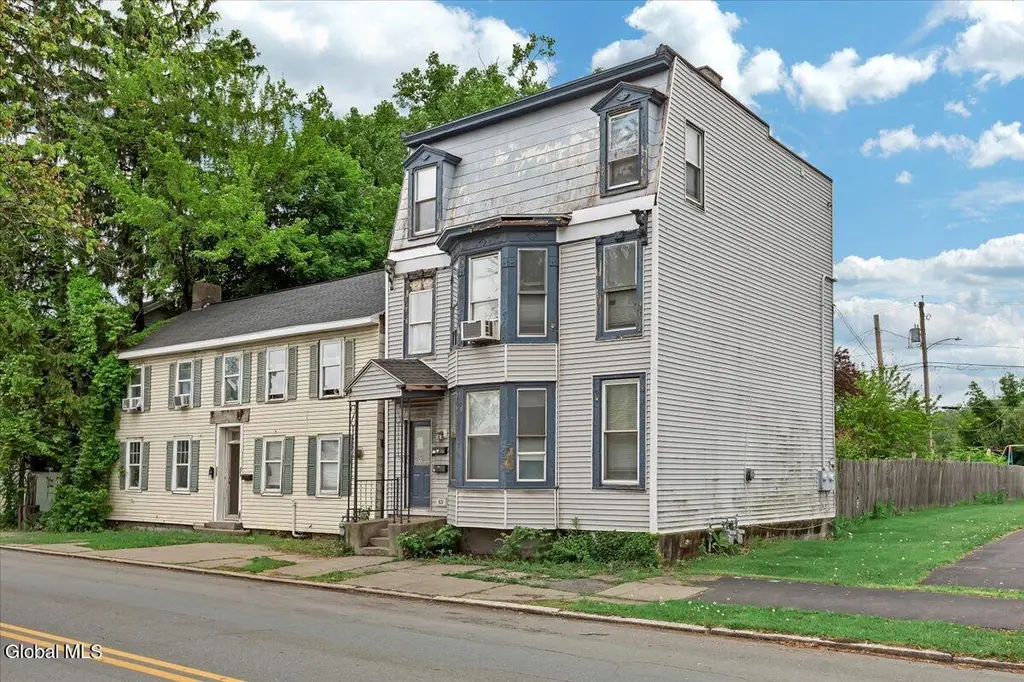
715 2nd Ave · Troy, NY
Flood risk 9/10 · Severe
- FEMA flood zone
- AE
- Chance of flooding over 30 yrs
- 0.99%
- Est. flood insurance / yr
- $2,026 – $9,024
Fire risk 3/10 · Minor
- Est. fire insurance / yr
- $691 – $1,283
Heat risk 4/10 · Minor
- Hot days now (above 95°F)
- 7 days/yr
- Hot days in 30 yrs
- 17 days/yr
Wind risk 3/10 · Minor
- Chance of severe wind over 30 yrs
- 6.0%
Air-quality risk 2/10 · Minimal
- Unhealthy air days now
- 0 days/yr
- Unhealthy air days in 30 yrs
- 1 days/yr
Risk factors via First Street. Map © Google.
Why this score? — see what drove the B+ grade
The composite is a weighted blend of 9 inputs, each scored 0–100. Each bar is that input's sub-score; the figure is the points it added to the 100-point composite (weight × sub-score).
- Cash flow +30.0/30.0
- ARV discount +13.9/15.0
- 1% rule +10.0/10.0
- DSCR +10.0/10.0
- Livability +4.0/5.0
- Schools +2.8/10.0
- Rent growth +2.5/5.0
- Condition / age +2.5/5.0
- Appreciation +0.0/10.0
$199,900
🖨 Deal sheet 📄 Offer letter ✓ Due diligence
Multi-family units
County records classify this as Multi-Family (2-4 Unit). Listing-text estimate: 2 units. confirmed
Listing remarks MLS
Unique, well maintained two family, on busline, close to shopping & schools! 2nd floor is multi-level, flood insurance is required. Very Good Condition
Key facts
- Multi level layout
- 3,049 sq ft lot
- Built 1920
Tags
Property features AI
Finance
- Financial info: Two-unit property
Exterior
- Utilities: Public water; Public sewer
- Home design: Duplex; Vinyl siding
- Construction: Rubber roof
- Exterior features: Deck; Waterfront property on the Hudson River; Level lot
Interior
- Bedrooms: Unit 1: 1 bedroom; Unit 2: 2 bedrooms
- Flooring: Vinyl flooring; Hardwood flooring
- Bathrooms: Two full bathrooms and one half bathroom total; Full baths located on 1st and 3rd levels; half bath on 2nd level
- Heating & cooling: Baseboard heating; Natural gas
- Interior features: Built-in features; Full, unfinished basement with interior entry and Bilco doors; Gas fireplace in the living room
Neighborhood map
What this means for you Summary
Snapshot
- This is a 1×1.0bd/1.5ba + 1×2.0bd/1.5ba units multifamily listed at $200k.
Deal economics
- At list price, monthly cash flow is $713 ($9k/yr) — positive. Per door: $356/mo.
- The deal already cash-flows at list — no discount required.
- Meets the 1% rule at list price ($3k rent vs $200k).
- Recommended offer: $197k (1.5% below list) — sets the bar for market timing.
- Cap rate 13.3% vs local median 5.3% in Troy — top-decile yield for the area; either an underpriced asset or a hidden risk that comps aren't pricing in. Stress-test before assuming the spread holds.
Location & tenants
- Location reads 81/100 on livability (#88 in NY, #1,350 nationally) — a professional / high-income tenant draw. Strengths: amenities A+, commute A+, housing A+; Watch: schools C-, employment C-, crime F.
- Lansingburgh Central School District (urban): math 31% / reading 35% proficiency, ranked #566 of 590 in NY (top 96%) — families likely to look elsewhere, expect single-tenant / working-renter base with shorter leases.
- Market conditions: 75 active listings in the ZIP; 5 comparable units currently listed for rent nearby; rentals at typical pace (median 15d on market — plan ~3-4 weeks tenant-placement turnaround); 405 units permitted in Rensselaer County in 2024 (224 in 5+ unit buildings).
Forward outlook
- Local home prices are declining (-3.0%/yr); year-one equity from $1k of loan paydown is wiped out by about $6k of value loss. Plan a longer hold.
- Rensselaer County population projected to shrink 6% by 2050 — rents likely to lag national; underwrite the cash flow, not the appreciation.
- At projected returns (-3.0% appreciation + 3.0% rent growth), your $56k cash investment doubles in ~8 years — after that, you're playing with house money.
Negotiation context
- It's been on market 23 days — a 2% lower offer ($197k) is reasonable based on typical stale-listing flexibility.
- 4 sale attempts since 6y ago with the ask held roughly flat each time — persistent listings suggest the price (not the market) is what's stuck; bring a comps-based counter.
- Current owner paid $128k; list at $200k implies a 56% gain — meaningful room to come down on a strong offer.
Risks & watch-outs
- Watch-outs: flood insurance adds $460/mo; built in 1920 — expect roof / HVAC / electrical / plumbing capex.
- Climate carrying-cost: in FEMA flood zone AE (mandatory federal flood insurance) — expect insurance premiums to compound above CPI over the hold.
Questions for the listing agent
- Can we see the unit-by-unit rent roll, current vacancy, and any below-market leases? What's the average tenancy length?
- What capital expenditures (roof, boiler, parking lot, exteriors) have been made in the last 5 years, and what's planned in the next 2?
- Built in 1920 — when were the roof, HVAC, electrical panel, plumbing, and water heater last replaced?
- What's the actual annual flood-insurance premium (NFIP or private), and is the property in a SFHA with mandatory coverage?
- Is there a deadline driving the sale (1031 exchange, divorce, estate, relocation)? That informs how much negotiation room exists.
- Crime grade is F in this area — have there been break-ins, vandalism, or insurance claims at this property in the last 3 years? What carrier currently insures it and at what premium?
- What's the average days-on-market for RENTAL listings here right now (not sales)? A rising rental-DOM trend means longer vacancies and softer asking-rent achievability than the comps imply.
- What's the recent tenant-quality profile in this submarket — average credit score on applications, eviction rate, late-payment / NSF rate, and stable-employment percentage? A property-management company in the area should have these aggregated.
- How much new apartment / multifamily construction is in the pipeline within 1–3 miles? Heavy new supply (>2% of stock underway) typically softens rents 12–24 months out; light construction supports rent growth.
Investment metrics
- 1% rule
- 1.71% ✓
- Cap rate
- 13.34%
- Cash-on-cash
- 25.15%
- DSCR
- 2.12
- GRM
- 4.9
CMA / ARV
- ARV (on-the-fly)
- $233,192
- Comps found
- 10
Show comp detail 10 sales within ~0.75 mi
| Address | Dist | Beds/Ba | Sqft | Sold | Price | $/sf | Match |
|---|---|---|---|---|---|---|---|
| 623 5th Ave | 0.31mi | 4/2.0 (+1) | 2,200 (-3%) | 8mo | $125,000 | $57 | 70 |
| 902 3rd Ave | 0.52mi | 4/2.0 (+1) | 2,244 (-1%) | 1mo | $231,540 | $103 | 69 |
| 782 3rd Ave | 0.20mi | 3/2.0 | 2,160 (-5%) | 18mo | $200,000 | $93 | 68 |
| 799 5th Ave | 0.30mi | 4/2.0 (+1) | 2,112 (-7%) | 6mo | $226,000 | $107 | 65 |
| 847 5th Ave | 0.41mi | 4/2.0 (+1) | 2,052 (-9%) | 1mo | $245,000 | $119 | 60 |
| 69 Heartt Ave | 0.72mi | 4/2.0 (+1) | 2,300 (+2%) | 3mo | $278,000 | $121 | 56 |
| 10 Northern Dr | 0.62mi | 4/2.0 (+1) | 2,168 (-4%) | 10mo | $145,000 | $67 | 50 |
| 617-619 1st Ave | 0.28mi | 4/3.0 (+1) | 2,016 (-11%) | 17mo | $267,500 | $133 | 46 |
| 878 3rd Ave | 0.45mi | 4/2.0 (+1) | 2,042 (-10%) | 14mo | $165,000 | $81 | 46 |
| 2 4th St | 0.66mi | 4/2.0 (+1) | 2,576 (+14%) | 16mo | $243,999 | $95 | 28 |
Match score weights: distance 35% · size 25% · config 20% · recency 20%. Top-matched comps best support the ARV.
Projected returns pro-forma
-3.0% appreciation · 3.0% rent growth · sell at horizon
- IRR
- 6.2%
- Equity multiple
- 1.24×
- Total profit
- $13,433
- Equity at exit
- $29,806
- IRR
- 15.7%
- Equity multiple
- 2.28×
- Total profit
- $71,890
- Equity at exit
- $17,284
Cash invested: $55,972 (down + closing). Projections, not guarantees.
Landlord ↔ Tenant lean methodology
- Overall (STATE)
- 15 Strongly Tenant-Friendly
- State New York
- 15 Strongly Tenant-Friendly · D+10
- County
- — inherits STATE
- City
- — inherits STATE
ZIP-level market 12182
- Home prices YoY
- -15.6%
- Active inventory
- 75
- Price-to-rent
- 9.4×
Monthly cashflow live
- Estimated rent
- $3,424 high interval (Pro) →
- Mortgage (P&I)
- −$1,048
- Tax from tax record
- −$400 /mo · $4,802/yr
- Insurance
- −$83
- Flood insurance flood zone
- −$460 /mo · $5,525/yr
- HOA
- −$0
- Vacancy / Maint / Mgmt
- −$719
- Net cashflow
- $713
Break-even live
2-unit breakdown (identical units grouped — click to expand)
| Units | Beds | Baths | Est. rent |
|---|---|---|---|
| 1× unit | 1.0 | 1.5 | $1,774 |
| 1× unit | 2.0 | 1.5 | $1,649 |
| Total (2 units) | $3,424 | ||
UW: 25.0% down · 7.5% · 30yr · 1.5% tax · 5.0% vac · 8.0% maint · 8.0% mgmt
Financing live
Cash to close
- Down payment
- $49,975
- Closing costs
- $5,997
- Reserves months
- —
- Total cash needed
- —
Loan-product check · same deal, 3 products live
Conventional
25% down · 7.5% · 30yr
- Down + closing
- —
- Monthly P&I
- —
- Monthly cashflow
- —
- DSCR
- —
- Eligible?
- —
Personal DTI + credit; lowest rate.
DSCR
20% down · 8.5% · 30yr
- Down + closing
- —
- Monthly P&I
- —
- Monthly cashflow
- —
- DSCR
- —
- Eligible?
- —
No personal income docs; deal must DSCR.
Hard money
10% down · 12.0% · 12mo
- Down + closing
- —
- Monthly P&I
- —
- Monthly cashflow
- —
- DSCR
- —
- Eligible?
- —
Short-term bridge; refi at stabilization.
Rent comps 5 comps
| Address | Beds | Baths | Sqft | Rent | $/sqft | DOM | Units | Dist |
|---|---|---|---|---|---|---|---|---|
| 750 2nd Ave Troy, NY | 1.0–3.0 | 1.0–1.5 | 1185 | $1,711 | $1.44 | 14d | 1 | 0.10mi |
| 100 Waters View Cir Cohoes, NY | 1.0–2.0 | 1.0–2.5 | 1281 | $2,413 | $1.88 | 14d | 13 | 0.44mi |
| 53 Park Ave Cohoes, NY | 3.0 | 1.0 | 1875 | $1,600 | $0.85 | 14d | 1 | 0.71mi |
| 192 Saratoga St Cohoes, NY | 1.0–3.0 | 1.0–3.0 | 1157 | $2,600 | $2.25 | 14d | 4 | 1.33mi |
| 12 White St Cohoes, NY | 3.0 | 2.0 | 1790 | $2,895 | $1.62 | 19d | 1 | 1.40mi |
Listing history 27 events
-
2026-06-18days on market $199,900 Active 23 DOM
-
2026-06-17days on market $199,900 Active 22 DOM
-
2026-06-16days on market $199,900 Active 21 DOM
-
2026-06-15days on market $199,900 Active 20 DOM
-
2026-06-14days on market $199,900 Active 18 DOM
-
2026-06-10days on market $199,900 Active 15 DOM
-
2026-06-09days on market $199,900 Active 14 DOM
-
2026-06-08days on market $199,900 Active 13 DOM
-
2026-06-07days on market $199,900 Active 12 DOM
-
2026-06-05days on market $199,900 Active 9 DOM
-
2026-06-03days on market $199,900 Active 8 DOM
-
2026-06-02days on market $199,900 Active 7 DOM
-
2026-06-01days on market $199,900 Active 6 DOM
-
2026-05-31days on market $199,900 Active 5 DOM
-
2026-05-31days on market $199,900 Active 4 DOM
-
2026-05-26$199,900 Active
-
2022-02-09soldstatus $128,000
-
2021-12-14status Pending 155-char remark
Show marketing remark (155 chars)
Unique, well maintained two family, on busline, close to shopping & schools! 2nd floor is multi-level, flood insurance is required. Very Good Condition
-
2021-08-30status Pend (Under Cntr) 155-char remark
Show marketing remark (155 chars)
Unique, well maintained two family, on busline, close to shopping & schools! 2nd floor is multi-level, flood insurance is required. Very Good Condition
-
2021-08-28price $128,000 155-char remark
Show marketing remark (155 chars)
Unique, well maintained two family, on busline, close to shopping & schools! 2nd floor is multi-level, flood insurance is required. Very Good Condition
-
2021-08-16$132,500 New 155-char remark
Show marketing remark (155 chars)
Unique, well maintained two family, on busline, close to shopping & schools! 2nd floor is multi-level, flood insurance is required. Very Good Condition
-
2021-02-13historical
-
2021-02-13status Back On Market
-
2020-12-15historical
-
2020-10-11$126,000 New
-
2005-09-09soldstatus $69,000
-
1993-07-23soldstatus $61,795
ⓘ Source: listings_history table (triggers on properties + properties_extension) + one-shot
backfill from property_details.listing_events for pre-trigger history.
Tax reassessment forecast NY · Partial reset (capped growth)
- Current annual tax
- $4,802 · $400/mo
- Projected year-2 tax
- $4,802 · $400/mo
- Expected delta
- $0/yr ($0/mo · 0.0%)
ⓘ Screening estimate from a state-policy table — verify with the county assessor before closing.
Climate risk First Street
- Flood 9/10 Extreme FEMA zone AE · 99% chance over 30 yrs
- Wildfire 3/10 Moderate
- Heat 4/10 Moderate 7 d/yr ≥95°F today · 17 d/yr by 30 yrs out
- Wind 3/10 Moderate 6% chance of damaging wind over 30 yrs
- Air quality 2/10 Low 0 unhealthy d/yr today · 1 by 30 yrs out
Nearby sold comps map
Loading sold comps map…
Walkable amenities ~0.75 mi
Loading nearby amenities…
Taxation est. · year 1
- Rental income
- $41,088
- − Mortgage interest
- −$11,198
- − Property taxes
- −$4,802
- − Insurance
- −$6,524
- − Repairs & maintenance
- −$3,287
- − Management
- −$3,287
- − Depreciation
- −$5,815
- Taxable income
- $6,175
- Est. tax owed @ 24.0%
- −$1,482
- After-tax cash flow
- $7,072/yr
For passive investors: Depreciation is non-cash, so a rental often shows a tax loss while cash-flowing — sheltering income. Rental losses are passive: they offset passive income freely, and up to $25,000/yr can offset ordinary (W-2) income if you actively participate and your MAGI is under $100k (phasing out to $0 by $150k); unused losses carry forward. On sale, claimed depreciation is recaptured at up to 25%, and gains may owe capital-gains tax (a 1031 exchange can defer both). Figures are a year-1 estimate at your 24.0% rate — not tax advice; consult a CPA.
Schools (NCES district)
- District
- Lansingburgh Central School District
- NCES district ID
- 3616740
- Math proficiency
- 31% ▼ -7.00%
- Reading proficiency
- 35% ▼ -6.00%
- Median HH income
- $44,807
- Composite
- 28.19/100
- National rank
- #6810
- State rank
- #566 of 590 in NY
Livability — Troy
- Score
- 81/100
- State rank
- #88
- US rank
- #1350
Category grades
Schools grade is shown separately in the Schools card above.
Census & demographics
- Census place
- Troy, NY
- City population
- 53,479
- Population (ZIP)
- 14,273
Population outlook (Rensselaer County) Hauer SSP2
- Today (2025)
- 162,400 people
- By 2030
- 161,746 · -0.4%
- By 2040
- 158,095 · -2.7%
- By 2050
- 152,966 · -5.8%
- By 2075
- 140,767 · -13.3%
- By 2100
- 124,727 · -23.2%
Race, ethnicity, and origin ACS 2023
- Neighborhood character
- Predominantly White (70%)
- Race & ethnicity
- White 70% Black 14% Two or more races 12% Hispanic / Latino 7%
- Hispanic origin (detail)
- Puerto Rican 6%
- Common ancestry
- Lithuanian 7% Romanian 3% Iranian 1%
- Foreign-born
- 3% · Canada, Jamaica
- Languages at home
- 94% English-only · Spanish 4% Other Indo-European 1%
Political lean MEDSL · Rensselaer
- 2024 margin
- Toss-up / Even · D 50.7% · R 49.3%
- 2008→2024 swing
- -8.0pp toward R · 2008: 9.3pp · 2024: 1.4pp
- All cycles
- 2024: D+1.4 2020: D+5.6 2016: R+2.9 2012: D+11.8 2008: D+9.3
Not yet ingested
- Civics
- —
Market trends
- HPI YoY
- ▼ -50.58%
- Current HPI
- 273.5758
- Rent YoY
- —
- Metro
- —
- State GDP YoY
- ▲ 2.60%
- F500 in state
- 92
Industry mix (Fortune 500 HQ in NY)
| Industry | F500 HQs | Revenue |
|---|---|---|
| Financial Services | 10 | $950B |
|
||
| Consumer Goods | 9 | $162B |
|
||
| Insurance | 4 | $225B |
|
||
| Telecommunications | 2 | $144B |
|
||
| Pharmaceuticals | 2 | $112B |
|
||
| Media / Entertainment | 2 | $69B |
|
||
Price history
+223.5% since first listed12 events — show timeline
- 2026-05-26 Listed $199,900 Global MLS
- 2022-02-09 Sold (Public Records) $128,000 Public Records
- 2021-12-14 Pending — Global MLS
- 2021-08-30 Pending — Global MLS
- 2021-08-28 Price Changed $128,000 Global MLS
- 2021-08-16 Listed $132,500 Global MLS
- 2021-02-13 Listing Removed — Global MLS
- 2021-02-13 Relisted — Global MLS
- 2020-12-15 Listing Removed — Global MLS
- 2020-10-11 Listed $126,000 Global MLS
- 2005-09-09 Sold (Public Records) $69,000 Public Records
- 1993-07-23 Sold (Public Records) $61,795 Public Records
Property tax history
+17.4%/yrLatest (2025): $4,802 · +22.2% YoY. Source: county tax records.
Cash-flow waterfall
monthlySold comps — $/sqft
last 12 mo · ≤1 miLoading sold comps…