 Duplex
3425 Boller Ave · New York, NY
Flood risk 1/10 · Minimal
- FEMA flood zone
- X (unshaded)
- Chance of flooding over 30 yrs
- 0.0%
- Est. flood insurance / yr
- $507 – $1,088
Fire risk 1/10 · Minimal
- Est. fire insurance / yr
- $691 – $1,283
Heat risk 6/10 · Moderate
- Hot days now (above 99°F)
- 7 days/yr
- Hot days in 30 yrs
- 14 days/yr
Wind risk 6/10 · Moderate
- Chance of severe wind over 30 yrs
- 27.0%
Air-quality risk 5/10 · Moderate
- Unhealthy air days now
- 6 days/yr
- Unhealthy air days in 30 yrs
- 8 days/yr
Risk factors via First Street. Map © Google.
Why this score? — see what drove the D+ grade
The composite is a weighted blend of 9 inputs, each scored 0–100. Each bar is that input's sub-score; the figure is the points it added to the 100-point composite (weight × sub-score).
- Appreciation +10.0/10.0
- ARV discount +9.4/15.0
- Cash flow +8.4/30.0
- Schools +5.0/10.0
- Livability +3.8/5.0
- Rent growth +2.5/5.0
- Condition / age +2.5/5.0
- DSCR +2.3/10.0
- 1% rule +2.0/10.0
$989,900
🖨 Deal sheet (PDF) 📄 Offer letter ✓ Due diligence
Multi-family units
County records classify this as Multi-Family (2-4 Unit). Listing-text estimate: 2 units. confirmed
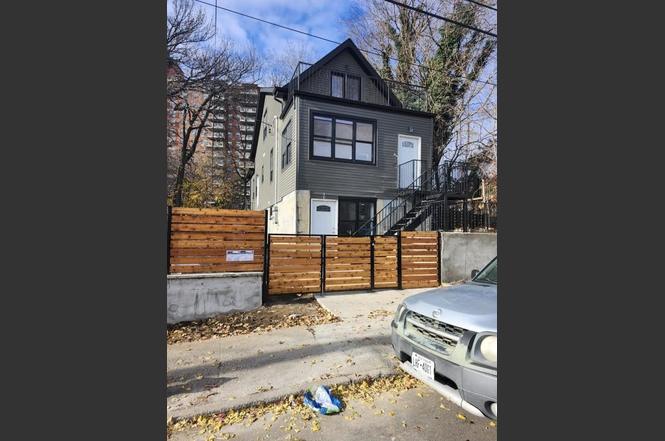
Listing remarks
Welcome to this beautifully renovated two-family home, offering modern upgrades, spacious living, and incredible investment potential! Perfect for homeowners seeking extra rental income or investors looking for a turnkey property. Completely Renovated "Brand-new kitchens, Air Conditioning, bathrooms, flooring, electrical and plumbing. Two Spacious Units with open-concept layouts and abundant natural light. Modern Kitchens" Sleek cabinetry, quartz countertops, stainless steel appliances and stylish backsplashes. Updated Bathrooms" Contemporary finishes with high-end fixtures, elegant tile work and spa-like features. Separate Utilities" Independent heating, cooling and ele
Key facts
- Air conditioning
- Modern upgrades
- Updated bathrooms
Tags
Neighborhood map
What this means for you Summary
Snapshot
- This is a 2 × 3-bed/2.0-bath units multifamily listed at $990k.
Deal economics
- At list price, monthly cash flow is $-884 ($-11k/yr) — negative. Per door: $-442/mo.
- To cash-flow at today's rent, offer at most $834k (15.8% below list).
- To meet the 1% rule (rent ≥ 1% of price), the offer needs to be $689k (30.4% below list).
- Recommended offer: $689k (30.4% below list) — sets the bar for 1% rule.
- Cap rate 5.2% vs local median 2.6% in New York — top-decile yield for the area; either an underpriced asset or a hidden risk that comps aren't pricing in. Stress-test before assuming the spread holds.
Location & tenants
- Location reads 75/100 on livability (#268 in NY, #4,188 nationally) — a middle-class / working-renter tenant base. Strengths: amenities A+, commute A+, health & safety A; Watch: crime F, cost of living F.
- Zoned schools: Elm Tree Elementary School (math 27% / reading 52%, grade F, #1,444 of 2,108 statewide, top 71%, 806 students, 94% FRL); Jhs 383 Philippa Schuyler (math 32% / reading 67%, grade C, #280 of 729 statewide, top 40%, 822 students, 85% FRL); Midwood High School (math 94% / reading 96%, grade A+, #83 of 1,100 statewide, top 8%, 4,062 students, 73% FRL).
- Market conditions: 8 active listings in the ZIP; 1 comparable units currently listed for rent nearby; 6,929 units permitted in Bronx County in 2024 (6,829 in 5+ unit buildings).
Forward outlook
- In year one you build about $106k of equity ($7k loan paydown + $99k appreciation (10.0% local appreciation)).
- Bronx County population projected at +21% by 2050 — long-run rental-demand tailwind backs the buy-and-hold thesis.
- By year 2, paydown + projected appreciation supports a ~$170k cash-out refi (75% LTV) — recoverable capital for the next deal without selling this one.
Negotiation context
- It's been on market 120 days — a 9% lower offer ($901k) is reasonable based on typical stale-listing flexibility.
- 4 sale attempts since 3y ago with the ask held roughly flat each time — persistent listings suggest the price (not the market) is what's stuck; bring a comps-based counter.
Risks & watch-outs
- Watch-outs: built in 1935 — expect roof / HVAC / electrical / plumbing capex.
- Climate carrying-cost: major wind risk, 27% chance of damaging wind over 30y; extreme-heat days projected 7→14/yr by 2055 (HVAC capex compounding) — expect insurance premiums to compound above CPI over the hold.
Questions for the listing agent
- What do current leases actually rent for vs. the listed asking? Can we see a recent rent roll and the last 12 months of T-12 income?
- It's been on market 120 days. Have you received any prior offers? Is the seller open to a 30% concession, seller financing, or rate buy-down credit?
- Can we see the unit-by-unit rent roll, current vacancy, and any below-market leases? What's the average tenancy length?
- What capital expenditures (roof, boiler, parking lot, exteriors) have been made in the last 5 years, and what's planned in the next 2?
- Built in 1935 — when were the roof, HVAC, electrical panel, plumbing, and water heater last replaced?
- Why hasn't it sold? Are there any deal-killer items the seller is aware of (foundation, flood, title, zoning, code violations)?
- Is there a deadline driving the sale (1031 exchange, divorce, estate, relocation)? That informs how much negotiation room exists.
- Schools are B-rated — typically a magnet for longer-tenancy family renters. What's the average tenant stay here, and is there a school-zone premium baked into asking?
- Crime grade is F in this area — have there been break-ins, vandalism, or insurance claims at this property in the last 3 years? What carrier currently insures it and at what premium?
- The area grade is low — what's the realistic commute time and amenity access for the typical tenant pool here? Any planned neighborhood developments (good or bad) we should know about?
- What's the average days-on-market for RENTAL listings here right now (not sales)? A rising rental-DOM trend means longer vacancies and softer asking-rent achievability than the comps imply.
- What's the recent tenant-quality profile in this submarket — average credit score on applications, eviction rate, late-payment / NSF rate, and stable-employment percentage? A property-management company in the area should have these aggregated.
- How much new apartment / multifamily construction is in the pipeline within 1–3 miles? Heavy new supply (>2% of stock underway) typically softens rents 12–24 months out; light construction supports rent growth.
Investment metrics
- 1% rule
- 0.70% ✗
- Cap rate
- 5.22%
- Cash-on-cash
- -3.83%
- DSCR
- 0.83
- GRM
- 12.0
CMA / ARV
- ARV (on-the-fly)
- $1,034,096
- Comps found
- 12
Show comp detail 12 sales within ~0.75 mi
| Address | Dist | Beds/Ba | Sqft | Sold | Price | $/sf | Match |
|---|---|---|---|---|---|---|---|
| 1461 E 233rd St | 0.63mi | 6/2.0 | 2,695 (+2%) | 1mo | $950,000 | $353 | 58 |
| 3653 Marolla Pl | 0.28mi | 6/4.0 | 2,352 (-11%) | 17mo | $995,000 | $423 | 55 |
| 3613 Marolla Pl | 0.25mi | 6/2.0 | 2,800 (+6%) | 19mo | $800,000 | $286 | 54 |
| 3106 Eastchester Rd | 0.74mi | 5/3.0 (-1) | 2,717 (+3%) | 9mo | $920,000 | $339 | 44 |
| 3442-3444 Grace Ave | 0.24mi | 5/2.0 (-1) | 2,319 (-12%) | 15mo | $600,000 | $259 | 43 |
| 3665 Varian Ave | 0.41mi | 5/3.0 (-1) | 2,270 (-14%) | 8mo | $910,100 | $401 | 42 |
| 1338 E 224th St #3 | 0.38mi | 7/3.0 (+1) | 2,968 (+12%) | 14mo | $815,000 | $275 | 40 |
| 3919 Murdock Ave | 0.64mi | 7/5.0 (+1) | 2,300 (-13%) | 7mo | $1,150,000 | $500 | 34 |
| 3661 Varian Ave | 0.41mi | 5/3.5 (-1) | 2,270 (-14%) | 21mo | $965,000 | $425 | 33 |
| 1167 E 223rd St | 0.65mi | 6/4.0 | 2,300 (-13%) | 21mo | $999,999 | $435 | 31 |
| 3495 Kingsland Ave | 0.55mi | 5/2.0 (-1) | 2,256 (-14%) | 16mo | $884,000 | $392 | 24 |
| 1119 E 224th St | 0.73mi | 7/5.0 (+1) | 3,000 (+14%) | 17mo | $850,000 | $283 | 20 |
Match score weights: distance 35% · size 25% · config 20% · recency 20%. Top-matched comps best support the ARV.
Projected returns pro-forma
10.0% appreciation · 3.0% rent growth · sell at horizon
- IRR
- 21.5%
- Equity multiple
- 2.74×
- Total profit
- $482,622
- Equity at exit
- $891,780
- IRR
- 19.4%
- Equity multiple
- 6.29×
- Total profit
- $1,465,092
- Equity at exit
- $1,923,158
Cash invested: $277,172 (down + closing). Projections, not guarantees.
Landlord ↔ Tenant lean methodology
- Overall (CITY)
- 0 Strongly Tenant-Friendly
- State New York
- 15 Strongly Tenant-Friendly · D+10
- County
- — inherits STATE
- City New York
- 0 Strongly Tenant-Friendly · D+34
ZIP-level market 10475
- Home prices YoY
- 12.1%
- Active inventory
- 8
- Price-to-rent
- 23.9×
Monthly cashflow live
- Estimated rent
- $6,892 high interval (Pro) →
- Mortgage (P&I)
- −$5,191
- Tax from tax record
- −$725 /mo · $8,699/yr
- Insurance
- −$412
- HOA
- −$0
- Vacancy / Maint / Mgmt
- −$1,447
- Net cashflow
- $-884
Break-even live
Sensitivity live
| Price | -10% $-323 | -5% $-604 | +0% $-884 | +5% $-1,164 | +10% $-1,444 |
|---|---|---|---|---|---|
| Rent | -10% $-1,428 | -5% $-1,156 | +0% $-884 | +5% $-612 | +10% $-339 |
| Rate | -1.0pp $-385 | -0.5pp $-632 | base $-884 | +0.5pp $-1,140 | +1.0pp $-1,401 |
2-unit breakdown (identical units grouped — click to expand)
| Units | Beds | Baths | Est. rent |
|---|---|---|---|
| 2× units | 3 | 2 | $6,892 |
| #1 | 3 | 2 | $3,446 |
| #2 | 3 | 2 | $3,446 |
| Total (2 units) | $6,892 | ||
UW: 25.0% down · 7.5% · 30yr · 1.5% tax · 5.0% vac · 8.0% maint · 8.0% mgmt
Financing live
Cash to close
- Down payment
- $247,475
- Closing costs
- $29,697
- Reserves months
- —
- Total cash needed
- —
Loan-product check · same deal, 3 products live
Conventional
25% down · 7.5% · 30yr
- Down + closing
- —
- Monthly P&I
- —
- Monthly cashflow
- —
- DSCR
- —
- Eligible?
- —
Personal DTI + credit; lowest rate.
DSCR
20% down · 8.5% · 30yr
- Down + closing
- —
- Monthly P&I
- —
- Monthly cashflow
- —
- DSCR
- —
- Eligible?
- —
No personal income docs; deal must DSCR.
Hard money
10% down · 12.0% · 12mo
- Down + closing
- —
- Monthly P&I
- —
- Monthly cashflow
- —
- DSCR
- —
- Eligible?
- —
Short-term bridge; refi at stabilization.
Rent comps 1 comps
| Address | Beds | Baths | Sqft | Rent | $/sqft | DOM | Units | Dist |
|---|---|---|---|---|---|---|---|---|
| 641 S 5th Ave Unit 2nd/3rd Floor Mt Vernon, NY | 5.0 | 2.0 | 1800 | $3,900 | $2.17 | 6d | 1 | 1.02mi |
Listing history 8 events
-
2025-07-22status Pending
-
2025-05-01price $989,900
-
2025-03-24$999,900 Active
-
2023-10-14$899,000 Active
-
2023-10-14historical
-
2023-08-04$979,000 Active
-
2023-08-03historical
-
2023-05-01$999,000 Active
ⓘ Source: listings_history table (triggers on properties + properties_extension) + one-shot
backfill from property_details.listing_events for pre-trigger history.
Tax reassessment forecast NY · Partial reset (capped growth)
- Current annual tax
- $8,699 · $725/mo
- Projected year-2 tax
- $12,714 · $1,060/mo
- Expected delta
- +$4,015/yr (+$335/mo · 46.2%)
ⓘ Screening estimate from a state-policy table — verify with the county assessor before closing.
Climate risk First Street
- Flood 1/10 Low FEMA zone X (unshaded) · 0% chance over 30 yrs
- Wildfire 1/10 Low
- Heat 6/10 Major 7 d/yr ≥99°F today · 14 d/yr by 30 yrs out
- Wind 6/10 Major 27% chance of damaging wind over 30 yrs
- Air quality 5/10 Major 6 unhealthy d/yr today · 8 by 30 yrs out
Nearby sold comps map
Loading sold comps map…
Walkable amenities ~0.75 mi
Loading nearby amenities…
Taxation est. · year 1
- Rental income
- $82,704
- − Mortgage interest
- −$55,450
- − Property taxes
- −$8,699
- − Insurance
- −$4,950
- − Repairs & maintenance
- −$6,616
- − Management
- −$6,616
- − Depreciation
- −$28,797
- Taxable loss
- −$28,424
- Est. tax savings @ 24.0%
- +$6,822
- After-tax cash flow
- $-3,784/yr
For passive investors: Depreciation is non-cash, so a rental often shows a tax loss while cash-flowing — sheltering income. Rental losses are passive: they offset passive income freely, and up to $25,000/yr can offset ordinary (W-2) income if you actively participate and your MAGI is under $100k (phasing out to $0 by $150k); unused losses carry forward. On sale, claimed depreciation is recaptured at up to 25%, and gains may owe capital-gains tax (a 1031 exchange can defer both). Figures are a year-1 estimate at your 24.0% rate — not tax advice; consult a CPA.
Schools (NCES district)
No district data.
Livability — New York
- Score
- 75/100
- State rank
- #268
- US rank
- #4188
Category grades
Schools grade is shown separately in the Schools card above.
Census & demographics
- Census place
- New York, NY
- City population
- 7,731,280
- Population (ZIP)
- 42,771
Population outlook (Bronx County) Hauer SSP2
- Today (2025)
- 1,607,353 people
- By 2030
- 1,681,852 · +4.6%
- By 2040
- 1,824,421 · +13.5%
- By 2050
- 1,945,470 · +21.0%
- By 2075
- 2,187,887 · +36.1%
- By 2100
- 2,244,136 · +39.6%
Race, ethnicity, and origin ACS 2023
- Neighborhood character
- Majority Black (60%)
- Race & ethnicity
- Black 60% Hispanic / Latino 30% Two or more races 9% White 5% Asian 2%
- Hispanic origin (detail)
- Mexican 1% Puerto Rican 18% Dominican 7%
- Common ancestry
- Scotch-Irish 1% Lithuanian 1%
- Foreign-born
- 25% · Canada
- Languages at home
- 68% English-only · Spanish 23% Russian/Polish/Slavic 1% French/Haitian/Cajun 1%
Political lean MEDSL · Bronx
- 2024 margin
- Solid D (+45.4) · D 72.7% · R 27.3%
- 2008→2024 swing
- -32.3pp toward R · 2008: 77.8pp · 2024: 45.4pp
- All cycles
- 2024: D+45.4 2020: D+67.6 2016: D+79.1 2012: D+82.9 2008: D+77.8
Not yet ingested
- Civics
- —
Market trends
- HPI YoY
- ▲ 20.24%
- Current HPI
- 187.68
- Rent YoY
- —
- Metro
- —
- State GDP YoY
- ▲ 2.60%
- F500 in state
- 92
Industry mix (Fortune 500 HQ in NY)
| Industry | F500 HQs | Revenue |
|---|---|---|
| Financial Services | 10 | $950B |
|
||
| Consumer Goods | 9 | $162B |
|
||
| Insurance | 4 | $225B |
|
||
| Telecommunications | 2 | $144B |
|
||
| Pharmaceuticals | 2 | $112B |
|
||
| Media / Entertainment | 2 | $69B |
|
||
Price history
-0.9% since first listed8 events — show timeline
- 2025-07-22 Pending — OneKey® MLS as Distributed by MLS Grid
- 2025-05-01 Price Changed $989,900 OneKey® MLS as Distributed by MLS Grid
- 2025-03-24 Listed $999,900 OneKey® MLS as Distributed by MLS Grid
- 2023-10-14 Listing Removed — OneKey® MLS as Distributed by MLS Grid
- 2023-10-14 Listed $899,000 OneKey® MLS as Distributed by MLS Grid
- 2023-08-04 Listed $979,000 OneKey® MLS as Distributed by MLS Grid
- 2023-08-03 Listing Removed — OneKey® MLS as Distributed by MLS Grid
- 2023-05-01 Listed $999,000 OneKey® MLS as Distributed by MLS Grid
Property tax history
+6.8%/yrLatest (2025): $8,699 · +8.0% YoY. Source: county tax records.
Cash-flow waterfall
monthlySold comps — $/sqft
last 12 mo · ≤1 miLoading sold comps…