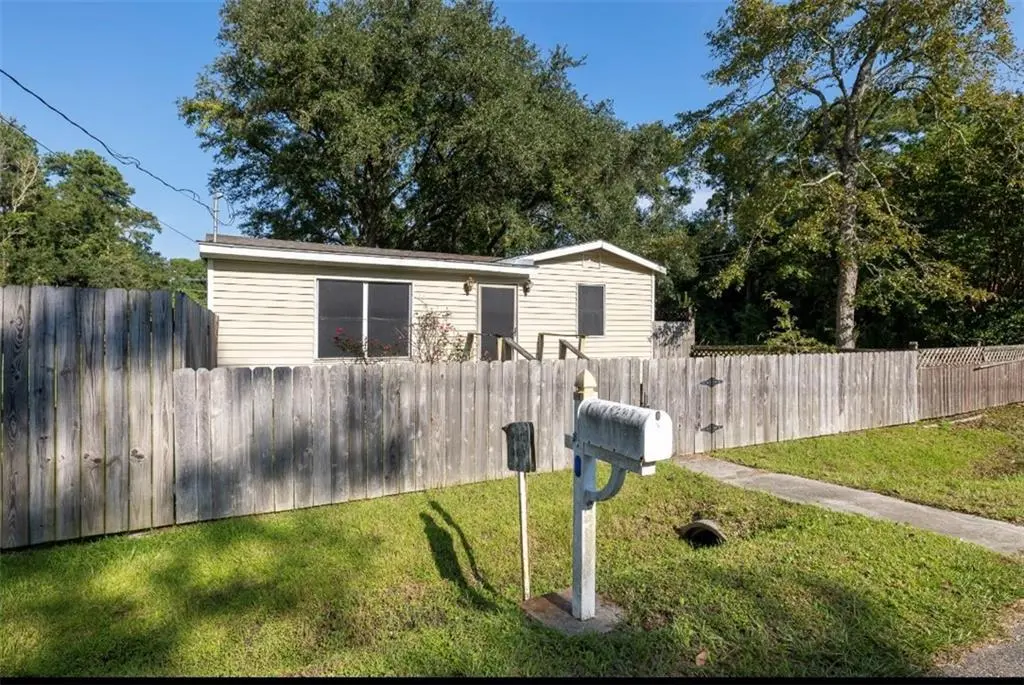
2794 8th St · Slidell, LA
Flood risk No data
- FEMA flood zone
- —
- Chance of flooding over 30 yrs
- —
- Est. flood insurance / yr
- —
Fire risk No data
- Est. fire insurance / yr
- —
Heat risk No data
- Hot days now (above threshold)
- —
- Hot days in 30 yrs
- —
Wind risk No data
- Chance of severe wind over 30 yrs
- —
Air-quality risk No data
- Unhealthy air days now
- —
- Unhealthy air days in 30 yrs
- —
Risk factors via First Street. Map © Google.
Why this score? — see what drove the B+ grade
The composite is a weighted blend of 9 inputs, each scored 0–100. Each bar is that input's sub-score; the figure is the points it added to the 100-point composite (weight × sub-score).
- Cash flow +30.0/30.0
- ARV discount +15.0/15.0
- DSCR +10.0/10.0
- 1% rule +9.0/10.0
- Schools +4.3/10.0
- Livability +3.5/5.0
- Rent growth +2.9/5.0
- Condition / age +2.5/5.0
- Appreciation +0.0/10.0
$93,000
🖨 Deal sheet 📄 Offer letter ✓ Due diligence
Listing remarks MLS
Investor Special!! Starter Home! Income Producing Property!! The possibilities are endless. Step into this 2 bedroom, 1 bathroom cottage ready for you to make it your own. Additional sunroom that could be used for bonus office. Large Wooden Back porch to sit out and have morning coffee. Fenced yard with large backyard!!!Bring all offers.
Key facts
- Fenced yard
- Large backyard
- Sunroom
Tags
Neighborhood map
What this means for you Summary
Snapshot
- This is a 2-bed/1.0-bath single-family listed at $93k.
Deal economics
- At list price, monthly cash flow is $385 ($5k/yr) — positive.
- The deal already cash-flows at list — no discount required.
- Meets the 1% rule at list price ($1k rent vs $93k).
- Recommended offer: $82k (12.0% below list) — sets the bar for market timing.
- Cap rate 11.3% vs local median 5.9% in Slidell — top-decile yield for the area; either an underpriced asset or a hidden risk that comps aren't pricing in. Stress-test before assuming the spread holds.
Location & tenants
- Location reads 70/100 on livability (#57 in LA) — a middle-class / working-renter tenant base. Strengths: cost of living A+, housing A+, health & safety A+; Watch: amenities F, commute F.
- St. Tammany Parish (suburban): math 43% / reading 55% proficiency, ranked #11 of 98 in LA (top 11%) — families likely to look elsewhere, expect single-tenant / working-renter base with shorter leases.
- Market conditions: Rents rising (+1.5%/yr); 489 active listings in the ZIP; 18 comparable units currently listed for rent nearby; rentals at typical pace (median 17d on market — plan ~3-4 weeks tenant-placement turnaround); 1,064 units permitted in St. Tammany Parish in 2024 (0 in 5+ unit buildings).
Forward outlook
- Local home prices are declining (-3.0%/yr); year-one equity from $643 of loan paydown is wiped out by about $3k of value loss. Plan a longer hold.
- St. Tammany County population projected at +27% by 2050 — long-run rental-demand tailwind backs the buy-and-hold thesis.
- At projected returns (-3.0% appreciation + 1.5% rent growth), your $26k cash investment doubles in ~8 years — after that, you're playing with house money.
Negotiation context
- It's been on market 134 days — a 12% lower offer ($82k) is reasonable based on typical stale-listing flexibility.
- 3 sale attempts with the ask held roughly flat each time — persistent listings suggest the price (not the market) is what's stuck; bring a comps-based counter.
Questions for the listing agent
- It's been on market 134 days. Have you received any prior offers? Is the seller open to a 12% concession, seller financing, or rate buy-down credit?
- Why hasn't it sold? Are there any deal-killer items the seller is aware of (foundation, flood, title, zoning, code violations)?
- Is there a deadline driving the sale (1031 exchange, divorce, estate, relocation)? That informs how much negotiation room exists.
- Schools are B-rated — typically a magnet for longer-tenancy family renters. What's the average tenant stay here, and is there a school-zone premium baked into asking?
- What's the average days-on-market for RENTAL listings here right now (not sales)? A rising rental-DOM trend means longer vacancies and softer asking-rent achievability than the comps imply.
- What's the recent tenant-quality profile in this submarket — average credit score on applications, eviction rate, late-payment / NSF rate, and stable-employment percentage? A property-management company in the area should have these aggregated.
- How much new for-sale + rental construction is in the pipeline within 1–3 miles? Heavy new supply typically softens prices + rents 12–24 months out; constrained supply supports both.
Investment metrics
- 1% rule
- 1.40% ✓
- Cap rate
- 11.26%
- Cash-on-cash
- 17.73%
- DSCR
- 1.79
- GRM
- 6.0
CMA / ARV
- ARV (median comp)
- $136,274
- List price
- $93,000
- Delta
- -31.76%
- Verdict
- UNDERPRICED
- Comps
- 20 within 1.0 mi
Show comp detail 5 sales within ~0.75 mi
| Address | Dist | Beds/Ba | Sqft | Sold | Price | $/sf | Match |
|---|---|---|---|---|---|---|---|
| 784 Pinetree St | 0.41mi | 3/1.0 (+1) | 935 (-3%) | 2mo | $145,000 | $155 | 70 |
| 3113 Terrace Ave | 0.36mi | 2/1.0 | 914 (-5%) | 9mo | $127,500 | $139 | 68 |
| 727 Stanley St | 0.34mi | 3/1.0 (+1) | 1,026 (+7%) | 4mo | $45,000 | $44 | 64 |
| 720 Cousin St | 0.51mi | 2/1.0 | 819 (-15%) | 1mo | $101,000 | $123 | 51 |
| 3222 Duncan St | 0.63mi | 3/2.0 (+1) | 1,100 (+15%) | 4mo | $66,200 | $60 | 34 |
Match score weights: distance 35% · size 25% · config 20% · recency 20%. Top-matched comps best support the ARV.
Projected returns pro-forma
-3.0% appreciation · 1.47% rent growth · sell at horizon
- IRR
- 7.5%
- Equity multiple
- 1.29×
- Total profit
- $7,484
- Equity at exit
- $13,867
- IRR
- 15.4%
- Equity multiple
- 2.16×
- Total profit
- $30,305
- Equity at exit
- $8,041
Cash invested: $26,040 (down + closing). Projections, not guarantees.
Landlord ↔ Tenant lean methodology
- Overall (STATE)
- 90 Strongly Landlord-Friendly
- State Louisiana
- 90 Strongly Landlord-Friendly · R+12
- County
- — inherits STATE
- City
- — inherits STATE
ZIP-level market 70458
- Rents YoY
- 1.5%
- Active inventory
- 489
- Price-to-rent
- 6.0×
Monthly cashflow live
- Estimated rent
- $1,301 high interval (Pro) →
- Mortgage (P&I)
- −$488
- Tax est. 1.5%
- −$116 /mo · $1,395/yr
- Insurance
- −$39
- HOA
- −$0
- Vacancy / Maint / Mgmt
- −$273
- Net cashflow
- $385
Break-even live
UW: 25.0% down · 7.5% · 30yr · 1.5% tax · 5.0% vac · 8.0% maint · 8.0% mgmt
Financing live
Cash to close
- Down payment
- $23,250
- Closing costs
- $2,790
- Reserves months
- —
- Total cash needed
- —
Loan-product check · same deal, 3 products live
Conventional
25% down · 7.5% · 30yr
- Down + closing
- —
- Monthly P&I
- —
- Monthly cashflow
- —
- DSCR
- —
- Eligible?
- —
Personal DTI + credit; lowest rate.
DSCR
20% down · 8.5% · 30yr
- Down + closing
- —
- Monthly P&I
- —
- Monthly cashflow
- —
- DSCR
- —
- Eligible?
- —
No personal income docs; deal must DSCR.
Hard money
10% down · 12.0% · 12mo
- Down + closing
- —
- Monthly P&I
- —
- Monthly cashflow
- —
- DSCR
- —
- Eligible?
- —
Short-term bridge; refi at stabilization.
Rent comps 18 comps
| Address | Beds | Baths | Sqft | Rent | $/sqft | DOM | Units | Dist |
|---|---|---|---|---|---|---|---|---|
| 1112 Cousin St Slidell, LA | 2.0 | 1.0 | 782 | $1,100 | $1.41 | 3d | 1 | 0.45mi |
| 2864 Slidell Ave Slidell, LA | 3.0 | 1.0 | 963 | $1,395 | $1.45 | 3d | 1 | 0.54mi |
| 2004 5th St Unit A Slidell, LA | 2.0 | 1.0 | 900 | $1,250 | $1.39 | 24d | 1 | 0.57mi |
| 901 Old Spanish Trl Slidell, LA | 2.0 | 1.5 | 1070 | $1,120 | $1.05 | 12d | 1 | 0.61mi |
| 3159 Dee St Slidell, LA | 3.0 | 1.0 | 898 | $1,400 | $1.56 | 44d | 1 | 0.66mi |
| 2594 Front St Unit 3 Slidell, LA | 1.0 | 1.0 | 800 | $1,250 | $1.56 | 44d | 1 | 0.72mi |
| 1303 Town Center Pkwy Slidell, LA | 3.0 | 1.0–2.0 | 990 | $1,588 | $1.60 | 2d | 31 | 0.74mi |
| 1640 Town Center Pkwy Slidell, LA | 3.0 | 1.0–2.0 | 959 | $1,635 | $1.71 | 2d | 46 | 1.07mi |
| 756 Gause Blvd Unit 38 Slidell, LA | 2.0 | 2.0 | 814 | $1,000 | $1.23 | 3d | 1 | 1.20mi |
| 756 Gause Blvd Unit 38 Slidell, LA | 2.0 | 2.0 | 814 | $1,000 | $1.23 | 44d | 1 | 1.20mi |
| 221 Bella Sera Ln Slidell, LA | 3.0 | 2.0 | 1028 | $1,525 | $1.48 | 12d | 1 | 1.24mi |
| 57376 Beech Ave Slidell, LA | 2.0 | 1.5 | 1000 | $1,350 | $1.35 | 17d | 1 | 1.25mi |
| 57376 Beech Ave Slidell, LA | 2.0 | 1.5 | 1004 | $1,350 | $1.34 | 14d | 1 | 1.25mi |
| 400 Voters Rd Slidell, LA | 1.0 | 1.0 | 550 | $925 | $1.68 | 24d | 1 | 1.31mi |
| 400 Voters Rd Slidell, LA | 1.0 | 1.0 | 550 | $925 | $1.68 | 44d | 1 | 1.31mi |
| 57389 Brookter Rd Slidell, LA | 2.0 | 1.0 | 971 | $1,200 | $1.24 | 20d | 1 | 1.47mi |
| 36326 Salmen St Apt A Slidell, LA | 1.0 | 1.0 | 650 | $1,100 | $1.69 | 24d | 1 | 1.47mi |
| 36326 Salmen St Unit B Slidell, LA | 1.0 | 1.0 | 650 | $1,100 | $1.69 | 12d | 1 | 1.47mi |
Listing history 14 events
-
2026-06-10days on market $93,000 Active 134 DOM
-
2026-06-09days on market $93,000 Active 133 DOM
-
2026-06-08days on market $93,000 Active 132 DOM
-
2026-06-07days on market $93,000 Active 131 DOM
-
2026-06-03days on market $93,000 Active 127 DOM
-
2026-06-02days on market $93,000 Active 126 DOM
-
2026-06-01days on market $93,000 Active 125 DOM
-
2026-05-31days on market $93,000 Active 124 DOM
-
2026-01-26$93,000 Active 339-char remark
Show marketing remark (339 chars)
Investor Special!! Starter Home! Income Producing Property!! The possibilities are endless. Step into this 2 bedroom, 1 bathroom cottage ready for you to make it your own. Additional sunroom that could be used for bonus office. Large Wooden Back porch to sit out and have morning coffee. Fenced yard with large backyard!!!Bring all offers.
-
2026-01-26$93,000 Active
Show marketing remark (339 chars)
Investor Special!! Starter Home! Income Producing Property!! The possibilities are endless. Step into this 2 bedroom, 1 bathroom cottage ready for you to make it your own. Additional sunroom that could be used for bonus office. Large Wooden Back porch to sit out and have morning coffee. Fenced yard with large backyard!!!Bring all offers.
-
2025-10-16price $99,000
-
2025-10-16price $99,000
-
2025-08-25$105,000 Active
-
2022-04-26soldstatus $115,000
ⓘ Source: listings_history table (triggers on properties + properties_extension) + one-shot
backfill from property_details.listing_events for pre-trigger history.
Nearby sold comps map
Loading sold comps map…
Walkable amenities ~0.75 mi
Loading nearby amenities…
Taxation est. · year 1
- Rental income
- $15,607
- − Mortgage interest
- −$5,209
- − Property taxes
- −$1,395
- − Insurance
- −$465
- − Repairs & maintenance
- −$1,249
- − Management
- −$1,249
- − Depreciation
- −$2,705
- Taxable income
- $3,335
- Est. tax owed @ 24.0%
- −$800
- After-tax cash flow
- $3,817/yr
For passive investors: Depreciation is non-cash, so a rental often shows a tax loss while cash-flowing — sheltering income. Rental losses are passive: they offset passive income freely, and up to $25,000/yr can offset ordinary (W-2) income if you actively participate and your MAGI is under $100k (phasing out to $0 by $150k); unused losses carry forward. On sale, claimed depreciation is recaptured at up to 25%, and gains may owe capital-gains tax (a 1031 exchange can defer both). Figures are a year-1 estimate at your 24.0% rate — not tax advice; consult a CPA.
Schools (NCES district)
- District
- St. Tammany Parish
- NCES district ID
- 2201650
- Math proficiency
- 43% ▼ -32.00%
- Reading proficiency
- 55% ▼ -26.00%
- Median HH income
- $61,752
- Composite
- 43.04/100
- National rank
- #3098
- State rank
- #11 of 98 in LA
Livability — Slidell
- Score
- 70/100
- State rank
- #57
- US rank
- #7673
Category grades
Schools grade is shown separately in the Schools card above.
Census & demographics
- Census place
- Slidell, LA
- County
- Saint Tammany Parish · 228,296 people
- City population
- 95,511
- Metro
- New Orleans-Metairie, LA
- Population (ZIP)
- 39,034
- Household income
- $72,843
- Rent vs Own
- Severe rent burden
- 1331.0
Population outlook (St. Tammany County) Hauer SSP2
- Today (2025)
- 286,725 people
- By 2030
- 304,175 · +6.1%
- By 2040
- 336,203 · +17.3%
- By 2050
- 364,590 · +27.2%
- By 2075
- 433,362 · +51.1%
- By 2100
- 470,333 · +64.0%
Race, ethnicity, and origin ACS 2023
- Neighborhood character
- Predominantly White (66%)
- Race & ethnicity
- White 66% Black 17% Two or more races 10% Hispanic / Latino 9% Native American 2% Asian 1%
- Hispanic origin (detail)
- Mexican 3% Puerto Rican 1%
- Common ancestry
- Lithuanian 15% Slovak 2% Romanian 1%
- Foreign-born
- 3% · Canada, Vietnam
- Languages at home
- 93% English-only · Spanish 5% Vietnamese 1%
Political lean MEDSL · St. Tammany
- 2024 margin
- Solid R (+43.8) · D 27.3% · R 71.1% · Other 1.6%
- 2008→2024 swing
- +9.6pp toward D · 2008: -53.4pp · 2024: -43.8pp
- All cycles
- 2024: R+43.8 2020: R+44.2 2016: R+50.8 2012: R+52.2 2008: R+53.4
Not yet ingested
- Civics
- —
Market trends
- HPI YoY
- ▼ -173.60%
- Current HPI
- 147.4749
- Rent YoY
- ▲ 1.47%
- Metro
- New Orleans-Metairie, LA
- State GDP YoY
- ▲ 3.29%
- F500 in state
- 10
Industry mix (Fortune 500 HQ in LA)
| Industry | F500 HQs | Revenue |
|---|---|---|
| Telecommunications | 2 | $23B |
|
||
| Utilities | 1 | $12B |
|
||
| Wholesale / Distribution | 1 | $5B |
|
||
| Advertising | 1 | $2B |
|
||
Price history
-19.1% since first listed6 events — show timeline
- 2026-01-26 Listed $93,000 GSREIN
- 2026-01-26 Listed $93,000 AcadianaMLS
- 2025-10-16 Price Changed $99,000 AcadianaMLS
- 2025-10-16 Price Changed $99,000 GSREIN
- 2025-08-25 Listed $105,000 AcadianaMLS
- 2022-04-26 Sold (Public Records) $115,000 Public Records
Property tax history
-17.1%/yrLatest (2025): $135 · -13.7% YoY. Source: county tax records.
Cash-flow waterfall
monthlySold comps — $/sqft
last 12 mo · ≤1 miLoading sold comps…