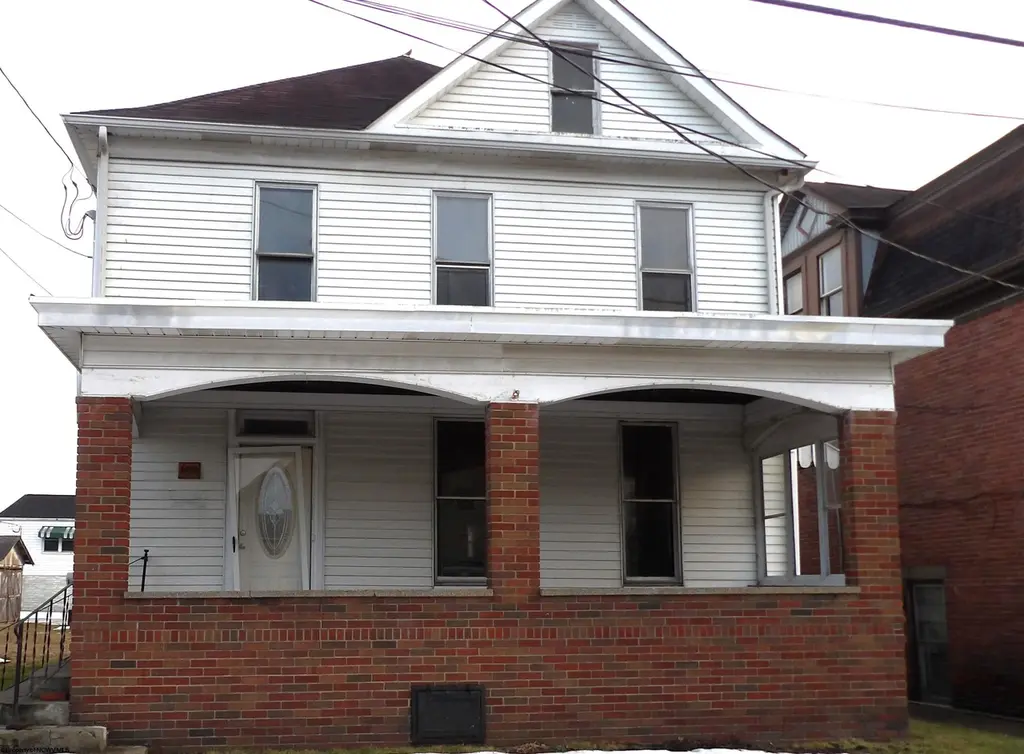
1405 Center St · Moundsville, WV
Flood risk 3/10 · Minor
- FEMA flood zone
- X (unshaded)
- Chance of flooding over 30 yrs
- 0.09%
- Est. flood insurance / yr
- $473 – $860
Fire risk 1/10 · Minimal
- Est. fire insurance / yr
- $787 – $1,461
Heat risk 4/10 · Minor
- Hot days now (above 99°F)
- 8 days/yr
- Hot days in 30 yrs
- 20 days/yr
Wind risk 1/10 · Minimal
- Chance of severe wind over 30 yrs
- 0.0%
Air-quality risk 2/10 · Minimal
- Unhealthy air days now
- 1 days/yr
- Unhealthy air days in 30 yrs
- 3 days/yr
Risk factors via First Street. Map © Google.
Why this score? — see what drove the B- grade
The composite is a weighted blend of 9 inputs, each scored 0–100. Each bar is that input's sub-score; the figure is the points it added to the 100-point composite (weight × sub-score).
- Cash flow +29.6/30.0
- DSCR +10.0/10.0
- ARV discount +7.5/15.0
- 1% rule +7.3/10.0
- Livability +3.3/5.0
- Schools +2.7/10.0
- Rent growth +2.5/5.0
- Condition / age +2.5/5.0
- Appreciation +0.0/10.0
$83,800
🖨 Deal sheet 📄 Offer letter ✓ Due diligence
Listing remarks
This home could be the one! Elbow grease and hard work and this one could be the show place you have been looking for with original qualities. Call and make your appointment today. This one will not last at this price. * “Chase Employees: Please see the Chase Acknowledgement for restrictions. Buyer must sign at offer/contract” * * “Chase Acknowledgement and Certification Acknowledgement” Chase Acknowledgement and Certification of Prospective Purchaser(s) – Employees or directors of JPMorgan Chase & Co. and its direct and indirect subsidiaries are strictly prohibited from directly or indirectly purchasing any property owned or serviced by or on beh
Key facts
- 4,792 sq ft lot
- Built 1900
- Listed 72 days
Property features AI
Exterior
- Parking: On-street parking
- Utilities: Public water; Public sewer
- Home design: Detached single-family residence; 2 stories
- Construction: Aluminum siding and frame construction; Shingle roof
- Exterior features: Front porch; Level lot
Interior
- Flooring: Wood
- Bathrooms: 1 full bathroom; 1 half bathroom
- Heating & cooling: Forced air heating
- Interior features: Wood flooring; Masonry fireplace; Unfinished basement; Total of 8 rooms
Neighborhood map
What this means for you Summary
Snapshot
- This is a 3-bed/1.0-bath single-family listed at $84k.
Deal economics
- At list price, monthly cash flow is $303 ($4k/yr) — positive.
- The deal already cash-flows at list — no discount required.
- Meets the 1% rule at list price ($1k rent vs $84k).
- Recommended offer: $79k (6.0% below list) — sets the bar for market timing.
- Cap rate 10.6% vs local median 4.7% in Moundsville — top-decile yield for the area; either an underpriced asset or a hidden risk that comps aren't pricing in. Stress-test before assuming the spread holds.
Location & tenants
- Location reads 66/100 on livability (#105 in WV) — a middle-class / working-renter tenant base. Strengths: cost of living A+, housing A-, health & safety A-; Watch: amenities F, commute F, employment F.
- Marshall County Schools (suburban): math 28% / reading 36% proficiency, ranked #21 of 55 in WV (top 38%) — families likely to look elsewhere, expect single-tenant / working-renter base with shorter leases.
- Zoned schools: Central Elementary School (math 28% / reading 32%, grade F, #218 of 377 statewide, top 59%, 279 students, 0% FRL); Moundsville Middle School (math 16% / reading 27%, grade F, #97 of 109 statewide, top 91%, 409 students, 0% FRL); John Marshall High School (math 22% / reading 49%, grade F, #41 of 110 statewide, top 37%, 1,046 students, 0% FRL) — zoned schools average 0% FRL vs 42% district-wide (42 pts lower); this property's tenant base skews higher-income than the district average.
- Market conditions: 78 active listings in the ZIP; 6 units permitted in Marshall County in 2024 (0 in 5+ unit buildings).
Forward outlook
- Local home prices are declining (-3.0%/yr); year-one equity from $579 of loan paydown is wiped out by about $3k of value loss. Plan a longer hold.
- Marshall County population projected at -19% by 2050 — secular population decline; favor cash flow + early exit over multi-decade hold.
- At projected returns (-3.0% appreciation + 3.0% rent growth), your $23k cash investment doubles in ~8 years — after that, you're playing with house money.
Negotiation context
- It's been on market 72 days — a 6% lower offer ($79k) is reasonable based on typical stale-listing flexibility.
Risks & watch-outs
- Watch-outs: built in 1900 — expect roof / HVAC / electrical / plumbing capex.
Questions for the listing agent
- It's been on market 72 days. Have you received any prior offers? Is the seller open to a 6% concession, seller financing, or rate buy-down credit?
- Built in 1900 — when were the roof, HVAC, electrical panel, plumbing, and water heater last replaced?
- Why hasn't it sold? Are there any deal-killer items the seller is aware of (foundation, flood, title, zoning, code violations)?
- Is there a deadline driving the sale (1031 exchange, divorce, estate, relocation)? That informs how much negotiation room exists.
- Schools are D-rated, which usually means shorter tenancies and higher turnover. Who's the typical renter profile here, and what's been the actual vacancy rate?
- What's the average days-on-market for RENTAL listings here right now (not sales)? A rising rental-DOM trend means longer vacancies and softer asking-rent achievability than the comps imply.
- What's the recent tenant-quality profile in this submarket — average credit score on applications, eviction rate, late-payment / NSF rate, and stable-employment percentage? A property-management company in the area should have these aggregated.
- How much new for-sale + rental construction is in the pipeline within 1–3 miles? Heavy new supply typically softens prices + rents 12–24 months out; constrained supply supports both.
Investment metrics
- 1% rule
- 1.23% ✓
- Cap rate
- 10.63%
- Cash-on-cash
- 15.48%
- DSCR
- 1.69
- GRM
- 6.8
CMA / ARV
- ARV (on-the-fly)
- $181,056
- Comps found
- 12
Show comp detail 12 sales within ~0.75 mi
| Address | Dist | Beds/Ba | Sqft | Sold | Price | $/sf | Match |
|---|---|---|---|---|---|---|---|
| 1208 Center St | 0.12mi | 4/1.0 (+1) | 2,035 (+3%) | 6mo | $38,000 | $19 | 78 |
| 105 Cedar Ave | 0.07mi | 3/1.0 | 1,756 (-11%) | 10mo | $110,000 | $63 | 70 |
| 1707 Virginia St | 0.18mi | 3/3.0 | 2,121 (+8%) | 3mo | $165,000 | $78 | 68 |
| 1009 7th St | 0.50mi | 4/1.5 (+1) | 2,056 (+4%) | 4mo | $167,835 | $82 | 59 |
| 2213 4th St | 0.55mi | 3/2.0 | 2,082 (+6%) | 3mo | $220,000 | $106 | 58 |
| 1312 7th St | 0.40mi | 4/2.0 (+1) | 2,054 (+4%) | 10mo | $234,000 | $114 | 56 |
| 1510 Fifth St | 0.29mi | 3/2.0 | 1,698 (-14%) | 8mo | $250,000 | $147 | 53 |
| 316 Thorn Ave | 0.69mi | 4/1.0 (+1) | 1,870 (-5%) | 3mo | $172,000 | $92 | 52 |
| 1301 Fifth St | 0.33mi | 4/2.5 (+1) | 2,214 (+12%) | 1mo | $245,000 | $111 | 52 |
| 1508 6th St | 0.35mi | 3/2.0 | 1,741 (-12%) | 12mo | $162,000 | $93 | 51 |
| 34 South Highland Ave | 0.55mi | 3/1.5 | 1,777 (-10%) | 8mo | $105,000 | $59 | 50 |
| 2317 First St | 0.45mi | 3/2.0 | 1,766 (-10%) | 11mo | $56,000 | $32 | 49 |
Match score weights: distance 35% · size 25% · config 20% · recency 20%. Top-matched comps best support the ARV.
Projected returns pro-forma
-3.0% appreciation · 3.0% rent growth · sell at horizon
- IRR
- 6.2%
- Equity multiple
- 1.24×
- Total profit
- $5,677
- Equity at exit
- $12,495
- IRR
- 15.6%
- Equity multiple
- 2.26×
- Total profit
- $29,671
- Equity at exit
- $7,245
Cash invested: $23,464 (down + closing). Projections, not guarantees.
Landlord ↔ Tenant lean methodology
- Overall (STATE)
- 83 Strongly Landlord-Friendly
- State West Virginia
- 83 Strongly Landlord-Friendly · R+22
- County
- — inherits STATE
- City
- — inherits STATE
ZIP-level market 26041
- Home prices YoY
- -24.8%
- Active inventory
- 78
- Price-to-rent
- 6.8×
Monthly cashflow live
- Estimated rent
- $1,034 medium interval (Pro) →
- Mortgage (P&I)
- −$439
- Tax from tax record
- −$39 /mo · $473/yr
- Insurance
- −$35
- HOA
- −$0
- Vacancy / Maint / Mgmt
- −$217
- Net cashflow
- $303
Break-even live
UW: 25.0% down · 7.5% · 30yr · 1.5% tax · 5.0% vac · 8.0% maint · 8.0% mgmt
Financing live
Cash to close
- Down payment
- $20,950
- Closing costs
- $2,514
- Reserves months
- —
- Total cash needed
- —
Loan-product check · same deal, 3 products live
Conventional
25% down · 7.5% · 30yr
- Down + closing
- —
- Monthly P&I
- —
- Monthly cashflow
- —
- DSCR
- —
- Eligible?
- —
Personal DTI + credit; lowest rate.
DSCR
20% down · 8.5% · 30yr
- Down + closing
- —
- Monthly P&I
- —
- Monthly cashflow
- —
- DSCR
- —
- Eligible?
- —
No personal income docs; deal must DSCR.
Hard money
10% down · 12.0% · 12mo
- Down + closing
- —
- Monthly P&I
- —
- Monthly cashflow
- —
- DSCR
- —
- Eligible?
- —
Short-term bridge; refi at stabilization.
Listing history 18 events
-
2026-06-19days on market $83,800 Active 72 DOM
-
2026-06-18days on market $83,800 Active 71 DOM
-
2026-06-17days on market $83,800 Active 70 DOM
-
2026-06-16days on market $83,800 Active 69 DOM
-
2026-06-16price $83,800 Active 68 DOM
-
2026-06-15days on market $91,000 Active 68 DOM
-
2026-06-14days on market $91,000 Active 66 DOM
-
2026-06-12days on market $91,000 Active 65 DOM
-
2026-06-09days on market $91,000 Active 62 DOM
-
2026-06-08days on market $91,000 Active 61 DOM
-
2026-06-07days on market $91,000 Active 60 DOM
-
2026-06-02days on market $91,000 Active 55 DOM
-
2026-06-01days on market $91,000 Active 54 DOM
-
2026-05-31days on market $91,000 Active 53 DOM
-
2026-05-30days on market $91,000 Active 52 DOM
-
2026-05-06price $91,000
-
2026-04-14price $98,800
-
2026-04-08$88,400 Active
ⓘ Source: listings_history table (triggers on properties + properties_extension) + one-shot
backfill from property_details.listing_events for pre-trigger history.
Tax reassessment forecast WV · Resets to sale price
- Current annual tax
- $473 · $39/mo
- Projected year-2 tax
- $494 · $41/mo
- Expected delta
- +$22/yr (+$2/mo · 4.6%)
ⓘ Screening estimate from a state-policy table — verify with the county assessor before closing.
Climate risk First Street
- Flood 3/10 Moderate FEMA zone X (unshaded) · 9% chance over 30 yrs
- Wildfire 1/10 Low
- Heat 4/10 Moderate 8 d/yr ≥99°F today · 20 d/yr by 30 yrs out
- Wind 1/10 Low 0% chance of damaging wind over 30 yrs
- Air quality 2/10 Low 1 unhealthy d/yr today · 3 by 30 yrs out
Nearby sold comps map
Loading sold comps map…
Walkable amenities ~0.75 mi
Loading nearby amenities…
Taxation est. · year 1
- Rental income
- $12,402
- − Mortgage interest
- −$4,694
- − Property taxes
- −$473
- − Insurance
- −$419
- − Repairs & maintenance
- −$992
- − Management
- −$992
- − Depreciation
- −$2,438
- Taxable income
- $2,394
- Est. tax owed @ 24.0%
- −$575
- After-tax cash flow
- $3,058/yr
For passive investors: Depreciation is non-cash, so a rental often shows a tax loss while cash-flowing — sheltering income. Rental losses are passive: they offset passive income freely, and up to $25,000/yr can offset ordinary (W-2) income if you actively participate and your MAGI is under $100k (phasing out to $0 by $150k); unused losses carry forward. On sale, claimed depreciation is recaptured at up to 25%, and gains may owe capital-gains tax (a 1031 exchange can defer both). Figures are a year-1 estimate at your 24.0% rate — not tax advice; consult a CPA.
Schools (NCES district)
- District
- Marshall County Schools
- NCES district ID
- 5400750
- Math proficiency
- 28% ▼ -6.00%
- Reading proficiency
- 36% ▼ -4.00%
- Median HH income
- $40,289
- Composite
- 26.91/100
- National rank
- #7086
- State rank
- #21 of 55 in WV
Livability — Moundsville
- Score
- 66/100
- State rank
- #105
- US rank
- #11553
Category grades
Schools grade is shown separately in the Schools card above.
Census & demographics
- Census place
- Moundsville, WV
- County
- Marshall · 16,750 people
- Metro
- Wheeling, WV-OH
- Population (ZIP)
- 15,706
- Household income
- $55,545
- Rent vs Own
- Severe rent burden
- 7.4
Population outlook (Marshall County) Hauer SSP2
- Today (2025)
- 30,387 people
- By 2030
- 29,242 · -3.8%
- By 2040
- 26,806 · -11.8%
- By 2050
- 24,627 · -19.0%
- By 2075
- 19,846 · -34.7%
- By 2100
- 15,169 · -50.1%
Race, ethnicity, and origin ACS 2023
- Neighborhood character
- Predominantly White (94%)
- Race & ethnicity
- White 94% Two or more races 3% Hispanic / Latino 1%
- Common ancestry
- Romanian 4% Iranian 2% Italian 1%
- Foreign-born
- 1% · Canada
- Languages at home
- 98% English-only · Spanish 1% German/W. Germanic 1%
Political lean MEDSL · Marshall
- 2024 margin
- Solid R (+50.0) · D 24.1% · R 74.1% · Other 1.8%
- 2008→2024 swing
- -37.5pp toward R · 2008: -12.6pp · 2024: -50.0pp
- All cycles
- 2024: R+50.0 2020: R+49.6 2016: R+51.0 2012: R+28.6 2008: R+12.6
Not yet ingested
- Civics
- —
Market trends
- HPI YoY
- ▼ -50.71%
- Current HPI
- 153.9522
- Rent YoY
- —
- Metro
- —
- State GDP YoY
- —
- F500 in state
- 0
Price history
+2.9% since first listed3 events — show timeline
- 2026-05-06 Price Changed $91,000 NCWVREIN
- 2026-04-14 Price Changed $98,800 NCWVREIN
- 2026-04-08 Listed $88,400 NCWVREIN
Property tax history
+16.5%/yrLatest (2025): $473 · +124.5% YoY. Source: county tax records.
Cash-flow waterfall
monthlySold comps — $/sqft
last 12 mo · ≤1 miLoading sold comps…