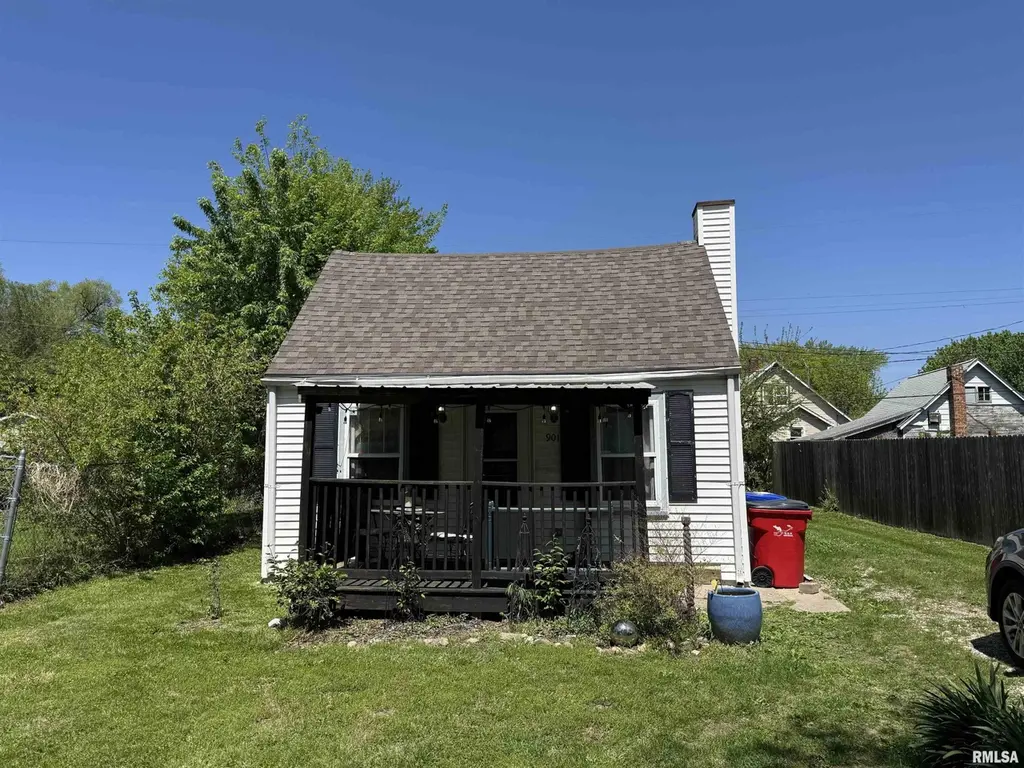
901 E Wilson Ave · Peoria Heights, IL
Flood risk 1/10 · Minimal
- FEMA flood zone
- X
- Chance of flooding over 30 yrs
- 0.0%
- Est. flood insurance / yr
- $507 – $1,088
Fire risk 1/10 · Minimal
- Est. fire insurance / yr
- $804 – $1,492
Heat risk 3/10 · Minor
- Hot days now (above 105°F)
- 7 days/yr
- Hot days in 30 yrs
- 18 days/yr
Wind risk 2/10 · Minimal
- Chance of severe wind over 30 yrs
- 1.0%
Air-quality risk 3/10 · Minor
- Unhealthy air days now
- 1 days/yr
- Unhealthy air days in 30 yrs
- 3 days/yr
Risk factors via First Street. Map © Google.
Why this score? — see what drove the B grade
The composite is a weighted blend of 9 inputs, each scored 0–100. Each bar is that input's sub-score; the figure is the points it added to the 100-point composite (weight × sub-score).
- Cash flow +30.0/30.0
- ARV discount +15.0/15.0
- 1% rule +10.0/10.0
- DSCR +10.0/10.0
- Livability +3.1/5.0
- Rent growth +2.5/5.0
- Condition / age +2.5/5.0
- Schools +1.0/10.0
- Appreciation +0.0/10.0
$65,000
🖨 Deal sheet (PDF) 📄 Offer letter ✓ Due diligence
Listing remarks
Turnkey investment opportunity in Peoria Heights! This 1 bedroom, 1 bath rental is tenant-occupied and generating $1,000/month ($12,000 annually), offering approximately a 13% cap rate at the $65,000 list price. Features a low-maintenance layout in a convenient location near shopping and dining. Perfect for investors seeking an affordable, income-producing asset with immediate cash flow. Tenant owns washer and dryer, and maintains the yard.
Key facts
- Immediate cash flow
- Tenant occupied
- Convenient location
Tags
Property features AI
Finance
- Other: Lot dimensions approx. 40 x 131
- HOA & community: No association fees
Exterior
- Parking: On-street parking
- Utilities: Public water; Public sewer
- Home design: Single-family residence; Built in 1940; 1 story (multi-level interior indicated: main, upper, lower, basement, additional level)
- Construction: Shingle roof; Approximately 674 building area
- Exterior features: Level lot
Interior
- Kitchen: Kitchen on main level — laminate flooring, approx. 14 x 7 ft
- Bedrooms: 1 bedroom (upper level) — approx. 17 x 11 ft, carpeted, egress window
- Flooring: Laminate flooring in main living areas; Carpet in bedroom
- Bathrooms: 1 full bathroom
- Heating & cooling: Forced air heating; Gas water heater; Wall unit(s) for cooling/heating
- Interior features: No fireplace; No basement
Neighborhood map
What this means for you Summary
Snapshot
- This is a 1-bed/1.0-bath single-family listed at $65k.
Deal economics
- At list price, monthly cash flow is $442 ($5k/yr) — positive.
- The deal already cash-flows at list — no discount required.
- Meets the 1% rule at list price ($1k rent vs $65k).
- Recommended offer: $63k (3.0% below list) — sets the bar for market timing.
- Cap rate 14.4% vs local median 8.5% in Peoria Heights — top-decile yield for the area; either an underpriced asset or a hidden risk that comps aren't pricing in. Stress-test before assuming the spread holds.
Location & tenants
- Location reads 62/100 on livability (#886 in IL) — a middle-class / working-renter tenant base. Strengths: cost of living A+, housing A-, health & safety B+; Watch: crime F, amenities F, commute F.
- Peoria Heights CUSD 325 (suburban): math 8% / reading 15% proficiency, ranked #560 of 620 in IL (top 90%) — low school quality limits family demand, transient renter base, plan for 1-2y turnover.
- Zoned schools: Peoria Heights High School (math 15% / reading 24%, grade F, #379 of 693 statewide, top 57%, 208 students, 0% FRL) — zoned schools average 0% FRL vs 50% district-wide (50 pts lower); this property's tenant base skews higher-income than the district average.
- Market conditions: 32 active listings in the ZIP; 5 comparable units currently listed for rent nearby; rentals at typical pace (median 15d on market — plan ~3-4 weeks tenant-placement turnaround); 73 units permitted in Peoria County in 2024 (0 in 5+ unit buildings).
Forward outlook
- Local home prices are declining (-3.0%/yr); year-one equity from $449 of loan paydown is wiped out by about $2k of value loss. Plan a longer hold.
- Peoria County population projected at -11% by 2050 — secular population decline; favor cash flow + early exit over multi-decade hold.
- At projected returns (-3.0% appreciation + 3.0% rent growth), your $18k cash investment doubles in ~5 years — after that, you're playing with house money.
Negotiation context
- It's been on market 54 days — a 3% lower offer ($63k) is reasonable based on typical stale-listing flexibility.
- 3 sale attempts since 10y ago with the ask held roughly flat each time — persistent listings suggest the price (not the market) is what's stuck; bring a comps-based counter.
- Current owner paid $31k; list at $65k implies a 110% gain — meaningful room to come down on a strong offer.
Risks & watch-outs
- Watch-outs: built in 1940 — expect roof / HVAC / electrical / plumbing capex.
Questions for the listing agent
- It's been on market 54 days. Have you received any prior offers? Is the seller open to a 3% concession, seller financing, or rate buy-down credit?
- Built in 1940 — when were the roof, HVAC, electrical panel, plumbing, and water heater last replaced?
- Is there a deadline driving the sale (1031 exchange, divorce, estate, relocation)? That informs how much negotiation room exists.
- Schools are F-rated, which usually means shorter tenancies and higher turnover. Who's the typical renter profile here, and what's been the actual vacancy rate?
- Crime grade is F in this area — have there been break-ins, vandalism, or insurance claims at this property in the last 3 years? What carrier currently insures it and at what premium?
- What's the average days-on-market for RENTAL listings here right now (not sales)? A rising rental-DOM trend means longer vacancies and softer asking-rent achievability than the comps imply.
- What's the recent tenant-quality profile in this submarket — average credit score on applications, eviction rate, late-payment / NSF rate, and stable-employment percentage? A property-management company in the area should have these aggregated.
- How much new for-sale + rental construction is in the pipeline within 1–3 miles? Heavy new supply typically softens prices + rents 12–24 months out; constrained supply supports both.
Investment metrics
- 1% rule
- 1.70% ✓
- Cap rate
- 14.45%
- Cash-on-cash
- 29.13%
- DSCR
- 2.30
- GRM
- 4.9
CMA / ARV
- ARV (median comp)
- $78,664
- List price
- $65,000
- Delta
- -17.37%
- Verdict
- UNDERPRICED
- Comps
- 20 within 1.0 mi
Show comp detail 12 sales within ~0.75 mi
| Address | Dist | Beds/Ba | Sqft | Sold | Price | $/sf | Match |
|---|---|---|---|---|---|---|---|
| 1118 E Melbourne Ave | 0.43mi | 1/— | 648 (-4%) | 4mo | $12,500 | $19 | 70 |
| 2709 N Springdale Ave | 0.67mi | 1/1.0 | 650 (-4%) | 0mo | $83,000 | $128 | 62 |
| 3824 N Ashton Ave | 0.52mi | 2/1.0 (+1) | 676 (+0%) | 10mo | $90,000 | $133 | 62 |
| 3824 N Dayton Ave | 0.62mi | 2/1.0 (+1) | 672 (-0%) | 6mo | $65,000 | $97 | 60 |
| 713 E Gift Ave | 0.74mi | 2/1.0 (+1) | 676 (+0%) | 7mo | $56,500 | $84 | 54 |
| 4100 N Illinois Dr | 0.51mi | 2/1.0 (+1) | 736 (+9%) | 5mo | $77,000 | $105 | 52 |
| 316 E Melbourne Ave | 0.64mi | 2/1.0 (+1) | 616 (-9%) | 1mo | $41,000 | $67 | 50 |
| 1217 E Melbourne Ave | 0.44mi | 2/1.0 (+1) | 760 (+13%) | 8mo | $62,500 | $82 | 47 |
| 729 E Seneca Pl | 0.66mi | 2/1.0 (+1) | 620 (-8%) | 5mo | $69,500 | $112 | 47 |
| 1107 E Hines Ave | 0.58mi | 2/1.0 (+1) | 620 (-8%) | 10mo | $95,000 | $153 | 46 |
| 301 E Ellington Dr | 0.54mi | 2/1.0 (+1) | 751 (+11%) | 10mo | $95,000 | $126 | 42 |
| 3915 N Dayton Ave | 0.62mi | 2/1.0 (+1) | 581 (-14%) | 8mo | $60,000 | $103 | 37 |
Match score weights: distance 35% · size 25% · config 20% · recency 20%. Top-matched comps best support the ARV.
Projected returns pro-forma
-3.0% appreciation · 3.0% rent growth · sell at horizon
- IRR
- 23.5%
- Equity multiple
- 1.97×
- Total profit
- $17,608
- Equity at exit
- $9,692
- IRR
- 31.4%
- Equity multiple
- 3.83×
- Total profit
- $51,581
- Equity at exit
- $5,620
Cash invested: $18,200 (down + closing). Projections, not guarantees.
Landlord ↔ Tenant lean methodology
- Overall (STATE)
- 43 Moderately Tenant-Leaning
- State Illinois
- 43 Moderately Tenant-Leaning · D+7
- County
- — inherits STATE
- City
- — inherits STATE
ZIP-level market 61616
- Home prices YoY
- -31.0%
- Active inventory
- 32
- Price-to-rent
- 4.9×
Monthly cashflow live
- Estimated rent
- $1,102 high interval (Pro) →
- Mortgage (P&I)
- −$341
- Tax from tax record
- −$61 /mo · $734/yr
- Insurance
- −$27
- HOA
- −$0
- Vacancy / Maint / Mgmt
- −$232
- Net cashflow
- $442
Break-even live
Sensitivity live
| Price | -10% $479 | -5% $460 | +0% $442 | +5% $423 | +10% $405 |
|---|---|---|---|---|---|
| Rent | -10% $355 | -5% $398 | +0% $442 | +5% $485 | +10% $529 |
| Rate | -1.0pp $475 | -0.5pp $458 | base $442 | +0.5pp $425 | +1.0pp $408 |
UW: 25.0% down · 7.5% · 30yr · 1.5% tax · 5.0% vac · 8.0% maint · 8.0% mgmt
Financing live
Cash to close
- Down payment
- $16,250
- Closing costs
- $1,950
- Reserves months
- —
- Total cash needed
- —
Loan-product check · same deal, 3 products live
Conventional
25% down · 7.5% · 30yr
- Down + closing
- —
- Monthly P&I
- —
- Monthly cashflow
- —
- DSCR
- —
- Eligible?
- —
Personal DTI + credit; lowest rate.
DSCR
20% down · 8.5% · 30yr
- Down + closing
- —
- Monthly P&I
- —
- Monthly cashflow
- —
- DSCR
- —
- Eligible?
- —
No personal income docs; deal must DSCR.
Hard money
10% down · 12.0% · 12mo
- Down + closing
- —
- Monthly P&I
- —
- Monthly cashflow
- —
- DSCR
- —
- Eligible?
- —
Short-term bridge; refi at stabilization.
Rent comps 5 comps
| Address | Beds | Baths | Sqft | Rent | $/sqft | DOM | Units | Dist |
|---|---|---|---|---|---|---|---|---|
| 811 E Lake Ave Peoria Heights, IL | 2.0 | 1.0 | 576 | $875 | $1.52 | 14d | 1 | 0.65mi |
| 249 E Oak Cliff Ct Unit 4 Peoria, IL | 2.0 | 1.0 | 600 | $800 | $1.33 | 14d | 1 | 0.95mi |
| 4914 N Best St Peoria Heights, IL | 2.0 | 1.0 | 720 | $1,200 | $1.67 | 45d | 1 | 1.21mi |
| 4809 Knoxville Ave Apt 2C Peoria, IL | 1.0 | 1.0 | 700 | $850 | $1.21 | 22d | 1 | 1.27mi |
| W Crestwood Dr Peoria, IL | 1.0–2.0 | 1.0 | 800 | $850 | $1.06 | 14d | 4 | 1.30mi |
Listing history 28 events
-
2026-06-19days on market $65,000 Active 54 DOM
-
2026-06-18days on market $65,000 Active 53 DOM
-
2026-06-17days on market $65,000 Active 52 DOM
-
2026-06-16days on market $65,000 Active 51 DOM
-
2026-06-15days on market $65,000 Active 50 DOM
-
2026-06-14days on market $65,000 Active 48 DOM
-
2026-06-13days on market $65,000 Active 47 DOM
-
2026-06-10days on market $65,000 Active 45 DOM
-
2026-06-09days on market $65,000 Active 44 DOM
-
2026-06-08days on market $65,000 Active 43 DOM
-
2026-06-07days on market $65,000 Active 42 DOM
-
2026-06-05days on market $65,000 Active 39 DOM
-
2026-06-02days on market $65,000 Active 37 DOM
-
2026-06-01days on market $65,000 Active 36 DOM
-
2026-05-31days on market $65,000 Active 35 DOM
-
2026-05-30days on market $65,000 Active 34 DOM
-
2026-04-26$65,000 Active 444-char remark
-
2025-09-08historical $950
-
2025-08-30price $950
-
2025-08-15$1,000
-
2025-06-27soldstatus $31,000
-
2021-08-06historical
-
2021-08-06historical
-
2021-08-06historical
-
2016-08-22soldstatus $12,500
-
2016-05-21$12,700
-
2004-11-19soldstatus $50,000
-
2000-09-13soldstatus $24,000
ⓘ Source: listings_history table (triggers on properties + properties_extension) + one-shot
backfill from property_details.listing_events for pre-trigger history.
Tax reassessment forecast IL · Partial reset (capped growth)
- Current annual tax
- $734 · $61/mo
- Projected year-2 tax
- $1,105 · $92/mo
- Expected delta
- +$371/yr (+$31/mo · 50.5%)
ⓘ Screening estimate from a state-policy table — verify with the county assessor before closing.
Climate risk First Street
- Flood 1/10 Low FEMA zone X · 0% chance over 30 yrs
- Wildfire 1/10 Low
- Heat 3/10 Moderate 7 d/yr ≥105°F today · 18 d/yr by 30 yrs out
- Wind 2/10 Low 100% chance of damaging wind over 30 yrs
- Air quality 3/10 Moderate 1 unhealthy d/yr today · 3 by 30 yrs out
Nearby sold comps map
Loading sold comps map…
Walkable amenities ~0.75 mi
Loading nearby amenities…
Taxation est. · year 1
- Rental income
- $13,229
- − Mortgage interest
- −$3,641
- − Property taxes
- −$734
- − Insurance
- −$325
- − Repairs & maintenance
- −$1,058
- − Management
- −$1,058
- − Depreciation
- −$1,891
- Taxable income
- $4,521
- Est. tax owed @ 24.0%
- −$1,085
- After-tax cash flow
- $4,216/yr
For passive investors: Depreciation is non-cash, so a rental often shows a tax loss while cash-flowing — sheltering income. Rental losses are passive: they offset passive income freely, and up to $25,000/yr can offset ordinary (W-2) income if you actively participate and your MAGI is under $100k (phasing out to $0 by $150k); unused losses carry forward. On sale, claimed depreciation is recaptured at up to 25%, and gains may owe capital-gains tax (a 1031 exchange can defer both). Figures are a year-1 estimate at your 24.0% rate — not tax advice; consult a CPA.
Schools (NCES district)
- District
- Peoria Heights CUSD 325
- NCES district ID
- 1731270
- Math proficiency
- 8% ▼ -3.00%
- Reading proficiency
- 15% ▼ -6.00%
- Median HH income
- $44,878
- Composite
- 10.35/100
- National rank
- #9788
- State rank
- #560 of 620 in IL
Livability — Peoria Heights
- Score
- 62/100
- State rank
- #886
- US rank
- #17272
Category grades
Schools grade is shown separately in the Schools card above.
Census & demographics
- Census place
- Peoria Heights, IL
- County
- Peoria County · 120,495 people
- City population
- 5,825
- Metro
- Peoria, IL
- Population (ZIP)
- 5,825
- Household income
- $60,099
- Rent vs Own
- Severe rent burden
- 82.0
Population outlook (Peoria County) Hauer SSP2
- Today (2025)
- 183,007 people
- By 2030
- 179,643 · -1.8%
- By 2040
- 171,782 · -6.1%
- By 2050
- 163,508 · -10.7%
- By 2075
- 140,178 · -23.4%
- By 2100
- 114,493 · -37.4%
Race, ethnicity, and origin ACS 2023
- Neighborhood character
- Predominantly White (87%)
- Race & ethnicity
- White 87% Black 4% Two or more races 4% Hispanic / Latino 3% Asian 3%
- Common ancestry
- Iranian 5% Italian 2% Slovak 2%
- Foreign-born
- 5% · Canada, South Korea
- Languages at home
- 93% English-only · Chinese 2% Spanish 2% Other Indo-European 2%
Political lean MEDSL · Peoria
- 2024 margin
- Toss-up / Even · D 51.5% · R 46.9% · Other 1.6%
- 2008→2024 swing
- -9.2pp toward R · 2008: 13.9pp · 2024: 4.7pp
- All cycles
- 2024: D+4.7 2020: D+6.3 2016: D+2.8 2012: D+4.4 2008: D+13.9
Not yet ingested
- Civics
- —
Market trends
- HPI YoY
- ▼ -78.59%
- Current HPI
- 175.1102
- Rent YoY
- —
- Metro
- Peoria, IL
- State GDP YoY
- ▲ 1.59%
- F500 in state
- 60
Industry mix (Fortune 500 HQ in IL)
| Industry | F500 HQs | Revenue |
|---|---|---|
| Insurance | 4 | $201B |
|
||
| Consumer Goods | 4 | $87B |
|
||
| Industrial Machinery | 3 | $64B |
|
||
| Healthcare | 2 | $55B |
|
||
| Retail / Pharmacy | 1 | $148B |
|
||
| Agriculture / Food | 1 | $86B |
|
||
Price history
+170.8% since first listed12 events — show timeline
- 2026-04-26 Listed $65,000 RMLSA as Distributed by MLS Grid
- 2025-09-08 Rental Removed $950 APPFOLIO
- 2025-08-30 Price Changed $950 APPFOLIO
- 2025-08-15 Listed for Rent $1,000 APPFOLIO
- 2025-06-27 Sold (Public Records) $31,000 Public Records
- 2021-08-06 Listing Removed — RMLSA as Distributed by MLS Grid
- 2021-08-06 Listing Removed — RMLSA as Distributed by MLS Grid
- 2021-08-06 Listing Removed — RMLSA as Distributed by MLS Grid
- 2016-08-22 Sold (MLS) $12,500 RMLSA as Distributed by MLS Grid
- 2016-05-21 Listed $12,700 RMLSA as Distributed by MLS Grid
- 2004-11-19 Sold (Public Records) $50,000 Public Records
- 2000-09-13 Sold (Public Records) $24,000 Public Records
Property tax history
+1.0%/yrLatest (2025): $734 · +4.6% YoY. Source: county tax records.
Cash-flow waterfall
monthlySold comps — $/sqft
last 12 mo · ≤1 miLoading sold comps…