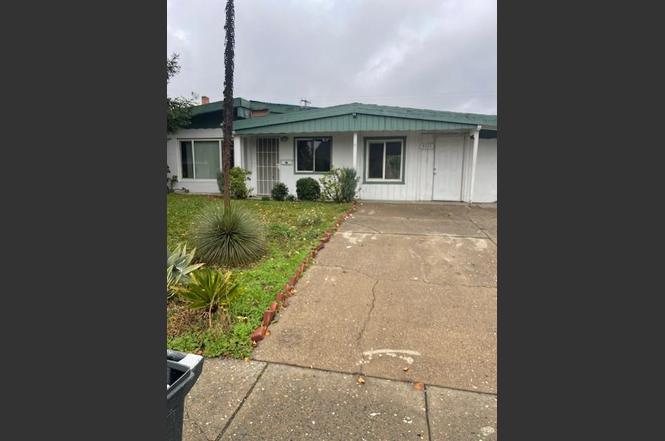
5531 27th Ave · Sacramento, CA
Flood risk 1/10 · Minimal
- FEMA flood zone
- X (unshaded)
- Chance of flooding over 30 yrs
- 0.0%
- Est. flood insurance / yr
- $507 – $1,088
Fire risk 2/10 · Minimal
- Est. fire insurance / yr
- $659 – $1,223
Heat risk 7/10 · Major
- Hot days now (above 102°F)
- 7 days/yr
- Hot days in 30 yrs
- 15 days/yr
Wind risk 1/10 · Minimal
- Chance of severe wind over 30 yrs
- —
Air-quality risk 10/10 · Severe
- Unhealthy air days now
- 28 days/yr
- Unhealthy air days in 30 yrs
- 33 days/yr
Risk factors via First Street. Map © Google.
Why this score? — see what drove the C+ grade
The composite is a weighted blend of 9 inputs, each scored 0–100. Each bar is that input's sub-score; the figure is the points it added to the 100-point composite (weight × sub-score).
- Cash flow +21.5/30.0
- ARV discount +15.0/15.0
- DSCR +6.9/10.0
- 1% rule +5.5/10.0
- Rent growth +3.7/5.0
- Livability +3.6/5.0
- Schools +3.5/10.0
- Condition / age +2.5/5.0
- Appreciation +0.0/10.0
$250,000
🖨 Deal sheet (PDF) 📄 Offer letter ✓ Due diligence
Listing remarks
3 Bedroom, 2 Bathroom, home with large Den and built in pool. Bring your Vision and Tool belt. Needs some work. This is Your Diamond in the Rough!
Key facts
- 6,534 sq ft lot
- Garage
- Built 1955
Neighborhood map
What this means for you Summary
Snapshot
- This is a 4-bed/2.0-bath single-family listed at $250k.
Deal economics
- At list price, monthly cash flow is $377 ($5k/yr) — positive.
- The deal already cash-flows at list — no discount required.
- Meets the 1% rule at list price ($3k rent vs $250k).
- Cap rate 8.1% vs local median 3.0% in Sacramento — top-decile yield for the area; either an underpriced asset or a hidden risk that comps aren't pricing in. Stress-test before assuming the spread holds.
Location & tenants
- Location reads 71/100 on livability (#218 in CA) — a middle-class / working-renter tenant base. Strengths: amenities A+, commute A+, housing A; Watch: crime F, cost of living F.
- Sacramento City Unified (urban): math 32% / reading 43% proficiency, ranked #804 of 1,400 in CA (top 57%) — families likely to look elsewhere, expect single-tenant / working-renter base with shorter leases; 63% free/reduced lunch — lower-income household profile, screen leases tightly.
- Zoned schools: Leonardo Da Vinci (797 students, 35% FRL); Hiram W. Johnson High (1,733 students, 77% FRL).
- Market conditions: Rents rising fast (+4.6%/yr); 125 active listings in the ZIP; 27 comparable units currently listed for rent nearby; rentals at typical pace (median 26d on market — plan ~3-4 weeks tenant-placement turnaround); 48% of comp listings sitting > 30 days — soft ceiling on asking rent; solid renter incomes; 6,825 units permitted in Sacramento County in 2024 (1,752 in 5+ unit buildings).
- This rent runs 40% of the median local income ($78k/yr) — at the standard rent-burdened threshold; future hikes will face affordability resistance.
Forward outlook
- Local home prices are declining (-3.0%/yr); year-one equity from $2k of loan paydown is wiped out by about $8k of value loss. Plan a longer hold.
- Sacramento County population projected at +17% by 2050 — long-run rental-demand tailwind backs the buy-and-hold thesis.
Negotiation context
- Only 10 days on market — expect competitive offers; lowballing is unlikely to land.
- Current owner paid $61k; list at $250k implies a 310% gain — meaningful room to come down on a strong offer.
Risks & watch-outs
- Watch-outs: built in 1955 — expect roof / HVAC / electrical / plumbing capex.
- Climate carrying-cost: extreme-heat days projected 7→15/yr by 2055 (HVAC capex compounding) — expect insurance premiums to compound above CPI over the hold.
Questions for the listing agent
- Built in 1955 — when were the roof, HVAC, electrical panel, plumbing, and water heater last replaced?
- Is there a deadline driving the sale (1031 exchange, divorce, estate, relocation)? That informs how much negotiation room exists.
- Schools are D-rated, which usually means shorter tenancies and higher turnover. Who's the typical renter profile here, and what's been the actual vacancy rate?
- Crime grade is F in this area — have there been break-ins, vandalism, or insurance claims at this property in the last 3 years? What carrier currently insures it and at what premium?
- What's the average days-on-market for RENTAL listings here right now (not sales)? A rising rental-DOM trend means longer vacancies and softer asking-rent achievability than the comps imply.
- What's the recent tenant-quality profile in this submarket — average credit score on applications, eviction rate, late-payment / NSF rate, and stable-employment percentage? A property-management company in the area should have these aggregated.
- How much new for-sale + rental construction is in the pipeline within 1–3 miles? Heavy new supply typically softens prices + rents 12–24 months out; constrained supply supports both.
Investment metrics
- 1% rule
- 1.05% ✓
- Cap rate
- 8.10%
- Cash-on-cash
- 6.46%
- DSCR
- 1.29
- GRM
- 8.0
CMA / ARV
- ARV (on-the-fly)
- $493,521
- Comps found
- 12
Show comp detail 12 sales within ~0.75 mi
| Address | Dist | Beds/Ba | Sqft | Sold | Price | $/sf | Match |
|---|---|---|---|---|---|---|---|
| 5522 21st Ave | 0.30mi | 3/2.0 (-1) | 1,512 (+1%) | 1mo | $560,000 | $370 | 78 |
| 5212 Cabrillo Way | 0.27mi | 5/2.0 (+1) | 1,482 (-1%) | 4mo | $450,000 | $304 | 78 |
| 5823 21st Ave | 0.39mi | 4/2.0 | 1,525 (+2%) | 5mo | $710,000 | $466 | 74 |
| 5405 59th St | 0.23mi | 4/2.0 | 1,606 (+8%) | 7mo | $472,000 | $294 | 71 |
| 4804 61st St | 0.47mi | 3/2.0 (-1) | 1,519 (+2%) | 1mo | $495,000 | $326 | 69 |
| 5400 Cabrillo Way | 0.28mi | 4/2.0 | 1,350 (-10%) | 4mo | $480,000 | $356 | 68 |
| 5200 20th Ave | 0.47mi | 3/1.0 (-1) | 1,477 (-1%) | 5mo | $375,000 | $254 | 63 |
| 5250 21st Ave | 0.34mi | 3/1.0 (-1) | 1,333 (-11%) | 3mo | $505,000 | $379 | 55 |
| 5639 59th St | 0.33mi | 3/1.0 (-1) | 1,654 (+11%) | 6mo | $275,000 | $166 | 52 |
| 5322 Argo Way | 0.37mi | 3/1.0 (-1) | 1,269 (-15%) | 5mo | $388,000 | $306 | 45 |
| 4810 47th St | 0.73mi | 4/2.0 | 1,317 (-12%) | 3mo | $465,000 | $353 | 44 |
| 4026 58th St | 0.75mi | 3/1.5 (-1) | 1,664 (+12%) | 1mo | $550,000 | $331 | 38 |
Match score weights: distance 35% · size 25% · config 20% · recency 20%. Top-matched comps best support the ARV.
Projected returns pro-forma
-3.0% appreciation · 4.62% rent growth · sell at horizon
- IRR
- -4.6%
- Equity multiple
- 0.83×
- Total profit
- $-12,161
- Equity at exit
- $37,276
- IRR
- 6.9%
- Equity multiple
- 1.55×
- Total profit
- $38,770
- Equity at exit
- $21,615
Cash invested: $70,000 (down + closing). Projections, not guarantees.
Landlord ↔ Tenant lean methodology
- Overall (STATE)
- 18 Strongly Tenant-Friendly
- State California
- 18 Strongly Tenant-Friendly · D+13
- County
- — inherits STATE
- City
- — inherits STATE
ZIP-level market 95820
- Rents YoY
- 4.6%
- Active inventory
- 125
- Price-to-rent
- 8.0×
Monthly cashflow live
- Estimated rent
- $2,618 high interval (Pro) →
- Mortgage (P&I)
- −$1,311
- Tax from tax record
- −$276 /mo · $3,315/yr
- Insurance
- −$104
- HOA
- −$0
- Lot rent
- −$0
- Vacancy / Maint / Mgmt
- −$550
- Net cashflow
- $377
Break-even live
Sensitivity live
| Price | -10% $518 | -5% $448 | +0% $377 | +5% $306 | +10% $235 |
|---|---|---|---|---|---|
| Rent | -10% $170 | -5% $273 | +0% $377 | +5% $480 | +10% $584 |
| Rate | -1.0pp $503 | -0.5pp $440 | base $377 | +0.5pp $312 | +1.0pp $246 |
UW: 25.0% down · 7.5% · 30yr · 1.5% tax · 5.0% vac · 8.0% maint · 8.0% mgmt
Financing live
Cash to close
- Down payment
- $62,500
- Closing costs
- $7,500
- Reserves months
- —
- Total cash needed
- —
Loan-product check · same deal, 3 products live
Conventional
25% down · 7.5% · 30yr
- Down + closing
- —
- Monthly P&I
- —
- Monthly cashflow
- —
- DSCR
- —
- Eligible?
- —
Personal DTI + credit; lowest rate.
DSCR
20% down · 8.5% · 30yr
- Down + closing
- —
- Monthly P&I
- —
- Monthly cashflow
- —
- DSCR
- —
- Eligible?
- —
No personal income docs; deal must DSCR.
Hard money
10% down · 12.0% · 12mo
- Down + closing
- —
- Monthly P&I
- —
- Monthly cashflow
- —
- DSCR
- —
- Eligible?
- —
Short-term bridge; refi at stabilization.
Rent comps 27 comps
| Address | Beds | Baths | Sqft | Rent | $/sqft | DOM | Units | Dist |
|---|---|---|---|---|---|---|---|---|
| 5321 57th St Sacramento, CA | 4.0 | 2.0 | 1248 | $2,399 | $1.92 | 46d | 1 | 0.11mi |
| 5834 55th St Sacramento, CA | 3.0 | 1.0 | 1027 | $2,100 | $2.04 | 18d | 1 | 0.45mi |
| 5301 20th Ave Sacramento, CA | 3.0 | 1.0 | 1053 | $2,650 | $2.52 | 46d | 1 | 0.47mi |
| 6053 36th Ave Sacramento, CA | 3.0 | 1.0 | 1166 | $2,600 | $2.23 | 46d | 1 | 0.50mi |
| 5500 38th Ave Sacramento, CA | 3.0 | 1.0 | 1100 | $2,100 | $1.91 | 46d | 1 | 0.52mi |
| 5316 Nelson St Sacramento, CA | 3.0 | 2.0 | 1018 | $2,245 | $2.21 | 14d | 1 | 0.57mi |
| 5905 Clover Manor Way Unit 5907 CLOVER Sacramento, CA | 3.0 | 1.0 | 1000 | $2,000 | $2.00 | 5d | 1 | 0.61mi |
| 5050 64th St Sacramento, CA | 3.0 | 2.0 | 1116 | $2,395 | $2.15 | 26d | 1 | 0.63mi |
| 4930 Bonniemae Way Sacramento, CA | 3.0 | 2.0 | 1289 | $2,500 | $1.94 | 46d | 1 | 0.64mi |
| 5936 Clover Manor Way Sacramento, CA | 3.0 | 2.0 | 1345 | $2,400 | $1.78 | 46d | 1 | 0.68mi |
| 4204 51st St Sacramento, CA | 3.0 | 1.0 | 1050 | $2,450 | $2.33 | 5d | 1 | 0.72mi |
| 4204 51st St Unit A Sacramento, CA | 3.0 | 1.0 | 1050 | $2,450 | $2.33 | 26d | 1 | 0.72mi |
| 4311 48th St Sacramento, CA | 3.0 | 1.0 | 1313 | $2,150 | $1.64 | 46d | 1 | 0.77mi |
| 5041 Whittier Dr Sacramento, CA | 3.0 | 1.0 | 1176 | $2,519 | $2.14 | 5d | 1 | 1.07mi |
| 5934 69th St Sacramento, CA | 3.0 | 1.0 | 1091 | $1,850 | $1.70 | 0d | 1 | 1.10mi |
| 130 Brady Ct Sacramento, CA | 3.0 | 2.0 | 1094 | $3,500 | $3.20 | 1d | 1 | 1.11mi |
| 3962 44th St Sacramento, CA | 3.0 | 3.0 | 1081 | $2,495 | $2.31 | 24d | 1 | 1.13mi |
| 3962 44th St Sacramento, CA | 3.0 | 3.0 | 1081 | $2,550 | $2.36 | 10d | 1 | 1.13mi |
| 5017 10th Ave Sacramento, CA | 3.0 | 2.0 | 1400 | $2,600 | $1.86 | 18d | 1 | 1.16mi |
| 5221 9th Ave Sacramento, CA | 3.0 | 1.5 | 1626 | $3,000 | $1.85 | 18d | 1 | 1.17mi |
| 4624 11th Ave Sacramento, CA | 4.0 | 2.0 | 1643 | $3,200 | $1.95 | 46d | 1 | 1.19mi |
| 3042 53rd St Sacramento, CA | 3.0 | 2.0 | 1115 | $2,225 | $2.00 | 46d | 1 | 1.32mi |
| 6519 Prentiss Dr Sacramento, CA | 3.0 | 2.0 | 1029 | $2,300 | $2.24 | 14d | 1 | 1.32mi |
| 3400 44th St Sacramento, CA | 3.0 | 2.5 | 1578 | $2,495 | $1.58 | 46d | 1 | 1.40mi |
| 5205 Priscilla Ln Sacramento, CA | 3.0 | 1.0 | 925 | $2,550 | $2.76 | 46d | 1 | 1.41mi |
| 5021 Priscilla Ln Sacramento, CA | 3.0 | 1.0 | 925 | $1,995 | $2.16 | 46d | 1 | 1.42mi |
| 6940 McQuillan Cir Sacramento, CA | 3.0 | 2.0 | 1551 | $2,550 | $1.64 | 46d | 1 | 1.45mi |
Listing history 2 events
-
1996-05-03soldstatus $61,000
-
1979-10-12soldstatus $48,000
ⓘ Source: listings_history table (triggers on properties + properties_extension) + one-shot
backfill from property_details.listing_events for pre-trigger history.
Tax reassessment forecast CA · Resets to sale price
- Current annual tax
- $3,315 · $276/mo
- Projected year-2 tax
- $3,315 · $276/mo
- Expected delta
- $0/yr ($0/mo · 0.0%)
ⓘ Screening estimate from a state-policy table — verify with the county assessor before closing.
Climate risk First Street
- Flood 1/10 Low FEMA zone X (unshaded) · 0% chance over 30 yrs
- Wildfire 2/10 Low
- Heat 7/10 Severe 7 d/yr ≥102°F today · 15 d/yr by 30 yrs out
- Wind 1/10 Low
- Air quality 10/10 Extreme 28 unhealthy d/yr today · 33 by 30 yrs out
Nearby sold comps map
Loading sold comps map…
Walkable amenities ~0.75 mi
Loading nearby amenities…
Taxation est. · year 1
- Rental income
- $31,416
- − Mortgage interest
- −$14,004
- − Property taxes
- −$3,315
- − Insurance
- −$1,250
- − Repairs & maintenance
- −$2,513
- − Management
- −$2,513
- − Depreciation
- −$7,273
- Taxable income
- $548
- Est. tax owed @ 24.0%
- −$131
- After-tax cash flow
- $4,390/yr
For passive investors: Depreciation is non-cash, so a rental often shows a tax loss while cash-flowing — sheltering income. Rental losses are passive: they offset passive income freely, and up to $25,000/yr can offset ordinary (W-2) income if you actively participate and your MAGI is under $100k (phasing out to $0 by $150k); unused losses carry forward. On sale, claimed depreciation is recaptured at up to 25%, and gains may owe capital-gains tax (a 1031 exchange can defer both). Figures are a year-1 estimate at your 24.0% rate — not tax advice; consult a CPA.
Schools (NCES district)
- District
- Sacramento City Unified
- NCES district ID
- 0633840
- Math proficiency
- 32% ▬ 0.00%
- Reading proficiency
- 43% ▲ 3.00%
- Median HH income
- $49,280
- Composite
- 34.86/100
- National rank
- #10000
- State rank
- #804 of 1400 in CA
Livability — Sacramento
- Score
- 71/100
- State rank
- #218
- US rank
- #6957
Category grades
Schools grade is shown separately in the Schools card above.
Census & demographics
- Census place
- Sacramento, CA
- County
- Sacramento County · 1,539,646 people
- City population
- 761,410
- Metro
- Sacramento-Roseville-Folsom, CA
- Population (ZIP)
- 35,410
- Household income
- $78,436
- Rent vs Own
- Severe rent burden
- 1255.0
Population outlook (Sacramento County) Hauer SSP2
- Today (2025)
- 1,660,763 people
- By 2030
- 1,732,990 · +4.3%
- By 2040
- 1,855,755 · +11.7%
- By 2050
- 1,941,335 · +16.9%
- By 2075
- 2,046,162 · +23.2%
- By 2100
- 1,961,444 · +18.1%
Race, ethnicity, and origin ACS 2023
- Neighborhood character
- Highly diverse neighborhood (Simpson 0.72)
- Race & ethnicity
- Hispanic / Latino 41% White 31% Two or more races 17% Black 11% Asian 11% Pacific Islander 2%
- Hispanic origin (detail)
- Mexican 34% Puerto Rican 2%
- Common ancestry
- Italian 2% Russian 1% Slovak 1%
- Foreign-born
- 19% · Canada, Vietnam, China
- Languages at home
- 65% English-only · Spanish 23% Other Asian/Pacific 5% Chinese 1%
Political lean MEDSL · Sacramento
- 2024 margin
- D (+19.7) · D 58.1% · R 38.4% · Other 3.5%
- 2008→2024 swing
- +0.7pp no change · 2008: 19.0pp · 2024: 19.7pp
- All cycles
- 2024: D+19.7 2020: D+25.3 2016: D+23.7 2012: D+16.3 2008: D+19.0
Not yet ingested
- Civics
- —
Market trends
- HPI YoY
- ▼ -473.17%
- Current HPI
- 413.4424
- Rent YoY
- ▲ 4.62%
- Metro
- Sacramento-Roseville-Folsom, CA
- State GDP YoY
- ▲ 3.21%
- F500 in state
- 116
Industry mix (Fortune 500 HQ in CA)
| Industry | F500 HQs | Revenue |
|---|---|---|
| Technology | 27 | $1,492B |
|
||
| Financial Services | 3 | $174B |
|
||
| Retail | 3 | $44B |
|
||
| Insurance | 3 | $26B |
|
||
| Media / Entertainment | 2 | $115B |
|
||
| Pharmaceuticals / Biotech | 2 | $62B |
|
||
Price history
+27.1% since first listed2 events — show timeline
- 1996-05-03 Sold (Public Records) $61,000 Public Records
- 1979-10-12 Sold (Public Records) $48,000 Public Records
Property tax history
+1.2%/yrLatest (2025): $3,315 · +24.5% YoY. Source: county tax records.
Cash-flow waterfall
monthlySold comps — $/sqft
last 12 mo · ≤1 miLoading sold comps…