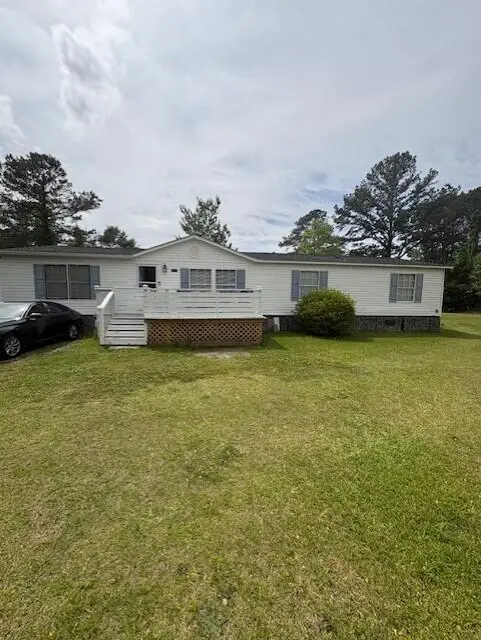
307 Glen St · Summerville, SC
Flood risk 1/10 · Minimal
- FEMA flood zone
- X (unshaded)
- Chance of flooding over 30 yrs
- 0.0%
- Est. flood insurance / yr
- $507 – $1,088
Fire risk 4/10 · Minor
- Est. fire insurance / yr
- $783 – $1,453
Heat risk 8/10 · Major
- Hot days now (above 107°F)
- 7 days/yr
- Hot days in 30 yrs
- 17 days/yr
Wind risk 8/10 · Major
- Chance of severe wind over 30 yrs
- 97.0%
Air-quality risk 3/10 · Minor
- Unhealthy air days now
- 3 days/yr
- Unhealthy air days in 30 yrs
- 3 days/yr
Risk factors via First Street. Map © Google.
Why this score? — see what drove the D- grade
The composite is a weighted blend of 9 inputs, each scored 0–100. Each bar is that input's sub-score; the figure is the points it added to the 100-point composite (weight × sub-score).
- Cash flow +12.8/30.0
- ARV discount +6.3/15.0
- Schools +4.1/10.0
- DSCR +3.8/10.0
- Livability +3.2/5.0
- Rent growth +2.9/5.0
- Condition / age +2.5/5.0
- 1% rule +2.4/10.0
- Appreciation +0.0/10.0
$299,900
🖨 Deal sheet 📄 Offer letter ✓ Due diligence
Listing remarks
Welcome to Country Living! This Beautiful and Updated 1960 Sq Ft Mobile Home has 3 bedrooms and 2 Full bathrooms. Located in Summerville SC. It Awaits Your Family. With a Center Island in the Kitchen, You can Make this the Place of Entertainment with it's Great Open Floorplan. The Spacious Livingroom is Perfect for the Holidays. The Family room with a Woodburning Fireplace is Great for All Gatherings. The Large Master Suite offers a Garden Tub and Separate Shower. With 2 Additional Good size Bedrooms. Spend your Evenings on the New Front Porch 2025! New Roof 2024, New HVAC 2024, New Hot Water Heater 2024!! New Front Porch 2025!This Property sitting on half an acer Won't Last!!
Key facts
- New front porch
- Open floorplan
- Separate shower
Tags
Property features AI
Exterior
- Parking: Off-street parking; No carport spaces
- Utilities: Public sewer; Berkeley Electric Cooperative service; Dorchester County water and sewer service
- Home design: Single-story; Manufactured double wide home; Residential property
- Construction: Double wide manufactured home; Vinyl skirting
- Exterior features: Asphalt roof; No additional structures reported; Located in the Clemson Terrace subdivision
Interior
- Kitchen: Eat-in kitchen
- Bedrooms: 3 bedrooms; Primary bedroom with ceiling fan and garden tub/shower
- Flooring: Carpet; Laminate; Vinyl
- Bathrooms: 2 bathrooms
- Heating & cooling: Central heating; Central air conditioning
- Interior features: Eat-in kitchen; Family room; Formal living room; Separate dining room; Wood-burning fireplace in family room
- Laundry & utility: Laundry room with washer and electric dryer hookups
Neighborhood map
What this means for you Summary
Snapshot
- This is a 3-bed/2.0-bath manufactured listed at $300k.
Deal economics
- At list price, monthly cash flow is $-28 ($-333/yr) — negative.
- To cash-flow at today's rent, offer at most $295k (1.6% below list).
- To meet the 1% rule (rent ≥ 1% of price), the offer needs to be $223k (25.5% below list).
- Recommended offer: $223k (25.5% below list) — sets the bar for 1% rule.
- Cap rate 6.2% vs local median 4.0% in Summerville — top-decile yield for the area; either an underpriced asset or a hidden risk that comps aren't pricing in. Stress-test before assuming the spread holds.
Location & tenants
- Location reads 63/100 on livability (#167 in SC) — a middle-class / working-renter tenant base. Strengths: housing A+, cost of living B+; Watch: amenities F, commute F, health & safety F.
- Dorchester 02 (suburban): math 40% / reading 55% proficiency, ranked #12 of 80 in SC (top 15%) — families likely to look elsewhere, expect single-tenant / working-renter base with shorter leases.
- Zoned schools: Alston-Bailey Elementary (math 38% / reading 44%, grade F, #276 of 597 statewide, top 48%, 715 students, 86% FRL); Alston Middle (math 28% / reading 45%, grade F, #98 of 229 statewide, top 43%, 822 students, 81% FRL); Summerville High (math 60% / reading 92%, grade A-, #34 of 196 statewide, top 17%, 3,308 students, 59% FRL) — zoned schools average 75% FRL vs 36% district-wide (39 pts higher); higher-poverty schools than district average — tighter screening recommended.
- Market conditions: Rents rising (+1.4%/yr); 741 active listings in the ZIP; 5 comparable units currently listed for rent nearby; rentals at typical pace (median 15d on market — plan ~3-4 weeks tenant-placement turnaround); solid renter incomes; 1,199 units permitted in Dorchester County in 2024 (0 in 5+ unit buildings).
- This rent runs 31% of the median local income ($86k/yr) — at the standard rent-burdened threshold; future hikes will face affordability resistance.
Forward outlook
- Local home prices are declining (-3.0%/yr); year-one equity from $2k of loan paydown is wiped out by about $9k of value loss. Plan a longer hold.
- Dorchester County population projected at +43% by 2050 — long-run rental-demand tailwind backs the buy-and-hold thesis.
Negotiation context
- It's been on market 43 days — a 3% lower offer ($291k) is reasonable based on typical stale-listing flexibility.
- 7 sale attempts since 4y ago with the ask held roughly flat each time — persistent listings suggest the price (not the market) is what's stuck; bring a comps-based counter.
- Current owner paid $145k; list at $300k implies a 107% gain — meaningful room to come down on a strong offer.
Risks & watch-outs
- Climate carrying-cost: severe wind risk, 97% chance of damaging wind over 30y; extreme-heat days projected 7→17/yr by 2055 (HVAC capex compounding) — expect insurance premiums to compound above CPI over the hold.
Questions for the listing agent
- What do current leases actually rent for vs. the listed asking? Can we see a recent rent roll and the last 12 months of T-12 income?
- It's been on market 43 days. Have you received any prior offers? Is the seller open to a 26% concession, seller financing, or rate buy-down credit?
- Is there a deadline driving the sale (1031 exchange, divorce, estate, relocation)? That informs how much negotiation room exists.
- Schools are B-rated — typically a magnet for longer-tenancy family renters. What's the average tenant stay here, and is there a school-zone premium baked into asking?
- The area grade is low — what's the realistic commute time and amenity access for the typical tenant pool here? Any planned neighborhood developments (good or bad) we should know about?
- What's the average days-on-market for RENTAL listings here right now (not sales)? A rising rental-DOM trend means longer vacancies and softer asking-rent achievability than the comps imply.
- What's the recent tenant-quality profile in this submarket — average credit score on applications, eviction rate, late-payment / NSF rate, and stable-employment percentage? A property-management company in the area should have these aggregated.
- How much new for-sale + rental construction is in the pipeline within 1–3 miles? Heavy new supply typically softens prices + rents 12–24 months out; constrained supply supports both.
Investment metrics
- 1% rule
- 0.74% ✗
- Cap rate
- 6.18%
- Cash-on-cash
- -0.40%
- DSCR
- 0.98
- GRM
- 11.2
CMA / ARV
- ARV (on-the-fly)
- $292,040
- Comps found
- 9
Show comp detail 9 sales within ~0.75 mi
| Address | Dist | Beds/Ba | Sqft | Sold | Price | $/sf | Match |
|---|---|---|---|---|---|---|---|
| 237 W Steele Dr | 0.17mi | 4/2.0 (+1) | 1,904 (-3%) | 3mo | $310,000 | $163 | 80 |
| 334 Glen St | 0.13mi | 3/2.0 | 1,680 (-14%) | 2mo | $273,500 | $163 | 69 |
| 173 Rambo Dr | 0.23mi | 3/2.0 | 1,904 (-3%) | 20mo | $155,000 | $81 | 67 |
| 177 W Medina St | 0.46mi | 3/2.0 | 1,904 (-3%) | 16mo | $300,000 | $158 | 61 |
| 1209 Azalea Dr | 0.49mi | 4/2.0 (+1) | 2,016 (+3%) | 13mo | $330,000 | $164 | 56 |
| 199 Lawrence Dr | 0.50mi | 3/2.0 | 1,762 (-10%) | 8mo | $249,000 | $141 | 53 |
| 250 W Medina St | 0.39mi | 4/2.0 (+1) | 2,240 (+14%) | 6mo | $225,000 | $100 | 48 |
| 111 Colkitt St | 0.24mi | 3/2.0 | 1,680 (-14%) | 22mo | $250,000 | $149 | 47 |
| 122 Rambo Dr | 0.53mi | 4/2.0 (+1) | 2,128 (+9%) | 12mo | $299,900 | $141 | 46 |
Match score weights: distance 35% · size 25% · config 20% · recency 20%. Top-matched comps best support the ARV.
Projected returns pro-forma
-3.0% appreciation · 1.45% rent growth · sell at horizon
- IRR
- -18.5%
- Equity multiple
- 0.36×
- Total profit
- $-53,931
- Equity at exit
- $44,716
- IRR
- -13.9%
- Equity multiple
- 0.24×
- Total profit
- $-63,445
- Equity at exit
- $25,930
Cash invested: $83,972 (down + closing). Projections, not guarantees.
Landlord ↔ Tenant lean methodology
- Overall (STATE)
- 90 Strongly Landlord-Friendly
- State South Carolina
- 90 Strongly Landlord-Friendly · R+6
- County
- — inherits STATE
- City
- — inherits STATE
ZIP-level market 29483
- Home prices YoY
- -34.6%
- Rents YoY
- 1.4%
- Active inventory
- 741
- Price-to-rent
- 11.2×
Monthly cashflow live
- Estimated rent
- $2,234 high interval (Pro) →
- Mortgage (P&I)
- −$1,573
- Tax from tax record
- −$95 /mo · $1,139/yr
- Insurance
- −$125
- HOA
- −$0
- Vacancy / Maint / Mgmt
- −$469
- Net cashflow
- $-28
Break-even live
UW: 25.0% down · 7.5% · 30yr · 1.5% tax · 5.0% vac · 8.0% maint · 8.0% mgmt
Financing live
Cash to close
- Down payment
- $74,975
- Closing costs
- $8,997
- Reserves months
- —
- Total cash needed
- —
Loan-product check · same deal, 3 products live
Conventional
25% down · 7.5% · 30yr
- Down + closing
- —
- Monthly P&I
- —
- Monthly cashflow
- —
- DSCR
- —
- Eligible?
- —
Personal DTI + credit; lowest rate.
DSCR
20% down · 8.5% · 30yr
- Down + closing
- —
- Monthly P&I
- —
- Monthly cashflow
- —
- DSCR
- —
- Eligible?
- —
No personal income docs; deal must DSCR.
Hard money
10% down · 12.0% · 12mo
- Down + closing
- —
- Monthly P&I
- —
- Monthly cashflow
- —
- DSCR
- —
- Eligible?
- —
Short-term bridge; refi at stabilization.
Rent comps 5 comps
| Address | Beds | Baths | Sqft | Rent | $/sqft | DOM | Units | Dist |
|---|---|---|---|---|---|---|---|---|
| 506 Green Fern Dr Summerville, SC | 3.0 | 2.5 | 1986 | $2,300 | $1.16 | 23d | 1 | 0.59mi |
| 462 Green Fern Dr Summerville, SC | 3.0 | 2.5 | 1998 | $2,100 | $1.05 | 14d | 1 | 0.65mi |
| 412 Aberdeen Cir Summerville, SC | 4.0 | 2.5 | 2189 | $2,200 | $1.01 | 3d | 1 | 0.73mi |
| 115 Tyron Rd Summerville, SC | 3.0 | 2.0 | 1452 | $2,200 | $1.52 | 23d | 1 | 0.90mi |
| 260 Pidgeon Bay Rd Summerville, SC | 2.0–3.0 | 2.0 | 1286 | $2,148 | $1.67 | 3d | 5 | 1.32mi |
Listing history 18 events
-
2026-06-01days on market $299,900 Active 43 DOM
-
2026-05-31days on market $299,900 Active 42 DOM
-
2026-04-19$299,900 Active
-
2025-11-01historical
-
2025-09-02price $295,000
-
2025-05-20$299,999 Active
-
2025-04-29historical
-
2025-03-28historical Active Under Contract
-
2025-02-13$300,000 Active
-
2025-01-31historical
-
2024-11-01$300,000 Active
-
2024-03-10historical
-
2024-03-02$285,000 Active
-
2023-06-13soldstatus $145,000
-
2023-06-12soldstatus $145,000 Closed
-
2023-05-30historical Active Under Contract
-
2023-05-18$150,000 Active
-
2022-04-26$166,500 Active
ⓘ Source: listings_history table (triggers on properties + properties_extension) + one-shot
backfill from property_details.listing_events for pre-trigger history.
Tax reassessment forecast SC · Resets to sale price
- Current annual tax
- $1,139 · $95/mo
- Projected year-2 tax
- $1,709 · $142/mo
- Expected delta
- +$571/yr (+$48/mo · 50.1%)
ⓘ Screening estimate from a state-policy table — verify with the county assessor before closing.
Climate risk First Street
- Flood 1/10 Low FEMA zone X (unshaded) · 0% chance over 30 yrs
- Wildfire 4/10 Moderate
- Heat 8/10 Severe 7 d/yr ≥107°F today · 17 d/yr by 30 yrs out
- Wind 8/10 Severe 97% chance of damaging wind over 30 yrs
- Air quality 3/10 Moderate 3 unhealthy d/yr today · 3 by 30 yrs out
Nearby sold comps map
Loading sold comps map…
Walkable amenities ~0.75 mi
Loading nearby amenities…
Taxation est. · year 1
- Rental income
- $26,808
- − Mortgage interest
- −$16,799
- − Property taxes
- −$1,139
- − Insurance
- −$1,500
- − Repairs & maintenance
- −$2,145
- − Management
- −$2,145
- − Depreciation
- −$8,724
- Taxable loss
- −$5,643
- Est. tax savings @ 24.0%
- +$1,354
- After-tax cash flow
- $1,022/yr
For passive investors: Depreciation is non-cash, so a rental often shows a tax loss while cash-flowing — sheltering income. Rental losses are passive: they offset passive income freely, and up to $25,000/yr can offset ordinary (W-2) income if you actively participate and your MAGI is under $100k (phasing out to $0 by $150k); unused losses carry forward. On sale, claimed depreciation is recaptured at up to 25%, and gains may owe capital-gains tax (a 1031 exchange can defer both). Figures are a year-1 estimate at your 24.0% rate — not tax advice; consult a CPA.
Schools (NCES district)
- District
- Dorchester 02
- NCES district ID
- 4502010
- Math proficiency
- 40% ▼ -13.00%
- Reading proficiency
- 55% ▼ -4.00%
- Median HH income
- $57,937
- Composite
- 41.41/100
- National rank
- #3475
- State rank
- #12 of 80 in SC
Livability — Summerville
- Score
- 63/100
- State rank
- #167
- US rank
- #15058
Category grades
Schools grade is shown separately in the Schools card above.
Census & demographics
- County
- Dorchester County · 182,866 people
- City population
- 171,668
- Metro
- Charleston-North Charleston, SC
- Population (ZIP)
- 59,186
- Household income
- $85,750
- Rent vs Own
- Severe rent burden
- 1309.0
Population outlook (Dorchester County) Hauer SSP2
- Today (2025)
- 186,982 people
- By 2030
- 203,967 · +9.1%
- By 2040
- 237,160 · +26.8%
- By 2050
- 267,479 · +43.1%
- By 2075
- 333,025 · +78.1%
- By 2100
- 366,560 · +96.0%
Race, ethnicity, and origin ACS 2023
- Neighborhood character
- Predominantly White (68%)
- Race & ethnicity
- White 68% Black 19% Hispanic / Latino 7% Two or more races 6% Asian 1%
- Hispanic origin (detail)
- Mexican 3% Puerto Rican 1%
- Common ancestry
- Slovak 3% Lithuanian 3% Romanian 3%
- Foreign-born
- 5% · Canada
- Languages at home
- 93% English-only · Spanish 4%
Political lean MEDSL · Dorchester
- 2024 margin
- R (+14.6) · D 41.8% · R 56.4% · Other 1.9%
- 2008→2024 swing
- +0.9pp no change · 2008: -15.5pp · 2024: -14.6pp
- All cycles
- 2024: R+14.6 2020: R+10.5 2016: R+17.5 2012: R+16.0 2008: R+15.5
Not yet ingested
- Civics
- —
Market trends
- HPI YoY
- ▼ -131.42%
- Current HPI
- 248.8406
- Rent YoY
- ▲ 1.45%
- Metro
- Charleston-North Charleston, SC
- State GDP YoY
- ▲ 4.51%
- F500 in state
- 2
Industry mix (Fortune 500 HQ in SC)
| Industry | F500 HQs | Revenue |
|---|---|---|
| Packaging | 1 | $7B |
|
||
Price history
+80.1% since first listed16 events — show timeline
- 2026-04-19 Listed $299,900 Charleston Trident MLS
- 2025-11-01 Listing Removed — Charleston Trident MLS
- 2025-09-02 Price Changed $295,000 Charleston Trident MLS
- 2025-05-20 Listed $299,999 Charleston Trident MLS
- 2025-04-29 Listing Removed — Charleston Trident MLS
- 2025-03-28 Contingent — Charleston Trident MLS
- 2025-02-13 Listed $300,000 Charleston Trident MLS
- 2025-01-31 Listing Removed — Charleston Trident MLS
- 2024-11-01 Listed $300,000 Charleston Trident MLS
- 2024-03-10 Listing Removed — Charleston Trident MLS
- 2024-03-02 Listed $285,000 Charleston Trident MLS
- 2023-06-13 Sold (Public Records) $145,000 Public Records
- 2023-06-12 Sold (MLS) $145,000 Charleston Trident MLS
- 2023-05-30 Contingent — Charleston Trident MLS
- 2023-05-18 Listed $150,000 Charleston Trident MLS
- 2022-04-26 Listed $166,500 CCAR
Property tax history
+22.8%/yrLatest (2025): $1,139 · +0.0% YoY. Source: county tax records.
Cash-flow waterfall
monthlySold comps — $/sqft
last 12 mo · ≤1 miLoading sold comps…