 Multi-family
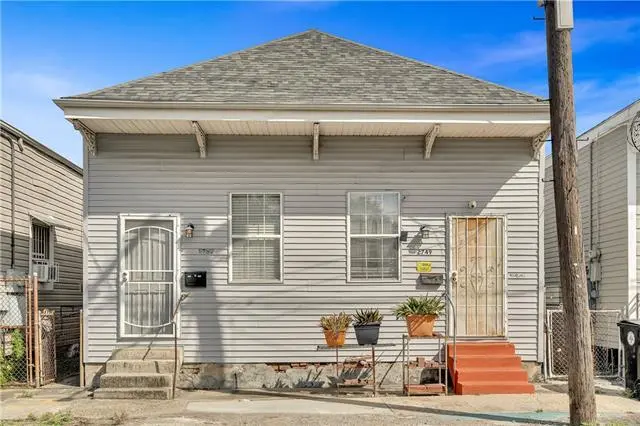
2749-51 Saint Peter St · New Orleans, LA
Flood risk 8/10 · Major
- FEMA flood zone
- X (shaded)
- Chance of flooding over 30 yrs
- 0.6%
- Est. flood insurance / yr
- $507 – $1,088
Fire risk 1/10 · Minimal
- Est. fire insurance / yr
- $1,269 – $2,357
Heat risk 10/10 · Severe
- Hot days now (above 108°F)
- 7 days/yr
- Hot days in 30 yrs
- 21 days/yr
Wind risk 10/10 · Severe
- Chance of severe wind over 30 yrs
- 99.0%
Air-quality risk 4/10 · Minor
- Unhealthy air days now
- 4 days/yr
- Unhealthy air days in 30 yrs
- 4 days/yr
Risk factors via First Street. Map © Google.
Why this score? — see what drove the B- grade
The composite is a weighted blend of 9 inputs, each scored 0–100. Each bar is that input's sub-score; the figure is the points it added to the 100-point composite (weight × sub-score).
- Cash flow +30.0/30.0
- DSCR +10.0/10.0
- 1% rule +9.9/10.0
- ARV discount +7.5/15.0
- Livability +4.0/5.0
- Rent growth +2.5/5.0
- Condition / age +2.5/5.0
- Schools +1.6/10.0
- Appreciation +0.0/10.0
$239,000
🖨 Deal sheet 📄 Offer letter ✓ Due diligence
Multi-family units
County records classify this as Multi-Family (5+ Unit). Listing-text estimate: 1 unit. estimate disagrees with records
5+ unit building — per-unit beds/baths from public records are typically unavailable; the breakdown below (if shown) is an estimate from the listing text.
Listing remarks
Invest in a Piece of New Orleans History Own a property that captures the timeless charm and character that make New Orleans so special. Rich in historic appeal, this unique home offers the opportunity to experience the culture and vibrancy of the Crescent City. Flexible Living Options Whether you're seeking owner occupancy, a long-term rental investment, or exploring short-term rental possibilities, this property offers exceptional versatility. Airbnb Potential Take advantage of New Orleans' thriving tourism industry and strong visitor demand. Prime Location Conveniently situated among some of the city's best dining, entertainment, shopping, and cultural attractions, allowing you to enjoy
Key facts
- 1,306 sq ft lot
- Listed 4 days
Property features AI
Exterior
- Parking: No designated parking
- Home design: Duplex
- Construction: Wood siding construction
- Exterior features: Composition roof; Wood siding
Interior
- Bathrooms: 4 full bathrooms
- Interior features: Central heating; Central air conditioning
Neighborhood map
What this means for you Summary
Snapshot
- This is a 4-bed/4.0-bath multifamily listed at $239k.
Deal economics
- At list price, monthly cash flow is $1k ($13k/yr) — positive.
- The deal already cash-flows at list — no discount required.
- Meets the 1% rule at list price ($4k rent vs $239k).
- Cap rate 12.1% vs local median 4.4% in New Orleans — top-decile yield for the area; either an underpriced asset or a hidden risk that comps aren't pricing in. Stress-test before assuming the spread holds.
Location & tenants
- Location reads 81/100 on livability (#3 in LA, #1,383 nationally) — a professional / high-income tenant draw. Strengths: amenities A+, commute A+, health & safety A+; Watch: crime C-, employment D.
- Orleans Parish (urban): math 11% / reading 27% proficiency, ranked #69 of 98 in LA (top 70%) — low school quality limits family demand, transient renter base, plan for 1-2y turnover; 68% free/reduced lunch — lower-income household profile, screen leases tightly.
- Market conditions: Rents soft (-0.2%/yr); 381 active listings in the ZIP; 24 comparable units currently listed for rent nearby; rentals at typical pace (median 24d on market — plan ~3-4 weeks tenant-placement turnaround); 42% of comp listings sitting > 30 days — soft ceiling on asking rent; 710 units permitted in Orleans Parish in 2024 (244 in 5+ unit buildings).
- At $3,561/mo this rent would consume 80% of the median local household income ($53k/yr) (locally 3381% of renters already pay >50% of income on rent) — very limited rent-growth headroom before tenants either downsize or default.
Forward outlook
- Local home prices are declining (-3.0%/yr); year-one equity from $2k of loan paydown is wiped out by about $7k of value loss. Plan a longer hold.
- Orleans County population projected at +61% by 2050 — long-run rental-demand tailwind backs the buy-and-hold thesis.
- At projected returns (-3.0% appreciation + 0.0% rent growth), your $67k cash investment doubles in ~9 years — after that, you're playing with house money.
Negotiation context
- Only 4 days on market — expect competitive offers; lowballing is unlikely to land.
- 2 sale attempts since 2y ago with the ask held roughly flat each time — persistent listings suggest the price (not the market) is what's stuck; bring a comps-based counter.
Risks & watch-outs
- Watch-outs: flood insurance adds $66/mo.
- Climate carrying-cost: severe flood risk; severe wind risk, 99% chance of damaging wind over 30y; extreme-heat days projected 7→21/yr by 2055 (HVAC capex compounding) — expect insurance premiums to compound above CPI over the hold.
Questions for the listing agent
- What's the actual annual flood-insurance premium (NFIP or private), and is the property in a SFHA with mandatory coverage?
- Is there a deadline driving the sale (1031 exchange, divorce, estate, relocation)? That informs how much negotiation room exists.
- What's the average days-on-market for RENTAL listings here right now (not sales)? A rising rental-DOM trend means longer vacancies and softer asking-rent achievability than the comps imply.
- What's the recent tenant-quality profile in this submarket — average credit score on applications, eviction rate, late-payment / NSF rate, and stable-employment percentage? A property-management company in the area should have these aggregated.
- How much new apartment / multifamily construction is in the pipeline within 1–3 miles? Heavy new supply (>2% of stock underway) typically softens rents 12–24 months out; light construction supports rent growth.
Investment metrics
- 1% rule
- 1.49% ✓
- Cap rate
- 12.12%
- Cash-on-cash
- 20.83%
- DSCR
- 1.93
- GRM
- 5.6
CMA / ARV
- ARV (on-the-fly)
- $499,968
- Comps found
- 12
Show comp detail 12 sales within ~0.75 mi
| Address | Dist | Beds/Ba | Sqft | Sold | Price | $/sf | Match |
|---|---|---|---|---|---|---|---|
| 2642-44 Lepage St | 0.56mi | 4/4.0 | 2,600 (-0%) | 18mo | $480,000 | $185 | 58 |
| 2734 36 Orchid St | 0.37mi | 5/2.0 (+1) | 2,730 (+5%) | 12mo | $655,000 | $240 | 52 |
| 827 29 Roosevelt Pl | 0.74mi | 4/3.0 | 2,484 (-5%) | 3mo | $430,000 | $173 | 51 |
| 934 N Gayoso St | 0.24mi | 4/3.0 | 2,240 (-14%) | 12mo | $520,000 | $232 | 51 |
| 2619 Saint Peter St | 0.15mi | 5/3.5 (+1) | 2,900 (+11%) | 19mo | $574,000 | $198 | 51 |
| 2505-09 Dumaine St | 0.31mi | 5/3.0 (+1) | 2,751 (+6%) | 19mo | $409,000 | $149 | 51 |
| 1500 N Dorgenois St | 0.66mi | 4/3.5 | 2,460 (-6%) | 10mo | $355,000 | $144 | 49 |
| 3055 57 Grand Route St. John St | 0.61mi | 4/4.0 | 2,380 (-9%) | 18mo | $500,000 | $210 | 42 |
| 2415 Columbus St | 0.68mi | 5/4.0 (+1) | 2,911 (+12%) | 3mo | $583,000 | $200 | 41 |
| 209-11 N Johnson St | 0.62mi | 5/4.0 (+1) | 2,345 (-10%) | 14mo | $215,000 | $92 | 38 |
| 2734 36 St Philip St | 0.65mi | 4/2.5 | 2,906 (+12%) | 11mo | $520,000 | $179 | 36 |
| 3521 23 Cleveland Ave | 0.73mi | 5/3.0 (+1) | 2,280 (-12%) | 11mo | $437,500 | $192 | 27 |
Match score weights: distance 35% · size 25% · config 20% · recency 20%. Top-matched comps best support the ARV.
Projected returns pro-forma
-3.0% appreciation · 0.0% rent growth · sell at horizon
- IRR
- 8.2%
- Equity multiple
- 1.31×
- Total profit
- $20,675
- Equity at exit
- $35,636
- IRR
- 14.6%
- Equity multiple
- 2.01×
- Total profit
- $67,865
- Equity at exit
- $20,664
Cash invested: $66,920 (down + closing). Projections, not guarantees.
Landlord ↔ Tenant lean methodology
- Overall (STATE)
- 90 Strongly Landlord-Friendly
- State Louisiana
- 90 Strongly Landlord-Friendly · R+12
- County
- — inherits STATE
- City
- — inherits STATE
ZIP-level market 70119
- Home prices YoY
- -34.8%
- Rents YoY
- -0.2%
- Active inventory
- 381
- Price-to-rent
- 11.2×
Monthly cashflow live
- Estimated rent
- $3,561 high interval (Pro) →
- Mortgage (P&I)
- −$1,253
- Tax est. 1.5%
- −$299 /mo · $3,585/yr
- Insurance
- −$100
- Flood insurance flood zone
- −$66 /mo · $798/yr
- HOA
- −$0
- Vacancy / Maint / Mgmt
- −$748
- Net cashflow
- $1,095
Break-even live
2-unit breakdown (identical units grouped — click to expand)
| Units | Beds | Baths | Est. rent |
|---|---|---|---|
| 2× units | 2 | 1 | $3,562 |
| #1 | 2 | 1 | $1,781 |
| #2 | 2 | 1 | $1,781 |
| Total (2 units) | $3,561 | ||
UW: 25.0% down · 7.5% · 30yr · 1.5% tax · 5.0% vac · 8.0% maint · 8.0% mgmt
Financing live
Cash to close
- Down payment
- $59,750
- Closing costs
- $7,170
- Reserves months
- —
- Total cash needed
- —
Loan-product check · same deal, 3 products live
Conventional
25% down · 7.5% · 30yr
- Down + closing
- —
- Monthly P&I
- —
- Monthly cashflow
- —
- DSCR
- —
- Eligible?
- —
Personal DTI + credit; lowest rate.
DSCR
20% down · 8.5% · 30yr
- Down + closing
- —
- Monthly P&I
- —
- Monthly cashflow
- —
- DSCR
- —
- Eligible?
- —
No personal income docs; deal must DSCR.
Hard money
10% down · 12.0% · 12mo
- Down + closing
- —
- Monthly P&I
- —
- Monthly cashflow
- —
- DSCR
- —
- Eligible?
- —
Short-term bridge; refi at stabilization.
Rent comps 24 comps
| Address | Beds | Baths | Sqft | Rent | $/sqft | DOM | Units | Dist |
|---|---|---|---|---|---|---|---|---|
| 2731 Saint Philip St Unit 2733 New Orleans, LA | 4.0 | 2.0 | 2000 | $2,600 | $1.30 | 23d | 1 | 0.24mi |
| 3024 Esplanade Ave New Orleans, LA | 3.0 | 2.5 | 2300 | $4,500 | $1.96 | 43d | 1 | 0.55mi |
| 2664 Lepage St New Orleans, LA | 3.0 | 2.0 | 1750 | $2,725 | $1.56 | 43d | 1 | 0.56mi |
| 227 S Gayoso St Unit 2h New Orleans, LA | 3.0 | 2.0 | 1800 | $2,500 | $1.39 | 43d | 1 | 0.58mi |
| 3232 Grand Rte Saint John St New Orleans, LA | 3.0 | 3.0 | 2800 | $5,000 | $1.79 | 23d | 1 | 0.60mi |
| 2331 Columbus St New Orleans, LA | 3.0 | 1.0 | 1976 | $1,850 | $0.94 | 23d | 1 | 0.69mi |
| 324 N Roman St New Orleans, LA | 3.0 | 3.0 | 2100 | $2,500 | $1.19 | 43d | 1 | 0.71mi |
| 1433 Esplanade Ave New Orleans, LA | 3.0 | 2.0 | 2411 | $5,000 | $2.07 | 2d | 1 | 1.00mi |
| 4600 S Carrollton Ave Unit 2B New Orleans, LA | 4.0 | 2.0 | 2097 | $2,850 | $1.36 | 23d | 1 | 1.08mi |
| 4227 Saint Ann St New Orleans, LA | 3.0 | 2.0 | 1900 | $2,800 | $1.47 | 3d | 1 | 1.11mi |
| 1021 Henriette Delille St New Orleans, LA | 3.0 | 2.0 | 2012 | $2,250 | $1.12 | 17d | 1 | 1.13mi |
| 618 N Rampart St #204 New Orleans, LA | 3.0 | 2.5 | 1904 | $4,500 | $2.36 | 43d | 1 | 1.20mi |
| 1831 N Miro St New Orleans, LA | 3.0 | 2.0 | 1882 | $2,500 | $1.33 | 43d | 1 | 1.21mi |
| 811 Burgundy St New Orleans, LA | 4.0 | 2.5 | 2059 | $5,000 | $2.43 | 43d | 1 | 1.25mi |
| 1901 Gentilly Blvd New Orleans, LA | 3.0 | 2.5 | 2205 | $4,000 | $1.81 | 43d | 1 | 1.26mi |
| 1000 Saint Philip St New Orleans, LA | 3.0 | 2.5 | 2650 | $4,800 | $1.81 | 43d | 1 | 1.26mi |
| 1011 Canal St Unit 1513939P New Orleans, LA | 4.0 | 4.0 | 1765 | $11,253 | $6.38 | 23d | 1 | 1.30mi |
| 939 Iberville St New Orleans, LA | 1.0–3.0 | 1.0 | 1502 | $3,800 | $2.53 | 11d | 7 | 1.33mi |
| 839 Dumaine St New Orleans, LA | 3.0 | 4.0 | 2740 | $6,500 | $2.37 | 43d | 1 | 1.34mi |
| 1936 N Johnson St Unit 36 New Orleans, LA | 3.0 | 2.0 | 1844 | $2,400 | $1.30 | 23d | 1 | 1.36mi |
| 1938 N Johnson St Unit 38 New Orleans, LA | 3.0 | 2.0 | 1844 | $2,400 | $1.30 | 23d | 1 | 1.36mi |
| 1860 Burgundy St New Orleans, LA | 4.0 | 4.0 | 3000 | $3,500 | $1.17 | 23d | 1 | 1.45mi |
| 2920 Pauger St New Orleans, LA | 4.0 | 2.0 | 1882 | $1,995 | $1.06 | 23d | 1 | 1.48mi |
| 4120 Erato St New Orleans, LA | 3.0 | 2.0 | 2250 | $1,750 | $0.78 | 23d | 1 | 1.49mi |
Listing history 5 events
-
2026-06-18days on market $239,000 Active 4 DOM
-
2026-06-17days on market $239,000 Active 3 DOM
-
2026-06-16days on market $239,000 Active 2 DOM
-
2026-06-15remarks 699-char remark
-
2026-06-15$239,000 Active 1 DOM
ⓘ Source: listings_history table (triggers on properties + properties_extension) + one-shot
backfill from property_details.listing_events for pre-trigger history.
Climate risk First Street
- Flood 8/10 Severe FEMA zone X (shaded) · 60% chance over 30 yrs
- Wildfire 1/10 Low
- Heat 10/10 Extreme 7 d/yr ≥108°F today · 21 d/yr by 30 yrs out
- Wind 10/10 Extreme 99% chance of damaging wind over 30 yrs
- Air quality 4/10 Moderate 4 unhealthy d/yr today · 4 by 30 yrs out
Nearby sold comps map
Loading sold comps map…
Walkable amenities ~0.75 mi
Loading nearby amenities…
Taxation est. · year 1
- Rental income
- $42,732
- − Mortgage interest
- −$13,388
- − Property taxes
- −$3,585
- − Insurance
- −$1,992
- − Repairs & maintenance
- −$3,419
- − Management
- −$3,419
- − Depreciation
- −$6,953
- Taxable income
- $9,977
- Est. tax owed @ 24.0%
- −$2,394
- After-tax cash flow
- $10,746/yr
For passive investors: Depreciation is non-cash, so a rental often shows a tax loss while cash-flowing — sheltering income. Rental losses are passive: they offset passive income freely, and up to $25,000/yr can offset ordinary (W-2) income if you actively participate and your MAGI is under $100k (phasing out to $0 by $150k); unused losses carry forward. On sale, claimed depreciation is recaptured at up to 25%, and gains may owe capital-gains tax (a 1031 exchange can defer both). Figures are a year-1 estimate at your 24.0% rate — not tax advice; consult a CPA.
Schools (NCES district)
- District
- Orleans Parish
- NCES district ID
- 2201170
- Math proficiency
- 11% ▼ -52.00%
- Reading proficiency
- 27% ▼ -46.00%
- Median HH income
- $37,011
- Composite
- 15.78/100
- National rank
- #9271
- State rank
- #69 of 98 in LA
Livability — New Orleans
- Score
- 81/100
- State rank
- #3
- US rank
- #1383
Category grades
Schools grade is shown separately in the Schools card above.
Census & demographics
- Census place
- New Orleans, LA
- County
- Orleans Parish · 338,817 people
- City population
- 338,817
- Metro
- New Orleans-Metairie, LA
- Population (ZIP)
- 37,253
- Household income
- $53,143
- Rent vs Own
- Severe rent burden
- 3381.0
Population outlook (Orleans County) Hauer SSP2
- Today (2025)
- 513,025 people
- By 2030
- 575,781 · +12.2%
- By 2040
- 700,174 · +36.5%
- By 2050
- 826,541 · +61.1%
- By 2075
- 1,123,374 · +119.0%
- By 2100
- 1,355,609 · +164.2%
Race, ethnicity, and origin ACS 2023
- Neighborhood character
- Diverse neighborhood (Simpson 0.64)
- Race & ethnicity
- Black 44% White 40% Two or more races 10% Hispanic / Latino 9% Asian 1%
- Hispanic origin (detail)
- Mexican 2%
- Common ancestry
- Lithuanian 8% Slovak 2% Romanian 1%
- Foreign-born
- 6% · Canada, Jamaica
- Languages at home
- 91% English-only · Spanish 6% French/Haitian/Cajun 1% Other Indo-European 0%
Political lean MEDSL · Orleans
- 2024 margin
- Solid D (+67.0) · D 82.2% · R 15.2% · Other 2.7%
- 2008→2024 swing
- +6.7pp toward D · 2008: 60.3pp · 2024: 67.0pp
- All cycles
- 2024: D+67.0 2020: D+68.2 2016: D+66.2 2012: D+62.5 2008: D+60.3
Not yet ingested
- Civics
- —
Market trends
- HPI YoY
- ▼ -135.38%
- Current HPI
- 253.1929
- Rent YoY
- ▼ -0.20%
- Metro
- New Orleans-Metairie, LA
- State GDP YoY
- ▲ 3.29%
- F500 in state
- 10
Industry mix (Fortune 500 HQ in LA)
| Industry | F500 HQs | Revenue |
|---|---|---|
| Telecommunications | 2 | $23B |
|
||
| Utilities | 1 | $12B |
|
||
| Wholesale / Distribution | 1 | $5B |
|
||
| Advertising | 1 | $2B |
|
||
Price history
-7.7% since first listed3 events — show timeline
- 2026-06-14 Listed $239,000 AcadianaMLS
- 2024-12-05 Price Changed $249,000 AcadianaMLS
- 2024-11-20 Listed $259,000 AcadianaMLS
Cash-flow waterfall
monthlySold comps — $/sqft
last 12 mo · ≤1 miLoading sold comps…