1205 Kansas Ave S · Anahuac, TX
Flood risk 5/10 · Moderate
- FEMA flood zone
- X (unshaded)
- Chance of flooding over 30 yrs
- 0.24%
- Est. flood insurance / yr
- $507 – $1,088
Fire risk 3/10 · Minor
- Est. fire insurance / yr
- $1,222 – $2,270
Heat risk 10/10 · Severe
- Hot days now (above 112°F)
- 7 days/yr
- Hot days in 30 yrs
- 27 days/yr
Wind risk 9/10 · Severe
- Chance of severe wind over 30 yrs
- 99.0%
Air-quality risk 2/10 · Minimal
- Unhealthy air days now
- 1 days/yr
- Unhealthy air days in 30 yrs
- 1 days/yr
Risk factors via First Street. Map © Google.
Why this score? — see what drove the B+ grade
The composite is a weighted blend of 9 inputs, each scored 0–100. Each bar is that input's sub-score; the figure is the points it added to the 100-point composite (weight × sub-score).
- Cash flow +29.1/30.0
- ARV discount +15.0/15.0
- DSCR +10.0/10.0
- 1% rule +8.9/10.0
- Schools +3.5/10.0
- Livability +3.5/5.0
- Rent growth +2.5/5.0
- Condition / age +2.5/5.0
- Appreciation +0.0/10.0
$150,000
🖨 Deal sheet 📄 Offer letter ✓ Due diligence
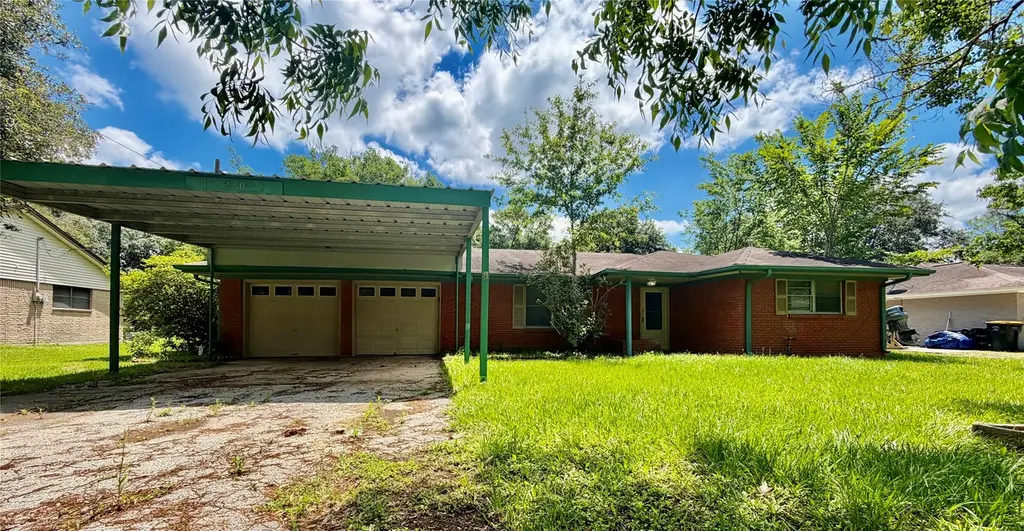
Listing remarks
Nestled in the heart of Anahuac, this solid brick home exudes charm and functionality! As you step through the front door, you're greeted by the warm and inviting living room with fresh paint and gleaming hardwood floors. The home flows effortlessly into the kitchen which is thoughtfully designed for practicality and perfect for hosting. Outside, a fenced backyard provides a private retreat, ideal for relaxing or gardening. Situated on approximately 1/2 acre, this property offers both space and tranquility, embodying the best of small-town living. Centrally located between Houston and Beaumont!
Key facts
- Private retreat
- Fenced backyard
- Solid brick home
Tags
Property features AI
Finance
- Financial info: Lease not considered
Exterior
- Parking: Attached garage; 2 garage spaces; Additional parking
- Utilities: Public water; Public sewer
- Home design: Residential property; Built in 1966; Slab foundation; Composition roof; Asphalt road access
- Construction: Brick and wood siding construction
- Exterior features: Back yard fence; Subdivision lot
Interior
- Kitchen: Dishwasher; Disposal; Refrigerator
- Bedrooms: Total of 4 rooms (including bedrooms and living spaces)
- Flooring: Laminate; Tile
- Bathrooms: 2 full bathrooms
- Heating & cooling: Central heating (electric); Central air (electric); Thermostat (programmable)
- Interior features: Kitchen/family room combo; Kitchen/dining combo; Pots & pan drawers; Separate shower; Tub/shower; Vanity; Ceiling fans; Programmable thermostat
- Laundry & utility: Washer hookup; Electric dryer hookup; Washer (appliance present)
Neighborhood map
What this means for you Summary
Snapshot
- This is a 3-bed/2.0-bath single-family listed at $150k.
Deal economics
- At list price, monthly cash flow is $516 ($6k/yr) — positive.
- The deal already cash-flows at list — no discount required.
- Meets the 1% rule at list price ($2k rent vs $150k).
- Cap rate 10.4% vs local median 3.9% in Anahuac — top-decile yield for the area; either an underpriced asset or a hidden risk that comps aren't pricing in. Stress-test before assuming the spread holds.
Location & tenants
- Location reads 70/100 on livability (#365 in TX) — a middle-class / working-renter tenant base. Strengths: cost of living A+, housing A+, crime A; Watch: employment C-, amenities F, commute F.
- Anahuac ISD (rural): math 41% / reading 41% proficiency, ranked #373 of 826 in TX (top 45%) — families likely to look elsewhere, expect single-tenant / working-renter base with shorter leases.
- Zoned schools: Anahuac Middle (math 52% / reading 46%, grade C-, #378 of 1,662 statewide, top 23%, 326 students, 61% FRL); Anahuac H S (math 37% / reading 62%, grade D, #509 of 1,632 statewide, top 34%, 454 students, 58% FRL).
- Market conditions: 145 active listings in the ZIP; 629 units permitted in Chambers County in 2024 (0 in 5+ unit buildings).
Forward outlook
- Local home prices are declining (-3.0%/yr); year-one equity from $1k of loan paydown is wiped out by about $4k of value loss. Plan a longer hold.
- Chambers County population projected at +46% by 2050 — long-run rental-demand tailwind backs the buy-and-hold thesis.
- At projected returns (-3.0% appreciation + 3.0% rent growth), your $42k cash investment doubles in ~8 years — after that, you're playing with house money.
Negotiation context
- Only 13 days on market — expect competitive offers; lowballing is unlikely to land.
- Current owner paid $125k; 20% above their basis — modest negotiation headroom, anchor on the comps not their cost.
Risks & watch-outs
- Climate carrying-cost: moderate flood risk; severe wind risk, 99% chance of damaging wind over 30y; extreme-heat days projected 7→27/yr by 2055 (HVAC capex compounding) — expect insurance premiums to compound above CPI over the hold.
Questions for the listing agent
- Built in 1966 — when were the roof, HVAC, electrical panel, plumbing, and water heater last replaced?
- Is there a deadline driving the sale (1031 exchange, divorce, estate, relocation)? That informs how much negotiation room exists.
- What's the average days-on-market for RENTAL listings here right now (not sales)? A rising rental-DOM trend means longer vacancies and softer asking-rent achievability than the comps imply.
- What's the recent tenant-quality profile in this submarket — average credit score on applications, eviction rate, late-payment / NSF rate, and stable-employment percentage? A property-management company in the area should have these aggregated.
- How much new for-sale + rental construction is in the pipeline within 1–3 miles? Heavy new supply typically softens prices + rents 12–24 months out; constrained supply supports both.
Investment metrics
- 1% rule
- 1.39% ✓
- Cap rate
- 10.42%
- Cash-on-cash
- 14.75%
- DSCR
- 1.66
- GRM
- 6.0
CMA / ARV
- ARV (median comp)
- $225,357
- List price
- $150,000
- Delta
- -33.44%
- Verdict
- UNDERPRICED
- Comps
- 20 within 1.0 mi
Show comp detail 12 sales within ~0.75 mi
| Address | Dist | Beds/Ba | Sqft | Sold | Price | $/sf | Match |
|---|---|---|---|---|---|---|---|
| 1203 Kansas Ave S | 0.02mi | 3/2.0 | 1,584 (+5%) | 1mo | $199,900 | $126 | 90 |
| 606 Lazy Ln | 0.13mi | 2/1.0 (-1) | 1,478 (-2%) | 5mo | $180,000 | $122 | 77 |
| 805 Belton | 0.34mi | 3/2.0 | 1,500 (-1%) | 17mo | $257,900 | $172 | 68 |
| 1005 S Kansas Ave | 0.10mi | 2/1.0 (-1) | 1,606 (+6%) | 16mo | $105,000 | $65 | 63 |
| 902 Wilham St | 0.13mi | 4/2.0 (+1) | 1,660 (+10%) | 15mo | $275,000 | $166 | 60 |
| 1302 Trinity St | 0.56mi | 3/2.0 | 1,368 (-10%) | 1mo | $295,000 | $216 | 58 |
| 601 Beaumont St | 0.46mi | 3/2.0 | 1,608 (+6%) | 13mo | $156,000 | $97 | 57 |
| 407 Lazy Ln | 0.29mi | 2/2.0 (-1) | 1,720 (+14%) | 4mo | $140,000 | $81 | 55 |
| 712 Stowell St | 0.52mi | 3/2.0 | 1,333 (-12%) | 4mo | $185,000 | $139 | 52 |
| 607 Beaumont St | 0.45mi | 3/2.0 | 1,327 (-12%) | 17mo | $226,900 | $171 | 45 |
| 1215 Trinity St | 0.57mi | 3/1.0 | 1,602 (+6%) | 20mo | $59,000 | $37 | 43 |
| 1301 Trinity St | 0.58mi | 3/2.0 | 1,707 (+13%) | 13mo | $190,000 | $111 | 41 |
Match score weights: distance 35% · size 25% · config 20% · recency 20%. Top-matched comps best support the ARV.
Projected returns pro-forma
-3.0% appreciation · 3.0% rent growth · sell at horizon
- IRR
- 5.3%
- Equity multiple
- 1.21×
- Total profit
- $8,670
- Equity at exit
- $22,365
- IRR
- 14.8%
- Equity multiple
- 2.20×
- Total profit
- $50,268
- Equity at exit
- $12,969
Cash invested: $42,000 (down + closing). Projections, not guarantees.
Landlord ↔ Tenant lean methodology
- Overall (STATE)
- 87 Strongly Landlord-Friendly
- State Texas
- 87 Strongly Landlord-Friendly · R+5
- County
- — inherits STATE
- City
- — inherits STATE
ZIP-level market 77514
- Home prices YoY
- -23.3%
- Active inventory
- 145
- Price-to-rent
- 6.0×
Monthly cashflow live
- Estimated rent
- $2,091 medium interval (Pro) →
- Mortgage (P&I)
- −$787
- Tax from tax record
- −$287 /mo · $3,440/yr
- Insurance
- −$62
- HOA
- −$0
- Vacancy / Maint / Mgmt
- −$439
- Net cashflow
- $516
Break-even live
UW: 25.0% down · 7.5% · 30yr · 1.5% tax · 5.0% vac · 8.0% maint · 8.0% mgmt
Financing live
Cash to close
- Down payment
- $37,500
- Closing costs
- $4,500
- Reserves months
- —
- Total cash needed
- —
Loan-product check · same deal, 3 products live
Conventional
25% down · 7.5% · 30yr
- Down + closing
- —
- Monthly P&I
- —
- Monthly cashflow
- —
- DSCR
- —
- Eligible?
- —
Personal DTI + credit; lowest rate.
DSCR
20% down · 8.5% · 30yr
- Down + closing
- —
- Monthly P&I
- —
- Monthly cashflow
- —
- DSCR
- —
- Eligible?
- —
No personal income docs; deal must DSCR.
Hard money
10% down · 12.0% · 12mo
- Down + closing
- —
- Monthly P&I
- —
- Monthly cashflow
- —
- DSCR
- —
- Eligible?
- —
Short-term bridge; refi at stabilization.
Listing history 2 events
-
2026-05-15$150,000 Active 602-char remark
-
2025-11-07soldstatus $125,000
ⓘ Source: listings_history table (triggers on properties + properties_extension) + one-shot
backfill from property_details.listing_events for pre-trigger history.
Tax reassessment forecast TX · Resets to sale price
- Current annual tax
- $3,440 · $287/mo
- Projected year-2 tax
- $3,440 · $287/mo
- Expected delta
- $0/yr ($0/mo · 0.0%)
ⓘ Screening estimate from a state-policy table — verify with the county assessor before closing.
Climate risk First Street
- Flood 5/10 Major FEMA zone X (unshaded) · 24% chance over 30 yrs
- Wildfire 3/10 Moderate
- Heat 10/10 Extreme 7 d/yr ≥112°F today · 27 d/yr by 30 yrs out
- Wind 9/10 Extreme 99% chance of damaging wind over 30 yrs
- Air quality 2/10 Low 1 unhealthy d/yr today · 1 by 30 yrs out
Nearby sold comps map
Loading sold comps map…
Walkable amenities ~0.75 mi
Loading nearby amenities…
Taxation est. · year 1
- Rental income
- $25,095
- − Mortgage interest
- −$8,402
- − Property taxes
- −$3,440
- − Insurance
- −$750
- − Repairs & maintenance
- −$2,008
- − Management
- −$2,008
- − Depreciation
- −$4,364
- Taxable income
- $4,124
- Est. tax owed @ 24.0%
- −$990
- After-tax cash flow
- $5,206/yr
For passive investors: Depreciation is non-cash, so a rental often shows a tax loss while cash-flowing — sheltering income. Rental losses are passive: they offset passive income freely, and up to $25,000/yr can offset ordinary (W-2) income if you actively participate and your MAGI is under $100k (phasing out to $0 by $150k); unused losses carry forward. On sale, claimed depreciation is recaptured at up to 25%, and gains may owe capital-gains tax (a 1031 exchange can defer both). Figures are a year-1 estimate at your 24.0% rate — not tax advice; consult a CPA.
Schools (NCES district)
- District
- Anahuac ISD
- NCES district ID
- 4808190
- Math proficiency
- 41% ▼ -22.00%
- Reading proficiency
- 41% ▼ -7.00%
- Median HH income
- $46,714
- Composite
- 35.02/100
- National rank
- #5043
- State rank
- #373 of 826 in TX
Livability — Anahuac
- Score
- 70/100
- State rank
- #365
- US rank
- #7791
Category grades
Schools grade is shown separately in the Schools card above.
Census & demographics
- Census place
- Anahuac, TX
- Population (ZIP)
- 5,213
Population outlook (Chambers County) Hauer SSP2
- Today (2025)
- 46,946 people
- By 2030
- 51,094 · +8.8%
- By 2040
- 59,578 · +26.9%
- By 2050
- 68,318 · +45.5%
- By 2075
- 90,485 · +92.7%
- By 2100
- 104,885 · +123.4%
Race, ethnicity, and origin ACS 2023
- Neighborhood character
- Diverse neighborhood (Simpson 0.61)
- Race & ethnicity
- White 55% Hispanic / Latino 29% Two or more races 13% Black 10% Asian 3%
- Hispanic origin (detail)
- Mexican 28%
- Common ancestry
- Lithuanian 4% Slovak 2% Scandinavian 1%
- Foreign-born
- 12% · Canada, Vietnam
- Languages at home
- 73% English-only · Spanish 23% Vietnamese 3%
Political lean MEDSL · Chambers
- 2024 margin
- Solid R (+65.6) · D 16.8% · R 82.4%
- 2008→2024 swing
- -14.4pp toward R · 2008: -51.2pp · 2024: -65.6pp
- All cycles
- 2024: R+65.6 2020: R+61.7 2016: R+62.1 2012: R+61.1 2008: R+51.2
Not yet ingested
- Civics
- —
Market trends
- HPI YoY
- ▼ -61.88%
- Current HPI
- 203.8454
- Rent YoY
- —
- Metro
- —
- State GDP YoY
- ▲ 3.95%
- F500 in state
- 110
Industry mix (Fortune 500 HQ in TX)
| Industry | F500 HQs | Revenue |
|---|---|---|
| Energy | 16 | $1,198B |
|
||
| Technology | 5 | $198B |
|
||
| Engineering / Construction | 4 | $72B |
|
||
| Energy Services | 3 | $60B |
|
||
| Utilities | 3 | $41B |
|
||
| Healthcare | 2 | $330B |
|
||
Price history
+20.0% since first listed4 events — show timeline
- 2026-05-28 Pending — HARMLS
- 2026-05-21 Pending — HARMLS
- 2026-05-15 Listed $150,000 HARMLS
- 2025-11-07 Sold (Public Records) $125,000 Public Records
Property tax history
+4.7%/yrLatest (2025): $3,440 · +4.2% YoY. Source: county tax records.
Cash-flow waterfall
monthlySold comps — $/sqft
last 12 mo · ≤1 miLoading sold comps…