6000 E Camelback Rd #7707 · Phoenix, AZ
Flood risk No data
- FEMA flood zone
- —
- Chance of flooding over 30 yrs
- —
- Est. flood insurance / yr
- —
Fire risk No data
- Est. fire insurance / yr
- —
Heat risk No data
- Hot days now (above threshold)
- —
- Hot days in 30 yrs
- —
Wind risk No data
- Chance of severe wind over 30 yrs
- —
Air-quality risk No data
- Unhealthy air days now
- —
- Unhealthy air days in 30 yrs
- —
Risk factors via First Street. Map © Google.
Why this score? — see what drove the B grade
The composite is a weighted blend of 9 inputs, each scored 0–100. Each bar is that input's sub-score; the figure is the points it added to the 100-point composite (weight × sub-score).
- Cash flow +30.0/30.0
- 1% rule +10.0/10.0
- DSCR +10.0/10.0
- ARV discount +7.5/15.0
- Schools +4.8/10.0
- Condition / age +4.8/5.0
- Livability +3.8/5.0
- Rent growth +2.1/5.0
- Appreciation +0.0/10.0
$125,000
🖨 Deal sheet 📄 Offer letter ✓ Due diligence
Listing remarks MLS
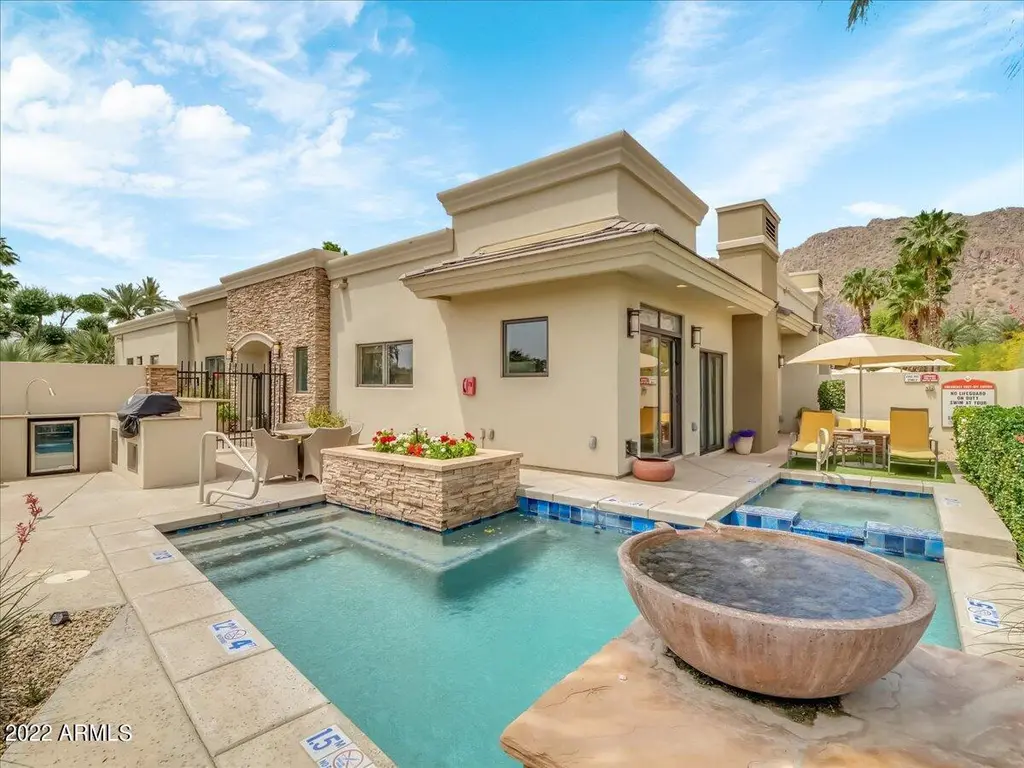
FRACTIONAL OWNERSHIP - 3 WEEKS PER YEAR. Own a piece of The Phoenician resort with this spacious 3 bedroom + den, 3 1/2 bath villa! Complete with a private pool, hot tub, outdoor grill, fire pit, fireplace, and full kitchen with twice daily housekeeping. This end unit enjoys golf course and mountain views from the patio. The unit comes w/its own concierge service and golf cart to use on the property + amenities of the hotel. You will enjoy week 11 and week 47 with one floating summer week per year. Week 11 is typically during spring training and 47 is usually over the Thanksgiving holiday. Only 1 spring or fall week is required to be used here & unused weeks can be converted to Marriott points for use elsewhere. Yearly dues in 2026 were $27,883 - already paid by seller!
Key facts
- Private pool
- Full kitchen
- Hot tub
Tags
Neighborhood map
What this means for you Summary
Snapshot
- This is a 3-bed/3.5-bath townhouse listed at $125k. Condition is rated excellent.
Deal economics
- At list price, monthly cash flow is $2k ($19k/yr) — positive.
- The deal already cash-flows at list — no discount required.
- Meets the 1% rule at list price ($3k rent vs $125k).
- Recommended offer: $110k (12.0% below list) — sets the bar for market timing.
- Cap rate 21.9% vs local median 3.3% in Phoenix — top-decile yield for the area; either an underpriced asset or a hidden risk that comps aren't pricing in. Stress-test before assuming the spread holds.
Location & tenants
- Location reads 75/100 on livability (#16 in AZ, #3,924 nationally) — a middle-class / working-renter tenant base. Strengths: amenities A+, commute A+, housing A+; Watch: health & safety C-, crime F.
- Scottsdale Unified District (4240) (urban): math 53% / reading 55% proficiency, ranked #30 of 249 in AZ (top 12%) — acceptable for families but not a draw, mixed tenant base, ~2y average lease.
- Market conditions: Rents soft (-1.6%/yr); 582 active listings in the ZIP; 39 comparable units currently listed for rent nearby; rentals lingering (median 44d on market — plan ~5-8 weeks vacancy on turnover, expect pricing pressure); 51% of comp listings sitting > 30 days — soft ceiling on asking rent; solid renter incomes; 36,011 units permitted in Maricopa County in 2024 (12,801 in 5+ unit buildings).
- This rent runs 41% of the median local income ($93k/yr) — at the standard rent-burdened threshold; future hikes will face affordability resistance.
Forward outlook
- Local home prices are declining (-3.0%/yr); year-one equity from $864 of loan paydown is wiped out by about $4k of value loss. Plan a longer hold.
- Maricopa County population projected at +38% by 2050 — long-run rental-demand tailwind backs the buy-and-hold thesis.
- At projected returns (-3.0% appreciation + 0.0% rent growth), your $35k cash investment doubles in ~3 years — after that, you're playing with house money.
Negotiation context
- It's been on market 136 days — a 12% lower offer ($110k) is reasonable based on typical stale-listing flexibility.
- 7 sale attempts since 5y ago with the ask held roughly flat each time — persistent listings suggest the price (not the market) is what's stuck; bring a comps-based counter.
Questions for the listing agent
- It's been on market 136 days. Have you received any prior offers? Is the seller open to a 12% concession, seller financing, or rate buy-down credit?
- Why hasn't it sold? Are there any deal-killer items the seller is aware of (foundation, flood, title, zoning, code violations)?
- Is there a deadline driving the sale (1031 exchange, divorce, estate, relocation)? That informs how much negotiation room exists.
- Crime grade is F in this area — have there been break-ins, vandalism, or insurance claims at this property in the last 3 years? What carrier currently insures it and at what premium?
- What's the average days-on-market for RENTAL listings here right now (not sales)? A rising rental-DOM trend means longer vacancies and softer asking-rent achievability than the comps imply.
- What's the recent tenant-quality profile in this submarket — average credit score on applications, eviction rate, late-payment / NSF rate, and stable-employment percentage? A property-management company in the area should have these aggregated.
- How much new for-sale + rental construction is in the pipeline within 1–3 miles? Heavy new supply typically softens prices + rents 12–24 months out; constrained supply supports both.
Investment metrics
- 1% rule
- 2.52% ✓
- Cap rate
- 21.85%
- Cash-on-cash
- 55.57%
- DSCR
- 3.47
- GRM
- 3.3
CMA / ARV
- ARV (median comp)
- $2,780,002
- List price
- $125,000
- Delta
- -95.50%
- Verdict
- UNDERPRICED
- Comps
- 20 within 1.0 mi
Show comp detail 12 sales within ~0.75 mi
| Address | Dist | Beds/Ba | Sqft | Sold | Price | $/sf | Match |
|---|---|---|---|---|---|---|---|
| 4849 N Camelback Ridge Dr Unit B206 | 0.18mi | 2/3.0 (-1) | 2,510 (+3%) | 4mo | $2,603,851 | $1,037 | 76 |
| 4849 N Camelback Ridge Dr Unit B306 | 0.18mi | 2/3.0 (-1) | 2,510 (+3%) | 5mo | $3,125,496 | $1,245 | 75 |
| 4849 N Camelback Ridge Dr Unit A208 | 0.18mi | 2/3.0 (-1) | 2,609 (+7%) | 1mo | $3,150,000 | $1,207 | 72 |
| 4849 N Camelback Ridge Dr Unit A211 | 0.18mi | 2/3.0 (-1) | 2,594 (+7%) | 3mo | $3,150,000 | $1,214 | 71 |
| 4849 N Camelback Ridge Dr Unit A402 | 0.18mi | 2/2.0 (-1) | 2,592 (+7%) | 2mo | $3,717,047 | $1,434 | 68 |
| 4849 N Camelback Ridge Dr Unit B205 | 0.18mi | 2/3.0 (-1) | 2,157 (-11%) | 5mo | $2,500,546 | $1,159 | 62 |
| 4849 N Camelback Ridge Dr Unit A304 | 0.18mi | 2/2.5 (-1) | 2,157 (-11%) | 4mo | $2,990,000 | $1,386 | 61 |
| 4849 N Camelback Ridge Rd Unit A104 | 0.18mi | 2/2.5 (-1) | 2,157 (-11%) | 4mo | $2,995,000 | $1,389 | 61 |
| 4849 N Camelback Ridge Dr Unit B105 | 0.18mi | 2/2.0 (-1) | 2,068 (-15%) | 4mo | $2,673,870 | $1,293 | 52 |
| 4525 N 66th St #65 | 0.66mi | 3/2.0 | 2,109 (-13%) | 2mo | $599,900 | $284 | 40 |
| 5101 N Casa Blanca Dr #223 | 0.70mi | 3/2.5 | 2,125 (-13%) | 4mo | $2,660,000 | $1,252 | 39 |
| 6711 E Camelback Rd #77 | 0.71mi | 2/2.5 (-1) | 2,136 (-12%) | 2mo | $1,650,000 | $772 | 36 |
Match score weights: distance 35% · size 25% · config 20% · recency 20%. Top-matched comps best support the ARV.
Projected returns pro-forma
-3.0% appreciation · 0.0% rent growth · sell at horizon
- IRR
- 50.4%
- Equity multiple
- 3.11×
- Total profit
- $73,802
- Equity at exit
- $18,638
- IRR
- 54.7%
- Equity multiple
- 5.62×
- Total profit
- $161,759
- Equity at exit
- $10,808
Cash invested: $35,000 (down + closing). Projections, not guarantees.
Landlord ↔ Tenant lean methodology
- Overall (STATE)
- 87 Strongly Landlord-Friendly
- State Arizona
- 87 Strongly Landlord-Friendly · R+3
- County
- — inherits STATE
- City
- — inherits STATE
ZIP-level market 85251
- Rents YoY
- -1.6%
- Active inventory
- 582
- Price-to-rent
- 3.3×
Monthly cashflow live
- Estimated rent
- $3,145 medium interval (Pro) →
- Mortgage (P&I)
- −$656
- Tax est. 1.5%
- −$156 /mo · $1,875/yr
- Insurance
- −$52
- HOA
- −$0
- Vacancy / Maint / Mgmt
- −$660
- Net cashflow
- $1,621
Break-even live
UW: 25.0% down · 7.5% · 30yr · 1.5% tax · 5.0% vac · 8.0% maint · 8.0% mgmt
Financing live
Cash to close
- Down payment
- $31,250
- Closing costs
- $3,750
- Reserves months
- —
- Total cash needed
- —
Loan-product check · same deal, 3 products live
Conventional
25% down · 7.5% · 30yr
- Down + closing
- —
- Monthly P&I
- —
- Monthly cashflow
- —
- DSCR
- —
- Eligible?
- —
Personal DTI + credit; lowest rate.
DSCR
20% down · 8.5% · 30yr
- Down + closing
- —
- Monthly P&I
- —
- Monthly cashflow
- —
- DSCR
- —
- Eligible?
- —
No personal income docs; deal must DSCR.
Hard money
10% down · 12.0% · 12mo
- Down + closing
- —
- Monthly P&I
- —
- Monthly cashflow
- —
- DSCR
- —
- Eligible?
- —
Short-term bridge; refi at stabilization.
Rent comps 39 comps
| Address | Beds | Baths | Sqft | Rent | $/sqft | DOM | Units | Dist |
|---|---|---|---|---|---|---|---|---|
| 4849 N Camelback Ridge Dr Unit B203 Scottsdale, AZ | 2.0 | 3.0 | 2294 | $9,995 | $4.36 | 5d | 1 | 0.16mi |
| 4849 N Camelback Ridge Dr Scottsdale, AZ | 2.0 | 3.0 | 2527 | $11,245 | $4.45 | 43d | 1 | 0.16mi |
| 4544 N Evans Dr Scottsdale, AZ | 4.0 | 4.5 | 3322 | $15,000 | $4.52 | 18d | 1 | 0.18mi |
| 5000 N Camelback Ridge Dr #206 Scottsdale, AZ | 3.0 | 3.0 | 2765 | $29,500 | $10.67 | 24d | 1 | 0.22mi |
| 5000 N Camelback Ridge Dr #102 Scottsdale, AZ | 2.0 | 2.5 | 1832 | $9,995 | $5.46 | 5d | 1 | 0.22mi |
| 5000 N Camelback Ridge Dr #302 Scottsdale, AZ | 2.0 | 2.5 | 1832 | $15,000 | $8.19 | 43d | 1 | 0.22mi |
| 5000 N Camelback Ridge Dr #407 Scottsdale, AZ | 2.0 | 3.0 | 2859 | $17,495 | $6.12 | 43d | 1 | 0.22mi |
| 6321 E Phoenician Blvd #7 Scottsdale, AZ | 2.0 | 2.5 | 2300 | $14,000 | $6.09 | 43d | 1 | 0.23mi |
| 6331 E Phoenician Blvd #1 Scottsdale, AZ | 2.0 | 2.5 | 2650 | $14,995 | $5.66 | 43d | 1 | 0.30mi |
| 4830 N 65th St Scottsdale, AZ | 2.0 | 2.0 | 1715 | $6,000 | $3.50 | 5d | 1 | 0.46mi |
| 5101 N Casa Blanca Dr #19 Paradise Valley, AZ | 2.0 | 2.5 | 1672 | $6,495 | $3.88 | 43d | 1 | 0.69mi |
| 6711 E Camelback Rd Scottsdale, AZ | 3.0 | 2.0 | 2718 | $7,000 | $2.58 | 5d | 1 | 0.72mi |
| 4715 N 68th St Scottsdale, AZ | 3.0 | 2.0 | 2500 | $7,995 | $3.20 | 43d | 1 | 0.84mi |
| 5952 E Calle Tuberia Phoenix, AZ | 4.0 | 3.5 | 2887 | $12,000 | $4.16 | 2d | 1 | 0.87mi |
| 6819 E Paradise Pkwy Scottsdale, AZ | 4.0 | 3.0 | 1840 | $4,800 | $2.61 | 14d | 1 | 0.89mi |
| 6895 E Camelback Rd Scottsdale, AZ | 3.0 | 1.0–3.0 | 1279 | $6,922 | $5.41 | 1d | 59 | 0.99mi |
| 6709 E Monterosa St Scottsdale, AZ | 4.0 | 3.0 | 2331 | $6,900 | $2.96 | 14d | 1 | 1.01mi |
| 6821 E Vista Dr Paradise Valley, AZ | 4.0 | 3.0 | 2620 | $7,399 | $2.82 | 12d | 1 | 1.01mi |
| 6929 E Mariposa Dr Scottsdale, AZ | 4.0 | 3.0 | 2800 | $7,450 | $2.66 | 16d | 1 | 1.04mi |
| 6929 E Mariposa Dr Scottsdale, AZ | 4.0 | 3.0 | 2800 | $7,750 | $2.77 | 43d | 1 | 1.04mi |
| 5401 E Exeter Blvd Phoenix, AZ | 4.0 | 3.0 | 3029 | $8,000 | $2.64 | 43d | 1 | 1.10mi |
| 6919 E Vista Dr Paradise Valley, AZ | 4.0 | 2.5 | 3166 | $12,500 | $3.95 | 7d | 1 | 1.10mi |
| 7121 E Rancho Vista Dr #5011 Scottsdale, AZ | 3.0 | 2.0 | 1826 | $5,950 | $3.26 | 4d | 1 | 1.15mi |
| 7121 E Rancho Vista Dr #5011 Scottsdale, AZ | 3.0 | 2.0 | 1826 | $5,950 | $3.26 | 4d | 1 | 1.15mi |
| 7127 E Rancho Vista Dr #5001 Scottsdale, AZ | 2.0 | 2.0 | 1781 | $5,500 | $3.09 | 43d | 1 | 1.16mi |
| 7127 E Rancho Vista Dr #2001 Scottsdale, AZ | 3.0 | 2.0 | 1781 | $5,000 | $2.81 | 43d | 1 | 1.16mi |
| 3621 N Kachina Ln Scottsdale, AZ | 4.0 | 3.0 | 2995 | $8,500 | $2.84 | 1d | 1 | 1.17mi |
| 38 Spur Cir Scottsdale, AZ | 3.0 | 2.0 | 1929 | $3,900 | $2.02 | 18d | 1 | 1.21mi |
| 6850 E Main St #7703 Scottsdale, AZ | 2.0 | 2.5 | 1733 | $9,995 | $5.77 | 43d | 1 | 1.23mi |
| 3419 N 63rd Pl Unit 1558646P Scottsdale, AZ | 4.0 | 3.0 | 1991 | $7,590 | $3.81 | 1d | 1 | 1.24mi |
| 7157 E Rancho Vista Dr #6003 Scottsdale, AZ | 2.0 | 2.0 | 2295 | $6,000 | $2.61 | 43d | 1 | 1.26mi |
| 7175 E Camelback Rd #707 Scottsdale, AZ | 2.0 | 2.5 | 2102 | $7,900 | $3.76 | 43d | 1 | 1.27mi |
| 5018 N 71st Pl Paradise Valley, AZ | 3.0 | 2.0 | 1851 | $7,500 | $4.05 | 43d | 1 | 1.28mi |
| 4201 N Marshall Way #2000 Scottsdale, AZ | 2.0 | 2.0 | 2700 | $10,000 | $3.70 | 43d | 1 | 1.34mi |
| 7020 E 1st Ave Scottsdale, AZ | 3.0 | 3.0 | 2649 | $9,999 | $3.77 | 43d | 1 | 1.38mi |
| 3301 N 63rd St Scottsdale, AZ | 4.0 | 3.0 | 2500 | $5,995 | $2.40 | 43d | 1 | 1.39mi |
| 4820 N 72nd Way Scottsdale, AZ | 3.0 | 3.0 | 2024 | $4,000 | $1.98 | 43d | 1 | 1.41mi |
| 6916 E 2nd St Scottsdale, AZ | 4.0 | 3.5 | 3014 | $13,000 | $4.31 | 43d | 1 | 1.41mi |
| 3213 N 63rd Pl Scottsdale, AZ | 3.0 | 2.0 | 1576 | $2,800 | $1.78 | 18d | 1 | 1.48mi |
Listing history 26 events
-
2026-06-18days on market $125,000 Active 136 DOM
-
2026-06-17days on market $125,000 Active 135 DOM
-
2026-06-16days on market $125,000 Active 134 DOM
-
2026-06-15days on market $125,000 Active 133 DOM
-
2026-06-13days on market $125,000 Active 131 DOM
-
2026-06-09days on market $125,000 Active 127 DOM
-
2026-06-08days on market $125,000 Active 126 DOM
-
2026-06-07days on market $125,000 Active 125 DOM
-
2026-06-04days on market $125,000 Active 122 DOM
-
2026-06-03days on market $125,000 Active 121 DOM
-
2026-06-02days on market $125,000 Active 120 DOM
-
2026-06-01days on market $125,000 Active 119 DOM
-
2026-05-31days on market $125,000 Active 118 DOM
-
2026-02-02$125,000 Active 784-char remark
Show marketing remark (784 chars)
FRACTIONAL OWNERSHIP - 3 WEEKS PER YEAR. Own a piece of The Phoenician resort with this spacious 3 bedroom + den, 3 1/2 bath villa! Complete with a private pool, hot tub, outdoor grill, fire pit, fireplace, and full kitchen with twice daily housekeeping. This end unit enjoys golf course and mountain views from the patio. The unit comes w/its own concierge service and golf cart to use on the property + amenities of the hotel. You will enjoy week 11 and week 47 with one floating summer week per year. Week 11 is typically during spring training and 47 is usually over the Thanksgiving holiday. Only 1 spring or fall week is required to be used here & unused weeks can be converted to Marriott points for use elsewhere. Yearly dues in 2026 were $27,883 - already paid by seller!
-
2025-12-03historical
-
2025-02-01$179,000 Active
-
2024-05-01historical
-
2024-01-30$225,000 Active
-
2023-04-02historical
-
2022-10-20$290,000 Active
-
2022-04-01historical
-
2022-01-04$300,000 Active
-
2021-12-31historical
-
2021-09-21status Active
-
2021-09-03historical
-
2021-08-11$320,000 Active
ⓘ Source: listings_history table (triggers on properties + properties_extension) + one-shot
backfill from property_details.listing_events for pre-trigger history.
Nearby sold comps map
Loading sold comps map…
Walkable amenities ~0.75 mi
Loading nearby amenities…
Taxation est. · year 1
- Rental income
- $37,741
- − Mortgage interest
- −$7,002
- − Property taxes
- −$1,875
- − Insurance
- −$625
- − Repairs & maintenance
- −$3,019
- − Management
- −$3,019
- − Depreciation
- −$3,636
- Taxable income
- $18,564
- Est. tax owed @ 24.0%
- −$4,455
- After-tax cash flow
- $14,994/yr
For passive investors: Depreciation is non-cash, so a rental often shows a tax loss while cash-flowing — sheltering income. Rental losses are passive: they offset passive income freely, and up to $25,000/yr can offset ordinary (W-2) income if you actively participate and your MAGI is under $100k (phasing out to $0 by $150k); unused losses carry forward. On sale, claimed depreciation is recaptured at up to 25%, and gains may owe capital-gains tax (a 1031 exchange can defer both). Figures are a year-1 estimate at your 24.0% rate — not tax advice; consult a CPA.
Condition & rehab AI · 12 photos
This luxurious townhouse at The Phoenician offers a private pool, hot tub, and golf course views, making it ideal for both resale and rental.
Value-add opportunities
- Both Concierge service — Enhances convenience and value for both resale and rental
- Both Golf cart access — Improves access to amenities and enhances overall experience
- Both Weekly maintenance package — Ensures property is always in top condition
Renovation cost estimate screening
Value-add ROI direction
- Both Concierge service — Enhances convenience and value for both resale and rental ↑
- Both Golf cart access — Improves access to amenities and enhances overall experience ↑
- Both Weekly maintenance package — Ensures property is always in top condition ↑
ⓘ Cost ranges are severity-bucket heuristics (US national rule-of-thumb). Get contractor quotes + a written scope before underwriting a rehab budget.
Schools (NCES district)
- District
- Scottsdale Unified District (4240)
- NCES district ID
- 0407570
- Math proficiency
- 53% ▼ -10.00%
- Reading proficiency
- 55% ▼ -8.00%
- Median HH income
- $70,139
- Composite
- 48.02/100
- National rank
- #2196
- State rank
- #30 of 249 in AZ
Livability — Phoenix
- Score
- 75/100
- State rank
- #16
- US rank
- #3924
Category grades
Schools grade is shown separately in the Schools card above.
Census & demographics
- Census place
- Phoenix, AZ
- County
- Maricopa County · 4,537,380 people
- City population
- 290,846
- Metro
- Phoenix-Mesa-Chandler, AZ
- Population (ZIP)
- 40,780
- Household income
- $92,851
- Rent vs Own
- Severe rent burden
- 2259.0
Population outlook (Maricopa County) Hauer SSP2
- Today (2025)
- 4,979,203 people
- By 2030
- 5,378,229 · +8.0%
- By 2040
- 6,156,598 · +23.6%
- By 2050
- 6,872,376 · +38.0%
- By 2075
- 8,401,270 · +68.7%
- By 2100
- 9,247,439 · +85.7%
Race, ethnicity, and origin ACS 2023
- Neighborhood character
- Predominantly White (77%)
- Race & ethnicity
- White 77% Hispanic / Latino 14% Two or more races 10% Asian 2% Black 2%
- Hispanic origin (detail)
- Mexican 11%
- Common ancestry
- Italian 5% Romanian 3% Portuguese 3%
- Foreign-born
- 9% · Canada
- Languages at home
- 88% English-only · Spanish 7% Other Indo-European 2% French/Haitian/Cajun 1%
Political lean MEDSL · Maricopa
- 2024 margin
- Toss-up / Even · D 47.7% · R 51.2% · Other 1.1%
- 2008→2024 swing
- +7.1pp toward D · 2008: -10.6pp · 2024: -3.5pp
- All cycles
- 2024: R+3.5 2020: D+2.2 2016: R+3.5 2012: R+12.0 2008: R+10.6
Not yet ingested
- Civics
- —
Market trends
- HPI YoY
- ▼ -672.80%
- Current HPI
- 372.433
- Rent YoY
- ▼ -1.58%
- Metro
- Phoenix-Mesa-Chandler, AZ
- State GDP YoY
- ▲ 4.54%
- F500 in state
- 20
Industry mix (Fortune 500 HQ in AZ)
| Industry | F500 HQs | Revenue |
|---|---|---|
| Technology | 2 | $13B |
|
||
| Mining / Metals | 1 | $23B |
|
||
| Environmental Services | 1 | $16B |
|
||
| Metals / Steel | 1 | $14B |
|
||
| Technology Distribution | 1 | $9B |
|
||
| Homebuilding | 1 | $8B |
|
||
Price history
-60.9% since first listed13 events — show timeline
- 2026-02-02 Listed $125,000 ARMLS
- 2025-12-03 Listing Removed — ARMLS
- 2025-02-01 Listed $179,000 ARMLS
- 2024-05-01 Listing Removed — ARMLS
- 2024-01-30 Listed $225,000 ARMLS
- 2023-04-02 Listing Removed — ARMLS
- 2022-10-20 Listed $290,000 ARMLS
- 2022-04-01 Listing Removed — ARMLS
- 2022-01-04 Listed $300,000 ARMLS
- 2021-12-31 Listing Removed — ARMLS
- 2021-09-21 Relisted — ARMLS
- 2021-09-03 Listing Removed — ARMLS
- 2021-08-11 Listed $320,000 ARMLS
Cash-flow waterfall
monthlySold comps — $/sqft
last 12 mo · ≤1 miLoading sold comps…