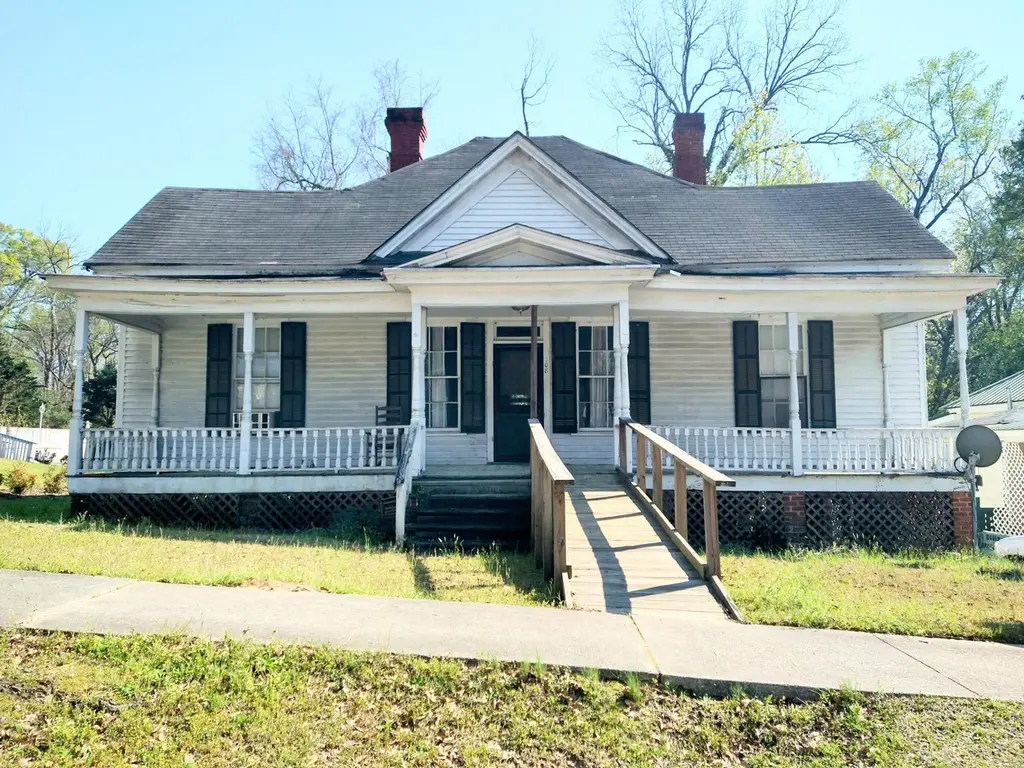
12416 W Broad St · Sparta, GA
Flood risk 1/10 · Minimal
- FEMA flood zone
- X (unshaded)
- Chance of flooding over 30 yrs
- 0.0%
- Est. flood insurance / yr
- $507 – $1,088
Fire risk 3/10 · Minor
- Est. fire insurance / yr
- $963 – $1,789
Heat risk 6/10 · Moderate
- Hot days now (above 107°F)
- 7 days/yr
- Hot days in 30 yrs
- 17 days/yr
Wind risk 6/10 · Moderate
- Chance of severe wind over 30 yrs
- 55.0%
Air-quality risk 3/10 · Minor
- Unhealthy air days now
- 3 days/yr
- Unhealthy air days in 30 yrs
- 3 days/yr
Risk factors via First Street. Map © Google.
Why this score? — see what drove the B- grade
The composite is a weighted blend of 9 inputs, each scored 0–100. Each bar is that input's sub-score; the figure is the points it added to the 100-point composite (weight × sub-score).
- Cash flow +30.0/30.0
- 1% rule +10.0/10.0
- DSCR +10.0/10.0
- ARV discount +7.5/15.0
- Livability +3.0/5.0
- Rent growth +2.5/5.0
- Condition / age +2.5/5.0
- Appreciation +1.0/10.0
- Schools +0.5/10.0
$74,998
🖨 Deal sheet 📄 Offer letter ✓ Due diligence
Listing remarks
This currently rented home is calling all investors and lovers of historic homes with a knack for renovation. This 2,018 Sq. Ft. home built in 1935 offers much to someone with a discerning eye. 2'' heart pine flooring and roofing still remain in much of the home and there is also bead board ceiling in the front part of the home. The sheetrock walls could use a fresh coat of paint but are in great condition overall and feature picture frame moulding around the top and the wooden interior doors appear to be original to the home. Large rooms with high ceilings with a central breezeway that features opposing front and rear doors opening onto large covered porches fore and aft to keep you cool i
Key facts
- Central breezeway
- Bead board ceiling
- Heart pine flooring
Tags
Property features AI
Finance
- HOA & community: Sidewalks
Exterior
- Parking: Unpaved parking
- Utilities: Public water; Public sewer; Cable available; Natural gas connected; Water connected; Sewer connected; Power connected
- Home design: Single-family residential home; One story; Entry level: 1
- Construction: Wood siding and frame construction; Pillar/post/pier foundation
- Exterior features: Front porch; Rear porch; No fencing; Composition roof
Interior
- Kitchen: Refrigerator; Range
- Bedrooms: 6 total rooms
- Flooring: Carpet; Hardwood
- Bathrooms: 1 full bathroom; 1 half bathroom
- Heating & cooling: Wall/window air conditioning unit(s); Fireplace heating; Space heater; Natural gas heating
- Interior features: Eat-in kitchen; Has a view
- Laundry & utility: Washer hookup; Electric water heater
Neighborhood map
What this means for you Summary
Snapshot
- This is a 3-bed/1.0-bath single-family listed at $75k.
Deal economics
- At list price, monthly cash flow is $593 ($7k/yr) — positive.
- The deal already cash-flows at list — no discount required.
- Meets the 1% rule at list price ($1k rent vs $75k).
- Recommended offer: $73k (3.0% below list) — sets the bar for market timing.
Location & tenants
- Location reads 60/100 on livability (#383 in GA) — a middle-class / working-renter tenant base. Strengths: cost of living A+, crime A, housing A; Watch: amenities F, commute F, employment F.
- Hancock County (rural): math 3% / reading 12% proficiency, ranked #173 of 174 in GA (top 99%) — low school quality limits family demand, transient renter base, plan for 1-2y turnover; 80% free/reduced lunch — lower-income household profile, screen leases tightly.
- Zoned schools: Lewis Elementary School (math 2% / reading 2%, grade F, #1,204 of 1,228 statewide, top 100%, 315 students, 100% FRL); Hancock Central Middle School (math 8% / reading 17%, grade F, #412 of 470 statewide, top 88%, 155 students, 100% FRL); Hancock Central High School (math 5% / reading 15%, grade F, #353 of 424 statewide, top 86%, 233 students, 100% FRL) — zoned schools average 100% FRL vs 80% district-wide (20 pts higher); higher-poverty schools than district average — tighter screening recommended.
- Market conditions: 116 active listings in the ZIP; 28 units permitted in Hancock County in 2024 (0 in 5+ unit buildings).
Forward outlook
- Local home prices are declining (-3.0%/yr); year-one equity from $518 of loan paydown is wiped out by about $2k of value loss. Plan a longer hold.
- Hancock County population projected at -34% by 2050 — secular population decline; favor cash flow + early exit over multi-decade hold.
- At projected returns (-3.0% appreciation + 3.0% rent growth), your $21k cash investment doubles in ~4 years — after that, you're playing with house money.
Negotiation context
- It's been on market 39 days — a 3% lower offer ($73k) is reasonable based on typical stale-listing flexibility.
- 5 sale attempts; this cycle's ask has dropped $15k (17%) from the opening price — seller is motivated, your offer sets the floor, not the list.
Risks & watch-outs
- Watch-outs: built in 1935 — expect roof / HVAC / electrical / plumbing capex.
- Climate carrying-cost: major wind risk, 55% chance of damaging wind over 30y; extreme-heat days projected 7→17/yr by 2055 (HVAC capex compounding) — expect insurance premiums to compound above CPI over the hold.
Questions for the listing agent
- It's been on market 39 days. Have you received any prior offers? Is the seller open to a 3% concession, seller financing, or rate buy-down credit?
- Built in 1935 — when were the roof, HVAC, electrical panel, plumbing, and water heater last replaced?
- Is there a deadline driving the sale (1031 exchange, divorce, estate, relocation)? That informs how much negotiation room exists.
- Schools are F-rated, which usually means shorter tenancies and higher turnover. Who's the typical renter profile here, and what's been the actual vacancy rate?
- What's the average days-on-market for RENTAL listings here right now (not sales)? A rising rental-DOM trend means longer vacancies and softer asking-rent achievability than the comps imply.
- What's the recent tenant-quality profile in this submarket — average credit score on applications, eviction rate, late-payment / NSF rate, and stable-employment percentage? A property-management company in the area should have these aggregated.
- How much new for-sale + rental construction is in the pipeline within 1–3 miles? Heavy new supply typically softens prices + rents 12–24 months out; constrained supply supports both.
Investment metrics
- 1% rule
- 1.84% ✓
- Cap rate
- 15.79%
- Cash-on-cash
- 33.90%
- DSCR
- 2.51
- GRM
- 4.5
CMA / ARV
- ARV (median comp)
- $176,714
- List price
- $74,998
- Delta
- -57.56%
- Verdict
- UNDERPRICED
- Comps
- 5 within 1.0 mi
Show comp detail 2 sales within ~0.75 mi
| Address | Dist | Beds/Ba | Sqft | Sold | Price | $/sf | Match |
|---|---|---|---|---|---|---|---|
| 485 Adams St | 0.11mi | 3/1.0 | 1,940 (-4%) | 10mo | $40,000 | $21 | 80 |
| 9064 E Broad St | 0.64mi | 4/2.0 (+1) | 2,052 (+2%) | 16mo | $110,000 | $54 | 45 |
Match score weights: distance 35% · size 25% · config 20% · recency 20%. Top-matched comps best support the ARV.
Projected returns pro-forma
-3.0% appreciation · 3.0% rent growth · sell at horizon
- IRR
- 29.2%
- Equity multiple
- 2.22×
- Total profit
- $25,642
- Equity at exit
- $11,182
- IRR
- 36.6%
- Equity multiple
- 4.38×
- Total profit
- $71,022
- Equity at exit
- $6,484
Cash invested: $20,999 (down + closing). Projections, not guarantees.
Landlord ↔ Tenant lean methodology
- Overall (STATE)
- 90 Strongly Landlord-Friendly
- State Georgia
- 90 Strongly Landlord-Friendly · R+3
- County
- — inherits STATE
- City
- — inherits STATE
ZIP-level market 31087
- Home prices YoY
- -3.8%
- Active inventory
- 116
- Price-to-rent
- 4.5×
Monthly cashflow live
- Estimated rent
- $1,383 medium interval (Pro) →
- Mortgage (P&I)
- −$393
- Tax from tax record
- −$75 /mo · $899/yr
- Insurance
- −$31
- HOA
- −$0
- Vacancy / Maint / Mgmt
- −$290
- Net cashflow
- $593
Break-even live
UW: 25.0% down · 7.5% · 30yr · 1.5% tax · 5.0% vac · 8.0% maint · 8.0% mgmt
Financing live
Cash to close
- Down payment
- $18,750
- Closing costs
- $2,250
- Reserves months
- —
- Total cash needed
- —
Loan-product check · same deal, 3 products live
Conventional
25% down · 7.5% · 30yr
- Down + closing
- —
- Monthly P&I
- —
- Monthly cashflow
- —
- DSCR
- —
- Eligible?
- —
Personal DTI + credit; lowest rate.
DSCR
20% down · 8.5% · 30yr
- Down + closing
- —
- Monthly P&I
- —
- Monthly cashflow
- —
- DSCR
- —
- Eligible?
- —
No personal income docs; deal must DSCR.
Hard money
10% down · 12.0% · 12mo
- Down + closing
- —
- Monthly P&I
- —
- Monthly cashflow
- —
- DSCR
- —
- Eligible?
- —
Short-term bridge; refi at stabilization.
Listing history 28 events
-
2026-06-19days on market $74,998 Active 39 DOM
-
2026-06-18days on market $74,998 Active 38 DOM
-
2026-06-17days on market $74,998 Active 37 DOM
-
2026-06-16days on market $74,998 Active 36 DOM
-
2026-06-15days on market $74,998 Active 35 DOM
-
2026-06-14days on market $74,998 Active 33 DOM
-
2026-06-12days on market $74,998 Active 32 DOM
-
2026-06-09days on market $74,998 Active 29 DOM
-
2026-06-08days on market $74,998 Active 28 DOM
-
2026-06-07days on market $74,998 Active 27 DOM
-
2026-06-05days on market $74,998 Active 24 DOM
-
2026-06-03days on market $74,998 Active 23 DOM
-
2026-06-02days on market $74,998 Active 22 DOM
-
2026-06-01days on market $74,998 Active 21 DOM
-
2026-05-31days on market $74,998 Active 20 DOM
-
2026-05-30days on market $74,998 Active 19 DOM
-
2026-05-11historical
-
2026-04-13price $79,998
-
2026-03-20$89,998 Active
-
2026-03-20$79,998 Active 1302-char remark
-
2026-03-19historical
-
2026-03-19historical
-
2026-03-19historical
-
2026-02-05price $90,000
-
2026-02-05price $90,000
-
2025-12-23$99,000 Active
-
2025-12-23$90,000
-
2025-12-22$99,000 New
ⓘ Source: listings_history table (triggers on properties + properties_extension) + one-shot
backfill from property_details.listing_events for pre-trigger history.
Tax reassessment forecast GA · Resets to sale price
- Current annual tax
- $899 · $75/mo
- Projected year-2 tax
- $899 · $75/mo
- Expected delta
- $0/yr ($0/mo · 0.0%)
ⓘ Screening estimate from a state-policy table — verify with the county assessor before closing.
Climate risk First Street
- Flood 1/10 Low FEMA zone X (unshaded) · 0% chance over 30 yrs
- Wildfire 3/10 Moderate
- Heat 6/10 Major 7 d/yr ≥107°F today · 17 d/yr by 30 yrs out
- Wind 6/10 Major 55% chance of damaging wind over 30 yrs
- Air quality 3/10 Moderate 3 unhealthy d/yr today · 3 by 30 yrs out
Nearby sold comps map
Loading sold comps map…
Walkable amenities ~0.75 mi
Loading nearby amenities…
Taxation est. · year 1
- Rental income
- $16,599
- − Mortgage interest
- −$4,201
- − Property taxes
- −$899
- − Insurance
- −$375
- − Repairs & maintenance
- −$1,328
- − Management
- −$1,328
- − Depreciation
- −$2,182
- Taxable income
- $6,286
- Est. tax owed @ 24.0%
- −$1,509
- After-tax cash flow
- $5,611/yr
For passive investors: Depreciation is non-cash, so a rental often shows a tax loss while cash-flowing — sheltering income. Rental losses are passive: they offset passive income freely, and up to $25,000/yr can offset ordinary (W-2) income if you actively participate and your MAGI is under $100k (phasing out to $0 by $150k); unused losses carry forward. On sale, claimed depreciation is recaptured at up to 25%, and gains may owe capital-gains tax (a 1031 exchange can defer both). Figures are a year-1 estimate at your 24.0% rate — not tax advice; consult a CPA.
Schools (NCES district)
- District
- Hancock County
- NCES district ID
- 1302640
- Math proficiency
- 3% ▼ -5.00%
- Reading proficiency
- 12% ▼ -8.00%
- Median HH income
- $26,519
- Composite
- 5.27/100
- National rank
- #10034
- State rank
- #173 of 174 in GA
Livability — Sparta
- Score
- 60/100
- State rank
- #383
- US rank
- #19278
Category grades
Schools grade is shown separately in the Schools card above.
Census & demographics
- Census place
- Sparta, GA
- Population (ZIP)
- 8,679
Population outlook (Hancock County) Hauer SSP2
- Today (2025)
- 7,443 people
- By 2030
- 6,846 · -8.0%
- By 2040
- 5,713 · -23.2%
- By 2050
- 4,912 · -34.0%
- By 2075
- 3,967 · -46.7%
- By 2100
- 3,398 · -54.3%
Race, ethnicity, and origin ACS 2023
- Neighborhood character
- Predominantly Black (72%)
- Race & ethnicity
- Black 72% White 26% Two or more races 1%
- Common ancestry
- Slovak 1% Iranian 1% Serbian 1%
- Foreign-born
- 1% · Canada
- Languages at home
- 98% English-only · Spanish 1%
Political lean MEDSL · Hancock
- 2024 margin
- Solid D (+35.4) · D 67.5% · R 32.2%
- 2008→2024 swing
- -27.7pp toward R · 2008: 63.1pp · 2024: 35.4pp
- All cycles
- 2024: D+35.4 2020: D+43.9 2016: D+51.9 2012: D+62.2 2008: D+63.1
Not yet ingested
- Civics
- —
Market trends
- HPI YoY
- ▼ -8.00%
- Current HPI
- 200.3531
- Rent YoY
- —
- Metro
- —
- State GDP YoY
- ▲ 2.66%
- F500 in state
- 28
Industry mix (Fortune 500 HQ in GA)
| Industry | F500 HQs | Revenue |
|---|---|---|
| Paper / Packaging | 2 | $29B |
|
||
| Retail | 1 | $160B |
|
||
| Transportation / Logistics | 1 | $91B |
|
||
| Airlines | 1 | $62B |
|
||
| Consumer Goods | 1 | $47B |
|
||
| Utilities | 1 | $25B |
|
||
Price history
-24.2% since first listed13 events — show timeline
- 2026-05-19 Price Changed $74,998 Hive MLS
- 2026-05-11 Listing Removed — Hive MLS
- 2026-04-13 Price Changed $79,998 Hive MLS
- 2026-03-20 Listed $89,998 Hive MLS
- 2026-03-20 Listed $79,998 Hive MLS
- 2026-03-19 Listing Removed — Hive MLS
- 2026-03-19 Listing Removed — GAMLS
- 2026-03-19 Listing Removed — Hive MLS
- 2026-02-05 Price Changed $90,000 Hive MLS
- 2026-02-05 Price Changed $90,000 GAMLS
- 2025-12-23 Listed $99,000 Hive MLS
- 2025-12-23 Listed $90,000 Hive MLS
- 2025-12-22 Listed $99,000 GAMLS
Property tax history
+1.0%/yrLatest (2025): $899 · -0.3% YoY. Source: county tax records.
Cash-flow waterfall
monthlySold comps — $/sqft
last 12 mo · ≤1 miLoading sold comps…