 Duplex
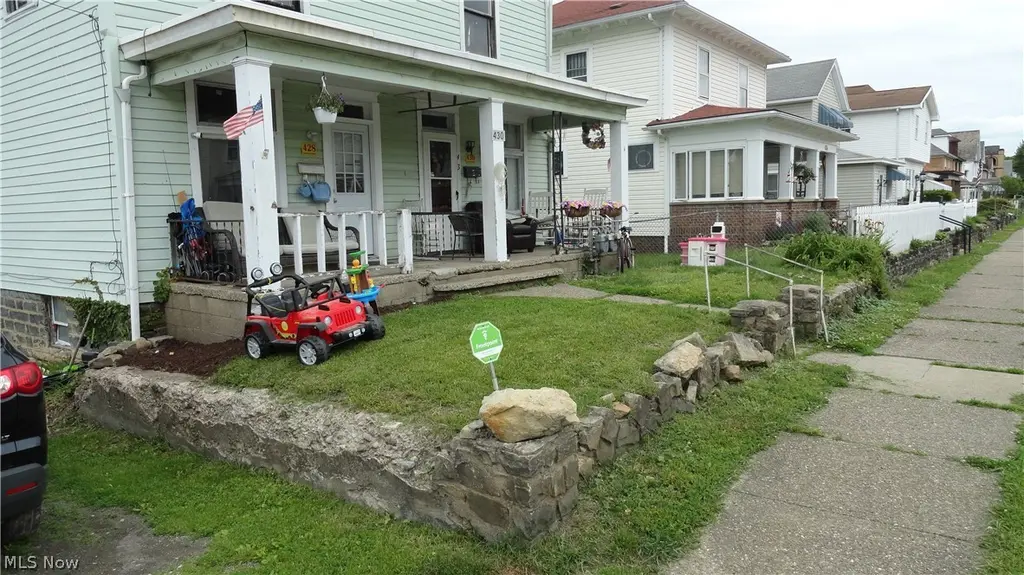
428-430 Grant St · Newell, WV
Flood risk 1/10 · Minimal
- FEMA flood zone
- X (unshaded)
- Chance of flooding over 30 yrs
- 0.0%
- Est. flood insurance / yr
- $473 – $860
Fire risk 1/10 · Minimal
- Est. fire insurance / yr
- $787 – $1,461
Heat risk 4/10 · Minor
- Hot days now (above 97°F)
- 8 days/yr
- Hot days in 30 yrs
- 19 days/yr
Wind risk 1/10 · Minimal
- Chance of severe wind over 30 yrs
- —
Air-quality risk 2/10 · Minimal
- Unhealthy air days now
- 1 days/yr
- Unhealthy air days in 30 yrs
- 2 days/yr
Risk factors via First Street. Map © Google.
Why this score? — see what drove the A grade
The composite is a weighted blend of 9 inputs, each scored 0–100. Each bar is that input's sub-score; the figure is the points it added to the 100-point composite (weight × sub-score).
- Cash flow +30.0/30.0
- ARV discount +15.0/15.0
- DSCR +10.0/10.0
- Appreciation +9.9/10.0
- 1% rule +9.4/10.0
- Schools +3.4/10.0
- Livability +3.0/5.0
- Rent growth +2.5/5.0
- Condition / age +2.5/5.0
$98,900
🖨 Deal sheet 📄 Offer letter ✓ Due diligence
Multi-family units
County records classify this as Multi-Family (2-4 Unit). Listing-text estimate: 2 units. confirmed
Listing remarks
Townhouse style duplex on corner lot, centrally located in town. Both units 2 bed, 1 bath. Both occupied. Nice yard, well maintained units.
Key facts
- Centrally located
- Corner lot
- 3,301 sq ft lot
Tags
Property features AI
Finance
- Other: Above-grade finished area reported as 2,059 (source: Assessor)
- Financial info: Gross monthly income listed as $1,414; Unit 1 actual rent $664 (leased); Unit 2 actual rent $750 (leased); Owner pays taxes; tenants pay all utilities
Exterior
- Parking: On-street parking
- Utilities: Public water; Public sewer
- Home design: Multi-family building, 2 stories
- Construction: Vinyl siding; Asphalt roof; Built year source: Assessor
- Exterior features: Faces south
Interior
- Bedrooms: Two 2-bedroom units (each unit leased through June 1, 2026)
- Bathrooms: Two full bathrooms (one in each unit)
- Heating & cooling: Forced air heating; Gas heating
- Interior features: Unfinished basement
Neighborhood map
What this means for you Summary
Snapshot
- This is a 2 × 2-bed/1.0-bath units multifamily listed at $99k.
Deal economics
- At list price, monthly cash flow is $522 ($6k/yr) — positive. Per door: $261/mo.
- The deal already cash-flows at list — no discount required.
- Meets the 1% rule at list price ($1k rent vs $99k).
- Recommended offer: $97k (1.5% below list) — sets the bar for market timing.
Location & tenants
- Location reads 60/100 on livability (#213 in WV) — a middle-class / working-renter tenant base. Strengths: crime A+, cost of living A+, housing A; Watch: health & safety C-, schools F, amenities F.
- Hancock County Schools (urban): math 37% / reading 43% proficiency, ranked #7 of 55 in WV (top 13%) — families likely to look elsewhere, expect single-tenant / working-renter base with shorter leases.
- Market conditions: 5 active listings in the ZIP; 15 units permitted in Hancock County in 2024 (0 in 5+ unit buildings).
Forward outlook
- In year one you build about $10k of equity ($684 loan paydown + $10k appreciation (9.8% local appreciation)).
- Hancock County population projected at -15% by 2050 — secular population decline; favor cash flow + early exit over multi-decade hold.
- At projected returns (9.8% appreciation + 3.0% rent growth), your $28k cash investment doubles in ~2 years — after that, you're playing with house money.
- By year 4, paydown + projected appreciation supports a ~$37k cash-out refi (75% LTV) — recoverable capital for the next deal without selling this one.
Negotiation context
- It's been on market 23 days — a 2% lower offer ($97k) is reasonable based on typical stale-listing flexibility.
- 3 sale attempts since 2y ago with the ask held roughly flat each time — persistent listings suggest the price (not the market) is what's stuck; bring a comps-based counter.
Risks & watch-outs
- Watch-outs: built in 1910 — expect roof / HVAC / electrical / plumbing capex.
Questions for the listing agent
- Can we see the unit-by-unit rent roll, current vacancy, and any below-market leases? What's the average tenancy length?
- What capital expenditures (roof, boiler, parking lot, exteriors) have been made in the last 5 years, and what's planned in the next 2?
- Built in 1910 — when were the roof, HVAC, electrical panel, plumbing, and water heater last replaced?
- Is there a deadline driving the sale (1031 exchange, divorce, estate, relocation)? That informs how much negotiation room exists.
- Schools are F-rated, which usually means shorter tenancies and higher turnover. Who's the typical renter profile here, and what's been the actual vacancy rate?
- What's the average days-on-market for RENTAL listings here right now (not sales)? A rising rental-DOM trend means longer vacancies and softer asking-rent achievability than the comps imply.
- What's the recent tenant-quality profile in this submarket — average credit score on applications, eviction rate, late-payment / NSF rate, and stable-employment percentage? A property-management company in the area should have these aggregated.
- How much new apartment / multifamily construction is in the pipeline within 1–3 miles? Heavy new supply (>2% of stock underway) typically softens rents 12–24 months out; light construction supports rent growth.
Investment metrics
- 1% rule
- 1.44% ✓
- Cap rate
- 12.63%
- Cash-on-cash
- 22.64%
- DSCR
- 2.01
- GRM
- 5.8
CMA / ARV
- ARV (on-the-fly)
- $162,661
- Comps found
- 1
Show comp detail 1 sale within ~0.75 mi
| Address | Dist | Beds/Ba | Sqft | Sold | Price | $/sf | Match |
|---|---|---|---|---|---|---|---|
| 202 Grant St | 0.22mi | 4/2.0 | 1,872 (-9%) | 9mo | $148,500 | $79 | 67 |
Match score weights: distance 35% · size 25% · config 20% · recency 20%. Top-matched comps best support the ARV.
Projected returns pro-forma
9.77% appreciation · 3.0% rent growth · sell at horizon
- IRR
- 40.9%
- Equity multiple
- 4.09×
- Total profit
- $85,544
- Equity at exit
- $87,432
- IRR
- 35.4%
- Equity multiple
- 9.14×
- Total profit
- $225,286
- Equity at exit
- $186,807
Cash invested: $27,692 (down + closing). Projections, not guarantees.
Landlord ↔ Tenant lean methodology
- Overall (STATE)
- 83 Strongly Landlord-Friendly
- State West Virginia
- 83 Strongly Landlord-Friendly · R+22
- County
- — inherits STATE
- City
- — inherits STATE
ZIP-level market 26050
- Home prices YoY
- 6.4%
- Active inventory
- 5
- Price-to-rent
- 11.6×
Monthly cashflow live
- Estimated rent
- $1,425 medium interval (Pro) →
- Mortgage (P&I)
- −$519
- Tax from tax record
- −$43 /mo · $522/yr
- Insurance
- −$41
- HOA
- −$0
- Vacancy / Maint / Mgmt
- −$299
- Net cashflow
- $522
Break-even live
2-unit breakdown (identical units grouped — click to expand)
| Units | Beds | Baths | Est. rent |
|---|---|---|---|
| 2× units | 2 | 1 | $1,424 |
| #1 | 2 | 1 | $712 |
| #2 | 2 | 1 | $712 |
| Total (2 units) | $1,425 | ||
UW: 25.0% down · 7.5% · 30yr · 1.5% tax · 5.0% vac · 8.0% maint · 8.0% mgmt
Financing live
Cash to close
- Down payment
- $24,725
- Closing costs
- $2,967
- Reserves months
- —
- Total cash needed
- —
Loan-product check · same deal, 3 products live
Conventional
25% down · 7.5% · 30yr
- Down + closing
- —
- Monthly P&I
- —
- Monthly cashflow
- —
- DSCR
- —
- Eligible?
- —
Personal DTI + credit; lowest rate.
DSCR
20% down · 8.5% · 30yr
- Down + closing
- —
- Monthly P&I
- —
- Monthly cashflow
- —
- DSCR
- —
- Eligible?
- —
No personal income docs; deal must DSCR.
Hard money
10% down · 12.0% · 12mo
- Down + closing
- —
- Monthly P&I
- —
- Monthly cashflow
- —
- DSCR
- —
- Eligible?
- —
Short-term bridge; refi at stabilization.
Listing history 25 events
-
2026-06-19days on market $98,900 Active 23 DOM
-
2026-06-18days on market $98,900 Active 22 DOM
-
2026-06-17days on market $98,900 Active 21 DOM
-
2026-06-16days on market $98,900 Active 20 DOM
-
2026-06-15days on market $98,900 Active 19 DOM
-
2026-06-14days on market $98,900 Active 17 DOM
-
2026-06-12days on market $98,900 Active 16 DOM
-
2026-06-09days on market $98,900 Active 13 DOM
-
2026-06-08days on market $98,900 Active 12 DOM
-
2026-06-07days on market $98,900 Active 11 DOM
-
2026-06-07days on market $98,900 Active 10 DOM
-
2026-06-04days on market $98,900 Active 7 DOM
-
2026-06-02days on market $98,900 Active 6 DOM
-
2026-06-01days on market $98,900 Active 5 DOM
-
2026-05-31days on market $98,900 Active 4 DOM
-
2026-05-31days on market $98,900 Active 3 DOM
-
2026-05-27$98,900 Active
-
2026-03-28historical
-
2025-12-12price $98,900
-
2025-06-27price $105,100
-
2025-06-02price $109,900
-
2025-05-03price $119,600
-
2025-03-27$130,000 Active
-
2024-11-01historical
-
2024-05-01$120,000 Active
ⓘ Source: listings_history table (triggers on properties + properties_extension) + one-shot
backfill from property_details.listing_events for pre-trigger history.
Tax reassessment forecast WV · Resets to sale price
- Current annual tax
- $522 · $43/mo
- Projected year-2 tax
- $584 · $49/mo
- Expected delta
- +$62/yr (+$5/mo · 11.8%)
ⓘ Screening estimate from a state-policy table — verify with the county assessor before closing.
Climate risk First Street
- Flood 1/10 Low FEMA zone X (unshaded) · 0% chance over 30 yrs
- Wildfire 1/10 Low
- Heat 4/10 Moderate 8 d/yr ≥97°F today · 19 d/yr by 30 yrs out
- Wind 1/10 Low
- Air quality 2/10 Low 1 unhealthy d/yr today · 2 by 30 yrs out
Nearby sold comps map
Loading sold comps map…
Walkable amenities ~0.75 mi
Loading nearby amenities…
Taxation est. · year 1
- Rental income
- $17,100
- − Mortgage interest
- −$5,540
- − Property taxes
- −$522
- − Insurance
- −$494
- − Repairs & maintenance
- −$1,368
- − Management
- −$1,368
- − Depreciation
- −$2,877
- Taxable income
- $4,931
- Est. tax owed @ 24.0%
- −$1,183
- After-tax cash flow
- $5,086/yr
For passive investors: Depreciation is non-cash, so a rental often shows a tax loss while cash-flowing — sheltering income. Rental losses are passive: they offset passive income freely, and up to $25,000/yr can offset ordinary (W-2) income if you actively participate and your MAGI is under $100k (phasing out to $0 by $150k); unused losses carry forward. On sale, claimed depreciation is recaptured at up to 25%, and gains may owe capital-gains tax (a 1031 exchange can defer both). Figures are a year-1 estimate at your 24.0% rate — not tax advice; consult a CPA.
Schools (NCES district)
- District
- Hancock County Schools
- NCES district ID
- 5400450
- Math proficiency
- 37% ▼ -11.00%
- Reading proficiency
- 43% ▼ -5.00%
- Median HH income
- $39,803
- Composite
- 33.5/100
- National rank
- #5445
- State rank
- #7 of 55 in WV
Livability — Newell
- Score
- 60/100
- State rank
- #213
- US rank
- #18588
Category grades
Schools grade is shown separately in the Schools card above.
Census & demographics
- Census place
- Newell, WV
- Population (ZIP)
- 1,504
Population outlook (Hancock County) Hauer SSP2
- Today (2025)
- 28,704 people
- By 2030
- 27,913 · -2.8%
- By 2040
- 26,078 · -9.1%
- By 2050
- 24,521 · -14.6%
- By 2075
- 21,630 · -24.6%
- By 2100
- 17,867 · -37.8%
Race, ethnicity, and origin ACS 2023
- Neighborhood character
- Predominantly White (95%)
- Race & ethnicity
- White 95% Two or more races 3% Asian 2%
- Common ancestry
- Italian 5% Serbian 3% Romanian 2%
- Foreign-born
- 2%
- Languages at home
- 98% English-only · Tagalog/Filipino 2%
Political lean MEDSL · Hancock
- 2024 margin
- Solid R (+46.8) · D 25.8% · R 72.6% · Other 1.6%
- 2008→2024 swing
- -31.6pp toward R · 2008: -15.2pp · 2024: -46.8pp
- All cycles
- 2024: R+46.8 2020: R+43.6 2016: R+44.5 2012: R+21.6 2008: R+15.2
Not yet ingested
- Civics
- —
Market trends
- HPI YoY
- ▲ 9.77%
- Current HPI
- 161.7743
- Rent YoY
- —
- Metro
- —
- State GDP YoY
- —
- F500 in state
- 0
Price history
-17.6% since first listed9 events — show timeline
- 2026-05-27 Listed $98,900 MLSNOW
- 2026-03-28 Listing Removed — MLSNOW
- 2025-12-12 Price Changed $98,900 MLSNOW
- 2025-06-27 Price Changed $105,100 MLSNOW
- 2025-06-02 Price Changed $109,900 MLSNOW
- 2025-05-03 Price Changed $119,600 MLSNOW
- 2025-03-27 Listed $130,000 MLSNOW
- 2024-11-01 Listing Removed — MLSNOW
- 2024-05-01 Listed $120,000 MLSNOW
Property tax history
+1.2%/yrLatest (2025): $522 · +4.9% YoY. Source: county tax records.
Cash-flow waterfall
monthlySold comps — $/sqft
last 12 mo · ≤1 miLoading sold comps…