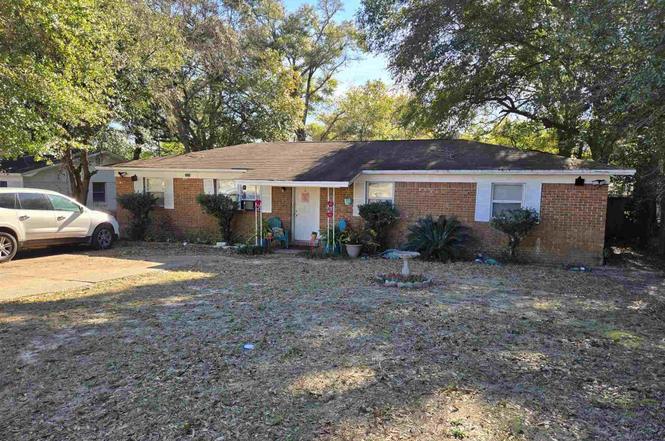
7075 Ben Sasser Dr · Bellview, FL
Flood risk 1/10 · Minimal
- FEMA flood zone
- X (unshaded)
- Chance of flooding over 30 yrs
- 0.0%
- Est. flood insurance / yr
- $507 – $1,088
Fire risk 3/10 · Minor
- Est. fire insurance / yr
- $947 – $1,759
Heat risk 10/10 · Severe
- Hot days now (above 105°F)
- 7 days/yr
- Hot days in 30 yrs
- 24 days/yr
Wind risk 9/10 · Severe
- Chance of severe wind over 30 yrs
- 99.0%
Air-quality risk 1/10 · Minimal
- Unhealthy air days now
- 0 days/yr
- Unhealthy air days in 30 yrs
- 0 days/yr
Risk factors via First Street. Map © Google.
Why this score? — see what drove the B+ grade
The composite is a weighted blend of 9 inputs, each scored 0–100. Each bar is that input's sub-score; the figure is the points it added to the 100-point composite (weight × sub-score).
- Cash flow +30.0/30.0
- ARV discount +15.0/15.0
- DSCR +10.0/10.0
- 1% rule +9.4/10.0
- Schools +3.6/10.0
- Rent growth +3.5/5.0
- Livability +3.4/5.0
- Condition / age +2.5/5.0
- Appreciation +0.0/10.0
$150,000
🖨 Deal sheet (PDF) 📄 Offer letter ✓ Due diligence
Listing remarks MLS
THIS IS ANICE SIZE HOME.. DO NOT LET THE SQUARE FOOTAGE FOOL YOU. TILE KITCHEN AND DINNING AREA, SMOOTH TOP STOVE,MOVEABLE ISLAND/BAR WITH CABINETS AND DRAWS. WASHER AND DRYER REMAIN ( OFFERED AS IS BUT IN GOOD SHAPE) THIS HOME HAS FOUR BEDROOMS THE FOURTH BEDROOM DOES NOT HAVE A CLOSET. BOTH BATHROOMS HAVE SLIDING DOORS IN THE TUB/SHOWER. THE WINDOWS ARE NEW .NICE SIZE LAUNDRY WITH AN EXIT DOOR TO THE BACK YARD. THE SELLER WILL BE CLEANING OUT AND PUTTING A NEW ROOF ON THE YARD BUILDING. CLOSETS ARE SPACIOUS, HOME HAS COAT CLOSET AND LINEN. TRUELY A GREAT STARTER HOME OR FOR THE FAMILY LOOKING TO SIZE DOWN.
Key facts
- 6,969 sq ft lot
- Built 1972
- Listed 117 days
Property features AI
Finance
- Other: Located on a county-maintained road
- HOA & community: No homeowners association
Exterior
- Parking: Driveway with open parking
- Utilities: Public water; Public sewer; Aluminum wiring for electric
- Home design: Single-story brick home; Slab foundation; Composition roof; Resale property; Not attached to another unit; Insulation and insulated walls for energy efficiency; Faces unspecified direction
- Construction: Brick construction; Slab foundation; Composition roof; One level
- Exterior features: Back yard fencing; Central access lot
Interior
- Kitchen: First-floor kitchen (11 x 18); Electric water heater
- Flooring: Vinyl; Carpet; Laminate
- Bathrooms: 2 full bathrooms
- Heating & cooling: Heat pump heating; Heat pump cooling; Ceiling fans
- Interior features: Insulated doors; Kitchen/dining combo
Neighborhood map
What this means for you Summary
Snapshot
- This is a 5-bed/2.0-bath single-family listed at $150k.
Deal economics
- At list price, monthly cash flow is $684 ($8k/yr) — positive.
- The deal already cash-flows at list — no discount required.
- Meets the 1% rule at list price ($2k rent vs $150k).
- Recommended offer: $136k (9.0% below list) — sets the bar for market timing.
- Cap rate 11.8% vs local median 5.2% in Bellview — top-decile yield for the area; either an underpriced asset or a hidden risk that comps aren't pricing in. Stress-test before assuming the spread holds.
Location & tenants
- Location reads 67/100 on livability (#561 in FL) — a middle-class / working-renter tenant base. Strengths: cost of living A+, housing A+; Watch: schools D+, amenities F, commute F.
- Escambia (suburban): math 40% / reading 45% proficiency, ranked #56 of 73 in FL (top 77%) — families likely to look elsewhere, expect single-tenant / working-renter base with shorter leases.
- Market conditions: Rents rising (+3.9%/yr); 270 active listings in the ZIP; 1,479 units permitted in Escambia County in 2024 (0 in 5+ unit buildings).
- This rent runs 42% of the median local income ($62k/yr) — at the standard rent-burdened threshold; future hikes will face affordability resistance.
Forward outlook
- Local home prices are declining (-3.0%/yr); year-one equity from $1k of loan paydown is wiped out by about $4k of value loss. Plan a longer hold.
- Escambia County population projected at +13% by 2050 — modest demand growth; plan on rents tracking national, not racing it.
- At projected returns (-3.0% appreciation + 3.9% rent growth), your $42k cash investment doubles in ~6 years — after that, you're playing with house money.
Negotiation context
- It's been on market 117 days — a 9% lower offer ($136k) is reasonable based on typical stale-listing flexibility.
- 3 sale attempts since 24y ago with the ask held roughly flat each time — persistent listings suggest the price (not the market) is what's stuck; bring a comps-based counter.
- Current owner paid $88k; list at $150k implies a 70% gain — meaningful room to come down on a strong offer.
Risks & watch-outs
- Climate carrying-cost: severe wind risk, 99% chance of damaging wind over 30y; extreme-heat days projected 7→24/yr by 2055 (HVAC capex compounding) — expect insurance premiums to compound above CPI over the hold.
Questions for the listing agent
- It's been on market 117 days. Have you received any prior offers? Is the seller open to a 9% concession, seller financing, or rate buy-down credit?
- Built in 1972 — when were the roof, HVAC, electrical panel, plumbing, and water heater last replaced?
- Why hasn't it sold? Are there any deal-killer items the seller is aware of (foundation, flood, title, zoning, code violations)?
- Is there a deadline driving the sale (1031 exchange, divorce, estate, relocation)? That informs how much negotiation room exists.
- Schools are D-rated, which usually means shorter tenancies and higher turnover. Who's the typical renter profile here, and what's been the actual vacancy rate?
- What's the average days-on-market for RENTAL listings here right now (not sales)? A rising rental-DOM trend means longer vacancies and softer asking-rent achievability than the comps imply.
- What's the recent tenant-quality profile in this submarket — average credit score on applications, eviction rate, late-payment / NSF rate, and stable-employment percentage? A property-management company in the area should have these aggregated.
- How much new for-sale + rental construction is in the pipeline within 1–3 miles? Heavy new supply typically softens prices + rents 12–24 months out; constrained supply supports both.
Investment metrics
- 1% rule
- 1.44% ✓
- Cap rate
- 11.76%
- Cash-on-cash
- 19.54%
- DSCR
- 1.87
- GRM
- 5.8
CMA / ARV
- ARV (on-the-fly)
- $223,772
- Comps found
- 12
Show comp detail 12 sales within ~0.75 mi
| Address | Dist | Beds/Ba | Sqft | Sold | Price | $/sf | Match |
|---|---|---|---|---|---|---|---|
| 7075 Ben Sasser Dr | 0.00mi | 5/2.0 | 1,301 (0%) | 1mo | $103,000 | $79 | 99 |
| 7065 Ben Sasser Dr | 0.01mi | 4/2.0 (-1) | 1,378 (+6%) | 4mo | $236,900 | $172 | 81 |
| 7125 Ben Sasser Dr | 0.07mi | 4/2.0 (-1) | 1,378 (+6%) | 4mo | $235,000 | $171 | 79 |
| 7206 Esther St | 0.58mi | 4/2.0 (-1) | 1,346 (+4%) | 2mo | $221,000 | $164 | 60 |
| 7170 Peninsula Dr | 0.40mi | 4/2.0 (-1) | 1,457 (+12%) | 4mo | $252,000 | $173 | 53 |
| 3020 English Oak Cir | 0.46mi | 6/1.5 (+1) | 1,229 (-6%) | 12mo | $173,000 | $141 | 52 |
| 7837 Lenora Ct | 0.74mi | 4/2.0 (-1) | 1,323 (+2%) | 8mo | $233,500 | $176 | 51 |
| 7109 Redondo Dr | 0.48mi | 4/2.0 (-1) | 1,474 (+13%) | 2mo | $233,000 | $158 | 49 |
| 3000 King St | 0.52mi | 6/2.0 (+1) | 1,271 (-2%) | 24mo | $255,000 | $201 | 47 |
| 7126 Redondo Dr | 0.51mi | 4/2.0 (-1) | 1,365 (+5%) | 22mo | $240,000 | $176 | 44 |
| 6827 Stonehenge Cir | 0.64mi | 6/2.0 (+1) | 1,378 (+6%) | 19mo | $218,000 | $158 | 40 |
| 6819 Derwent Cir | 0.54mi | 4/3.0 (-1) | 1,425 (+10%) | 23mo | $295,000 | $207 | 30 |
Match score weights: distance 35% · size 25% · config 20% · recency 20%. Top-matched comps best support the ARV.
Projected returns pro-forma
-3.0% appreciation · 3.85% rent growth · sell at horizon
- IRR
- 12.5%
- Equity multiple
- 1.50×
- Total profit
- $21,144
- Equity at exit
- $22,365
- IRR
- 22.1%
- Equity multiple
- 2.96×
- Total profit
- $82,395
- Equity at exit
- $12,969
Cash invested: $42,000 (down + closing). Projections, not guarantees.
Landlord ↔ Tenant lean methodology
- Overall (STATE)
- 87 Strongly Landlord-Friendly
- State Florida
- 87 Strongly Landlord-Friendly · R+3
- County
- — inherits STATE
- City
- — inherits STATE
ZIP-level market 32506
- Home prices YoY
- -22.5%
- Rents YoY
- 3.9%
- Active inventory
- 270
- Price-to-rent
- 5.8×
Monthly cashflow live
- Estimated rent
- $2,163 medium interval (Pro) →
- Mortgage (P&I)
- −$787
- Tax from tax record
- −$176 /mo · $2,112/yr
- Insurance
- −$62
- HOA
- −$0
- Vacancy / Maint / Mgmt
- −$454
- Net cashflow
- $684
Break-even live
Sensitivity live
| Price | -10% $769 | -5% $726 | +0% $684 | +5% $641 | +10% $599 |
|---|---|---|---|---|---|
| Rent | -10% $513 | -5% $598 | +0% $684 | +5% $769 | +10% $855 |
| Rate | -1.0pp $759 | -0.5pp $722 | base $684 | +0.5pp $645 | +1.0pp $606 |
UW: 25.0% down · 7.5% · 30yr · 1.5% tax · 5.0% vac · 8.0% maint · 8.0% mgmt
Financing live
Cash to close
- Down payment
- $37,500
- Closing costs
- $4,500
- Reserves months
- —
- Total cash needed
- —
Loan-product check · same deal, 3 products live
Conventional
25% down · 7.5% · 30yr
- Down + closing
- —
- Monthly P&I
- —
- Monthly cashflow
- —
- DSCR
- —
- Eligible?
- —
Personal DTI + credit; lowest rate.
DSCR
20% down · 8.5% · 30yr
- Down + closing
- —
- Monthly P&I
- —
- Monthly cashflow
- —
- DSCR
- —
- Eligible?
- —
No personal income docs; deal must DSCR.
Hard money
10% down · 12.0% · 12mo
- Down + closing
- —
- Monthly P&I
- —
- Monthly cashflow
- —
- DSCR
- —
- Eligible?
- —
Short-term bridge; refi at stabilization.
Listing history 12 events
-
2026-06-01statusdays on market $150,000 Pending 117 DOM
-
2026-05-31days on market $150,000 Contingent 116 DOM
-
2026-05-31days on market $150,000 Contingent 115 DOM
-
2026-05-02historical Contingent
-
2026-02-04$150,000 Active
-
2005-06-14soldstatus $88,300
-
2005-05-20soldstatus $88,300 620-char remark
Show marketing remark (620 chars)
THIS IS ANICE SIZE HOME.. DO NOT LET THE SQUARE FOOTAGE FOOL YOU. TILE KITCHEN AND DINNING AREA, SMOOTH TOP STOVE,MOVEABLE ISLAND/BAR WITH CABINETS AND DRAWS. WASHER AND DRYER REMAIN ( OFFERED AS IS BUT IN GOOD SHAPE) THIS HOME HAS FOUR BEDROOMS THE FOURTH BEDROOM DOES NOT HAVE A CLOSET. BOTH BATHROOMS HAVE SLIDING DOORS IN THE TUB/SHOWER. THE WINDOWS ARE NEW .NICE SIZE LAUNDRY WITH AN EXIT DOOR TO THE BACK YARD. THE SELLER WILL BE CLEANING OUT AND PUTTING A NEW ROOF ON THE YARD BUILDING. CLOSETS ARE SPACIOUS, HOME HAS COAT CLOSET AND LINEN. TRUELY A GREAT STARTER HOME OR FOR THE FAMILY LOOKING TO SIZE DOWN.
-
2005-03-25$88,300 620-char remark
Show marketing remark (620 chars)
THIS IS ANICE SIZE HOME.. DO NOT LET THE SQUARE FOOTAGE FOOL YOU. TILE KITCHEN AND DINNING AREA, SMOOTH TOP STOVE,MOVEABLE ISLAND/BAR WITH CABINETS AND DRAWS. WASHER AND DRYER REMAIN ( OFFERED AS IS BUT IN GOOD SHAPE) THIS HOME HAS FOUR BEDROOMS THE FOURTH BEDROOM DOES NOT HAVE A CLOSET. BOTH BATHROOMS HAVE SLIDING DOORS IN THE TUB/SHOWER. THE WINDOWS ARE NEW .NICE SIZE LAUNDRY WITH AN EXIT DOOR TO THE BACK YARD. THE SELLER WILL BE CLEANING OUT AND PUTTING A NEW ROOF ON THE YARD BUILDING. CLOSETS ARE SPACIOUS, HOME HAS COAT CLOSET AND LINEN. TRUELY A GREAT STARTER HOME OR FOR THE FAMILY LOOKING TO SIZE DOWN.
-
2003-05-15historical
-
2002-11-15$65,900
-
1990-03-01soldstatus $50,000
-
1979-10-01soldstatus $30,400
ⓘ Source: listings_history table (triggers on properties + properties_extension) + one-shot
backfill from property_details.listing_events for pre-trigger history.
Tax reassessment forecast FL · Resets to sale price
- Current annual tax
- $2,112 · $176/mo
- Projected year-2 tax
- $2,112 · $176/mo
- Expected delta
- $0/yr ($0/mo · 0.0%)
ⓘ Screening estimate from a state-policy table — verify with the county assessor before closing.
Climate risk First Street
- Flood 1/10 Low FEMA zone X (unshaded) · 0% chance over 30 yrs
- Wildfire 3/10 Moderate
- Heat 10/10 Extreme 7 d/yr ≥105°F today · 24 d/yr by 30 yrs out
- Wind 9/10 Extreme 99% chance of damaging wind over 30 yrs
- Air quality 1/10 Low 0 unhealthy d/yr today · 0 by 30 yrs out
Nearby sold comps map
Loading sold comps map…
Walkable amenities ~0.75 mi
Loading nearby amenities…
Taxation est. · year 1
- Rental income
- $25,960
- − Mortgage interest
- −$8,402
- − Property taxes
- −$2,112
- − Insurance
- −$750
- − Repairs & maintenance
- −$2,077
- − Management
- −$2,077
- − Depreciation
- −$4,364
- Taxable income
- $6,178
- Est. tax owed @ 24.0%
- −$1,483
- After-tax cash flow
- $6,724/yr
For passive investors: Depreciation is non-cash, so a rental often shows a tax loss while cash-flowing — sheltering income. Rental losses are passive: they offset passive income freely, and up to $25,000/yr can offset ordinary (W-2) income if you actively participate and your MAGI is under $100k (phasing out to $0 by $150k); unused losses carry forward. On sale, claimed depreciation is recaptured at up to 25%, and gains may owe capital-gains tax (a 1031 exchange can defer both). Figures are a year-1 estimate at your 24.0% rate — not tax advice; consult a CPA.
Schools (NCES district)
- District
- Escambia
- NCES district ID
- 1200510
- Math proficiency
- 40% ▼ -9.00%
- Reading proficiency
- 45% ▼ -4.00%
- Median HH income
- $44,649
- Composite
- 36.04/100
- National rank
- #4773
- State rank
- #56 of 73 in FL
Livability — Bellview
- Score
- 67/100
- State rank
- #561
- US rank
- #10731
Category grades
Schools grade is shown separately in the Schools card above.
Census & demographics
- Census place
- Bellview, FL
- County
- Escambia County · 301,722 people
- Metro
- Pensacola-Ferry Pass-Brent, FL
- Population (ZIP)
- 34,549
- Household income
- $62,486
- Rent vs Own
- Severe rent burden
- 1359.0
Population outlook (Escambia County) Hauer SSP2
- Today (2025)
- 334,637 people
- By 2030
- 345,779 · +3.3%
- By 2040
- 364,828 · +9.0%
- By 2050
- 378,514 · +13.1%
- By 2075
- 403,220 · +20.5%
- By 2100
- 386,125 · +15.4%
Race, ethnicity, and origin ACS 2023
- Neighborhood character
- Diverse neighborhood (Simpson 0.60)
- Race & ethnicity
- White 60% Black 18% Two or more races 11% Hispanic / Latino 6% Asian 6%
- Hispanic origin (detail)
- Mexican 3%
- Common ancestry
- Lithuanian 4% Slovak 2% Italian 2%
- Foreign-born
- 9% · Canada, China, Vietnam
- Languages at home
- 89% English-only · Spanish 4% Tagalog/Filipino 2% Other Indo-European 1%
Political lean MEDSL · Escambia
- 2024 margin
- R (+19.5) · D 39.7% · R 59.2% · Other 1.1%
- 2008→2024 swing
- -0.2pp no change · 2008: -19.3pp · 2024: -19.5pp
- All cycles
- 2024: R+19.5 2020: R+15.1 2016: R+20.6 2012: R+20.6 2008: R+19.3
Not yet ingested
- Civics
- —
Market trends
- HPI YoY
- ▼ -71.86%
- Current HPI
- 247.6085
- Rent YoY
- ▲ 3.85%
- Metro
- Pensacola-Ferry Pass-Brent, FL
- State GDP YoY
- ▲ 3.28%
- F500 in state
- 36
Industry mix (Fortune 500 HQ in FL)
| Industry | F500 HQs | Revenue |
|---|---|---|
| Industrial Technology | 2 | $29B |
|
||
| Insurance | 2 | $17B |
|
||
| Retail | 1 | $60B |
|
||
| Technology Distribution | 1 | $58B |
|
||
| Homebuilding | 1 | $35B |
|
||
| Technology Manufacturing | 1 | $35B |
|
||
Price history
+393.4% since first listed9 events — show timeline
- 2026-05-02 Contingent — PARMLS
- 2026-02-04 Listed $150,000 PARMLS
- 2005-06-14 Sold (Public Records) $88,300 Public Records
- 2005-05-20 Sold (MLS) $88,300 PARMLS
- 2005-03-25 Listed $88,300 PARMLS
- 2003-05-15 Listing Removed — PARMLS
- 2002-11-15 Listed $65,900 PARMLS
- 1990-03-01 Sold (Public Records) $50,000 Public Records
- 1979-10-01 Sold (Public Records) $30,400 Public Records
Property tax history
+7.3%/yrLatest (2025): $2,112 · +14.9% YoY. Source: county tax records.
Cash-flow waterfall
monthlySold comps — $/sqft
last 12 mo · ≤1 miLoading sold comps…