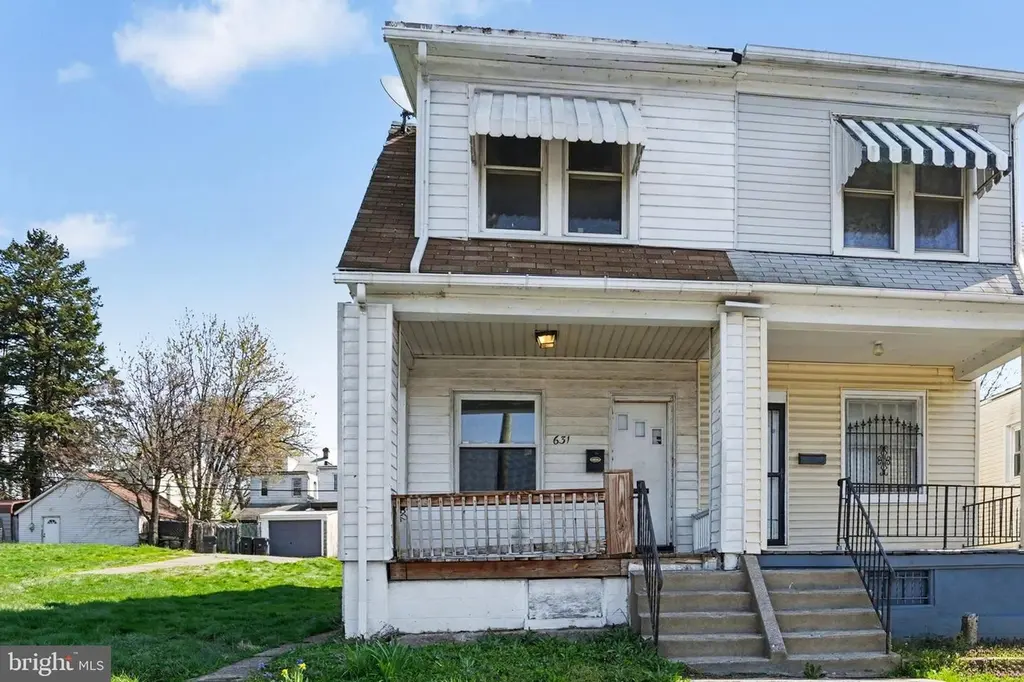
631 Dunkle St · Harrisburg, PA
Flood risk 1/10 · Minimal
- FEMA flood zone
- X (unshaded)
- Chance of flooding over 30 yrs
- 0.0%
- Est. flood insurance / yr
- $473 – $860
Fire risk 1/10 · Minimal
- Est. fire insurance / yr
- $511 – $949
Heat risk 5/10 · Moderate
- Hot days now (above 100°F)
- 7 days/yr
- Hot days in 30 yrs
- 15 days/yr
Wind risk 2/10 · Minimal
- Chance of severe wind over 30 yrs
- 5.0%
Air-quality risk 2/10 · Minimal
- Unhealthy air days now
- 1 days/yr
- Unhealthy air days in 30 yrs
- 3 days/yr
Risk factors via First Street. Map © Google.
Why this score? — see what drove the B grade
The composite is a weighted blend of 9 inputs, each scored 0–100. Each bar is that input's sub-score; the figure is the points it added to the 100-point composite (weight × sub-score).
- Cash flow +29.6/30.0
- ARV discount +13.7/15.0
- DSCR +10.0/10.0
- 1% rule +9.1/10.0
- Livability +4.2/5.0
- Rent growth +3.6/5.0
- Condition / age +2.5/5.0
- Schools +0.8/10.0
- Appreciation +0.0/10.0
$104,999
🖨 Deal sheet 📄 Offer letter ✓ Due diligence
Listing remarks MLS
Fix & Flip Alert — Strong Equity Potential in a Prime Location. Investors, take note. This semi-detached 3-bed, 1-bath home is priced to move and ready for your vision. The open floor plan — living room, dining room, galley kitchen, and first-floor den — offers a flexible canvas with solid bones. Important updates already done: vinyl replacement windows and forced air gas heat. Outside, a large deck leads to an oversized detached garage with separate storage — a rare and valuable addition. Located minutes from the Downtown Entertainment District, the Waterfront, and the Broad Street Market. The neighborhood is strong, the upside is real, and opportunities like this don’t sit long. Move fast. Make this Your Next Investment Today!
Key facts
- Large deck
- Open floor plan
- Separate storage
Tags
Neighborhood map
What this means for you Summary
Snapshot
- This is a 3-bed/1.0-bath single-family listed at $105k.
Deal economics
- At list price, monthly cash flow is $378 ($5k/yr) — positive.
- The deal already cash-flows at list — no discount required.
- Meets the 1% rule at list price ($1k rent vs $105k).
- Recommended offer: $99k (6.0% below list) — sets the bar for market timing.
- Cap rate 10.6% vs local median 6.6% in Harrisburg — top-decile yield for the area; either an underpriced asset or a hidden risk that comps aren't pricing in. Stress-test before assuming the spread holds.
Location & tenants
- Location reads 84/100 on livability (#107 in PA, #826 nationally) — a professional / high-income tenant draw. Strengths: amenities A+, commute A+, cost of living A+; Watch: schools C-, employment D, crime F.
- Harrisburg City SD (urban): math 6% / reading 13% proficiency, ranked #535 of 539 in PA (top 99%) — low school quality limits family demand, transient renter base, plan for 1-2y turnover; 82% free/reduced lunch — lower-income household profile, screen leases tightly.
- Market conditions: Rents rising fast (+4.4%/yr); 67 active listings in the ZIP; 27 comparable units currently listed for rent nearby; rentals at typical pace (median 24d on market — plan ~3-4 weeks tenant-placement turnaround); 48% of comp listings sitting > 30 days — soft ceiling on asking rent; 540 units permitted in Dauphin County in 2024 (194 in 5+ unit buildings).
- This rent runs 38% of the median local income ($47k/yr) — at the standard rent-burdened threshold; future hikes will face affordability resistance.
Forward outlook
- Local home prices are declining (-3.0%/yr); year-one equity from $726 of loan paydown is wiped out by about $3k of value loss. Plan a longer hold.
- At projected returns (-3.0% appreciation + 4.4% rent growth), your $29k cash investment doubles in ~7 years — after that, you're playing with house money.
Negotiation context
- It's been on market 68 days — a 6% lower offer ($99k) is reasonable based on typical stale-listing flexibility.
- 7 sale attempts since 23y ago; this cycle's ask has dropped $20k (16%) from the opening price — seller is motivated, your offer sets the floor, not the list.
- Current owner paid $80k; 31% above their basis — modest negotiation headroom, anchor on the comps not their cost.
Risks & watch-outs
- Watch-outs: built in 1920 — expect roof / HVAC / electrical / plumbing capex.
- Climate carrying-cost: extreme-heat days projected 7→15/yr by 2055 (HVAC capex compounding) — expect insurance premiums to compound above CPI over the hold.
Questions for the listing agent
- It's been on market 68 days. Have you received any prior offers? Is the seller open to a 6% concession, seller financing, or rate buy-down credit?
- Built in 1920 — when were the roof, HVAC, electrical panel, plumbing, and water heater last replaced?
- Why hasn't it sold? Are there any deal-killer items the seller is aware of (foundation, flood, title, zoning, code violations)?
- Is there a deadline driving the sale (1031 exchange, divorce, estate, relocation)? That informs how much negotiation room exists.
- Crime grade is F in this area — have there been break-ins, vandalism, or insurance claims at this property in the last 3 years? What carrier currently insures it and at what premium?
- What's the average days-on-market for RENTAL listings here right now (not sales)? A rising rental-DOM trend means longer vacancies and softer asking-rent achievability than the comps imply.
- What's the recent tenant-quality profile in this submarket — average credit score on applications, eviction rate, late-payment / NSF rate, and stable-employment percentage? A property-management company in the area should have these aggregated.
- How much new for-sale + rental construction is in the pipeline within 1–3 miles? Heavy new supply typically softens prices + rents 12–24 months out; constrained supply supports both.
Investment metrics
- 1% rule
- 1.41% ✓
- Cap rate
- 10.61%
- Cash-on-cash
- 15.43%
- DSCR
- 1.69
- GRM
- 5.9
CMA / ARV
- ARV (median comp)
- $121,843
- List price
- $104,999
- Delta
- -13.82%
- Verdict
- UNDERPRICED
- Comps
- 20 within 1.0 mi
Show comp detail 12 sales within ~0.75 mi
| Address | Dist | Beds/Ba | Sqft | Sold | Price | $/sf | Match |
|---|---|---|---|---|---|---|---|
| 1216 S 19th St | 0.54mi | 3/1.0 | 1,300 (-5%) | 4mo | $198,000 | $152 | 63 |
| 1809 Sycamore St | 0.42mi | 3/1.5 | 1,411 (+3%) | 15mo | $215,000 | $152 | 61 |
| 2444 Derry St | 0.59mi | 2/1.0 (-1) | 1,416 (+3%) | 2mo | $115,000 | $81 | 60 |
| 2133 Rudy Rd | 0.40mi | 3/1.0 | 1,311 (-4%) | 17mo | $210,000 | $160 | 60 |
| 625 S 26th St | 0.73mi | 3/1.0 | 1,307 (-5%) | 8mo | $180,000 | $138 | 51 |
| 2009 Manada St | 0.26mi | 3/1.0 | 1,541 (+12%) | 21mo | $125,000 | $81 | 50 |
| 1121 S 19th St | 0.42mi | 3/1.5 | 1,562 (+14%) | 7mo | $142,000 | $91 | 49 |
| 1029 S 17th St | 0.44mi | 3/1.0 | 1,176 (-14%) | 9mo | $170,000 | $145 | 48 |
| 2301 Luce St | 0.43mi | 3/2.0 | 1,250 (-9%) | 18mo | $199,900 | $160 | 46 |
| 1725 Sycamore St | 0.44mi | 2/1.5 (-1) | 1,173 (-14%) | 7mo | $125,000 | $107 | 42 |
| 1701 Sycamore St | 0.46mi | 3/1.5 | 1,534 (+12%) | 19mo | $200,000 | $130 | 41 |
| 633 S 26th St | 0.73mi | 3/1.0 | 1,459 (+6%) | 21mo | $183,000 | $125 | 38 |
Match score weights: distance 35% · size 25% · config 20% · recency 20%. Top-matched comps best support the ARV.
Projected returns pro-forma
-3.0% appreciation · 4.43% rent growth · sell at horizon
- IRR
- 7.9%
- Equity multiple
- 1.32×
- Total profit
- $9,285
- Equity at exit
- $15,656
- IRR
- 18.5%
- Equity multiple
- 2.65×
- Total profit
- $48,465
- Equity at exit
- $9,078
Cash invested: $29,400 (down + closing). Projections, not guarantees.
Landlord ↔ Tenant lean methodology
- Overall (STATE)
- 62 Landlord-Friendly
- State Pennsylvania
- 62 Landlord-Friendly · EVEN
- County
- — inherits STATE
- City
- — inherits STATE
ZIP-level market 17104
- Home prices YoY
- -6.3%
- Rents YoY
- 4.4%
- Active inventory
- 67
- Price-to-rent
- 5.9×
Monthly cashflow live
- Estimated rent
- $1,480 high interval (Pro) →
- Mortgage (P&I)
- −$551
- Tax from tax record
- −$197 /mo · $2,359/yr
- Insurance
- −$44
- HOA
- −$0
- Vacancy / Maint / Mgmt
- −$311
- Net cashflow
- $378
Break-even live
UW: 25.0% down · 7.5% · 30yr · 1.5% tax · 5.0% vac · 8.0% maint · 8.0% mgmt
Financing live
Cash to close
- Down payment
- $26,250
- Closing costs
- $3,150
- Reserves months
- —
- Total cash needed
- —
Loan-product check · same deal, 3 products live
Conventional
25% down · 7.5% · 30yr
- Down + closing
- —
- Monthly P&I
- —
- Monthly cashflow
- —
- DSCR
- —
- Eligible?
- —
Personal DTI + credit; lowest rate.
DSCR
20% down · 8.5% · 30yr
- Down + closing
- —
- Monthly P&I
- —
- Monthly cashflow
- —
- DSCR
- —
- Eligible?
- —
No personal income docs; deal must DSCR.
Hard money
10% down · 12.0% · 12mo
- Down + closing
- —
- Monthly P&I
- —
- Monthly cashflow
- —
- DSCR
- —
- Eligible?
- —
Short-term bridge; refi at stabilization.
Rent comps 27 comps
| Address | Beds | Baths | Sqft | Rent | $/sqft | DOM | Units | Dist |
|---|---|---|---|---|---|---|---|---|
| 1728 Paxton St Harrisburg, PA | 3.0 | 1.5 | 1320 | $1,295 | $0.98 | 14d | 1 | 0.28mi |
| 1615 Naudain St Harrisburg, PA | 3.0 | 1.0 | 1148 | $1,400 | $1.22 | 44d | 1 | 0.32mi |
| 2016 Swatara St Harrisburg, PA | 3.0 | 1.0 | 1380 | $1,175 | $0.85 | 44d | 1 | 0.33mi |
| 2121 Kensington St Harrisburg, PA | 3.0 | 1.0 | 1088 | $1,450 | $1.33 | 44d | 1 | 0.33mi |
| 1610 Hunter St Harrisburg, PA | 4.0 | 1.0 | 1776 | $1,450 | $0.82 | 23d | 1 | 0.38mi |
| 649 S 23rd St Harrisburg, PA | 3.0 | 1.0 | 1450 | $1,465 | $1.01 | 21d | 1 | 0.45mi |
| 649 S 23rd St Unit 1 Harrisburg, PA | 3.0 | 1.0 | 1450 | $1,465 | $1.01 | 44d | 1 | 0.45mi |
| 1429 Naudain St Harrisburg, PA | 3.0 | 1.0 | 1254 | $1,400 | $1.12 | 23d | 1 | 0.45mi |
| 337 S 15th St Harrisburg, PA | 3.0 | 1.0 | 1440 | $1,195 | $0.83 | 21d | 1 | 0.51mi |
| 349 S 14th St Harrisburg, PA | 3.0 | 1.0 | 1544 | $1,450 | $0.94 | 23d | 1 | 0.56mi |
| 2410 Kensington St Harrisburg, PA | 3.0 | 1.0 | 1024 | $1,495 | $1.46 | 44d | 1 | 0.63mi |
| 331 Hummel St Unit B Harrisburg, PA | 3.0 | 1.0 | 1590 | $1,800 | $1.13 | 44d | 1 | 0.69mi |
| 331 Hummel St Unit A Harrisburg, PA | 2.0 | 1.0 | 1590 | $1,400 | $0.88 | 44d | 1 | 0.69mi |
| 52 N 18th St Harrisburg, PA | 3.0 | 1.0 | 1100 | $1,250 | $1.14 | 14d | 1 | 0.82mi |
| 1139 Mulberry St Harrisburg, PA | 1.0–3.0 | 1.0 | 900 | $1,185 | $1.32 | 44d | 1 | 0.88mi |
| 1207 Market St Harrisburg, PA | 4.0 | 1.5 | 1423 | $1,995 | $1.40 | 44d | 1 | 0.93mi |
| 1251 Bailey St Harrisburg, PA | 3.0 | 1.0 | 1200 | $1,500 | $1.25 | 44d | 1 | 0.93mi |
| 1517 Walnut St Harrisburg, PA | 3.0 | 1.0 | 1172 | $1,150 | $0.98 | 44d | 1 | 0.94mi |
| 21 Summit St Harrisburg, PA | 3.0 | 1.0 | 1200 | $1,550 | $1.29 | 14d | 1 | 0.99mi |
| 200 S Court St Harrisburg, PA | 1.0–3.0 | 1.0–2.5 | 950 | $1,800 | $1.89 | 14d | 14 | 1.15mi |
| 301 Chestnut St Harrisburg, PA | 1.0–4.0 | 1.0–2.5 | 1437 | $2,097 | $1.46 | 44d | 1 | 1.19mi |
| 301 Chestnut St Harrisburg, PA | 4.0 | 1.0–2.5 | 1437 | $2,525 | $1.76 | 14d | 10 | 1.19mi |
| 101 S 2nd St Harrisburg, PA | 2.0 | 1.0 | 736 | $1,749 | $2.37 | 14d | 32 | 1.23mi |
| 319 Market St Harrisburg, PA | 2.0 | 1.5 | 990 | $1,135 | $1.15 | 44d | 1 | 1.28mi |
| 3106 Hoffer St Unit 3106 Penbrook, PA | 2.0 | 1.0 | 900 | $1,675 | $1.86 | 14d | 1 | 1.28mi |
| 589 Yale St Harrisburg, PA | 2.0 | 2.0 | 911 | $1,549 | $1.70 | 14d | 1 | 1.42mi |
| 210 Walnut St Unit 206 Harrisburg, PA | 2.0 | 1.0 | 1007 | $1,695 | $1.68 | 14d | 1 | 1.45mi |
Listing history 40 events
-
2026-06-18days on market $104,999 Active 68 DOM
-
2026-06-17days on market $104,999 Active 67 DOM
-
2026-06-16remarks 549-char remark
-
2026-06-16pricedays on market $104,999 Active 66 DOM
-
2026-06-15days on market $109,950 Active 65 DOM
-
2026-06-14days on market $109,950 Active 63 DOM
-
2026-06-13days on market $109,950 Active 62 DOM
-
2026-06-10days on market $109,950 Active 60 DOM
-
2026-06-09days on market $109,950 Active 59 DOM
-
2026-06-08days on market $109,950 Active 58 DOM
-
2026-06-07days on market $109,950 Active 57 DOM
-
2026-06-03days on market $109,950 Active 53 DOM
-
2026-06-02days on market $109,950 Active 52 DOM
-
2026-06-01days on market $109,950 Active 51 DOM
-
2026-05-31days on market $109,950 Active 50 DOM
-
2026-05-31days on market $109,950 Active 49 DOM
-
2026-04-15price $119,999 774-char remark
Show marketing remark (774 chars)
Fix & Flip Alert — Strong Equity Potential in a Prime Location. Investors, take note. This semi-detached 3-bed, 1-bath home is priced to move and ready for your vision. The open floor plan — living room, dining room, galley kitchen, and first-floor den — offers a flexible canvas with solid bones. Important updates already done: vinyl replacement windows and forced air gas heat. Outside, a large deck leads to an oversized detached garage with separate storage — a rare and valuable addition. Located minutes from the Downtown Entertainment District, the Waterfront, and the Broad Street Market. The neighborhood is strong, the upside is real, and opportunities like this don’t sit long. Move fast. Make this Your Next Investment Today!
-
2026-04-11$124,999 Active 774-char remark
Show marketing remark (774 chars)
Fix & Flip Alert — Strong Equity Potential in a Prime Location. Investors, take note. This semi-detached 3-bed, 1-bath home is priced to move and ready for your vision. The open floor plan — living room, dining room, galley kitchen, and first-floor den — offers a flexible canvas with solid bones. Important updates already done: vinyl replacement windows and forced air gas heat. Outside, a large deck leads to an oversized detached garage with separate storage — a rare and valuable addition. Located minutes from the Downtown Entertainment District, the Waterfront, and the Broad Street Market. The neighborhood is strong, the upside is real, and opportunities like this don’t sit long. Move fast. Make this Your Next Investment Today!
-
2026-04-08soldstatus $80,000
-
2026-03-31soldstatus $80,000 Closed 406-char remark
Show marketing remark (406 chars)
Investor alert in Harrisburg. This 3 bedroom half double with 2 car garage sits just minutes from downtown and offers strong potential for a savvy buyer looking for their next project or rental addition. Solid layout with great upside in a convenient location close to shopping, dining, and major routes. Cash buyers only. Opportunities like this move fast so schedule your showing today before it is gone.
-
2026-03-17status Pending 406-char remark
Show marketing remark (406 chars)
Investor alert in Harrisburg. This 3 bedroom half double with 2 car garage sits just minutes from downtown and offers strong potential for a savvy buyer looking for their next project or rental addition. Solid layout with great upside in a convenient location close to shopping, dining, and major routes. Cash buyers only. Opportunities like this move fast so schedule your showing today before it is gone.
-
2026-03-16$70,000 Active 406-char remark
Show marketing remark (406 chars)
Investor alert in Harrisburg. This 3 bedroom half double with 2 car garage sits just minutes from downtown and offers strong potential for a savvy buyer looking for their next project or rental addition. Solid layout with great upside in a convenient location close to shopping, dining, and major routes. Cash buyers only. Opportunities like this move fast so schedule your showing today before it is gone.
-
2017-12-07soldstatus $64,900
-
2017-11-30soldstatus $64,900
-
2017-10-17historical
-
2017-05-22$64,900
-
2016-09-30historical
-
2015-10-21$57,000
-
2011-02-24soldstatus $81,000
-
2011-02-15soldstatus $81,000
-
2011-01-07historical
-
2010-11-16$84,900
-
2010-07-26soldstatus $31,250
-
2010-07-07historical
-
2010-04-28$34,900
-
2003-11-13soldstatus $49,900
-
2003-05-30soldstatus $25,000
-
2003-04-10$27,000
-
2003-04-10historical
-
1995-06-06soldstatus $43,000
ⓘ Source: listings_history table (triggers on properties + properties_extension) + one-shot
backfill from property_details.listing_events for pre-trigger history.
Tax reassessment forecast PA · Partial reset (capped growth)
- Current annual tax
- $2,359 · $197/mo
- Projected year-2 tax
- $2,359 · $197/mo
- Expected delta
- $0/yr ($0/mo · 0.0%)
ⓘ Screening estimate from a state-policy table — verify with the county assessor before closing.
Climate risk First Street
- Flood 1/10 Low FEMA zone X (unshaded) · 0% chance over 30 yrs
- Wildfire 1/10 Low
- Heat 5/10 Major 7 d/yr ≥100°F today · 15 d/yr by 30 yrs out
- Wind 2/10 Low 5% chance of damaging wind over 30 yrs
- Air quality 2/10 Low 1 unhealthy d/yr today · 3 by 30 yrs out
Nearby sold comps map
Loading sold comps map…
Walkable amenities ~0.75 mi
Loading nearby amenities…
Taxation est. · year 1
- Rental income
- $17,757
- − Mortgage interest
- −$5,882
- − Property taxes
- −$2,359
- − Insurance
- −$525
- − Repairs & maintenance
- −$1,421
- − Management
- −$1,421
- − Depreciation
- −$3,055
- Taxable income
- $3,096
- Est. tax owed @ 24.0%
- −$743
- After-tax cash flow
- $3,793/yr
For passive investors: Depreciation is non-cash, so a rental often shows a tax loss while cash-flowing — sheltering income. Rental losses are passive: they offset passive income freely, and up to $25,000/yr can offset ordinary (W-2) income if you actively participate and your MAGI is under $100k (phasing out to $0 by $150k); unused losses carry forward. On sale, claimed depreciation is recaptured at up to 25%, and gains may owe capital-gains tax (a 1031 exchange can defer both). Figures are a year-1 estimate at your 24.0% rate — not tax advice; consult a CPA.
Schools (NCES district)
- District
- Harrisburg City SD
- NCES district ID
- 4211580
- Math proficiency
- 6% ▼ -6.00%
- Reading proficiency
- 13% ▼ -10.00%
- Median HH income
- $33,432
- Composite
- 7.6/100
- National rank
- #9945
- State rank
- #535 of 539 in PA
Livability — Harrisburg
- Score
- 84/100
- State rank
- #107
- US rank
- #826
Category grades
Schools grade is shown separately in the Schools card above.
Census & demographics
- Census place
- Harrisburg, PA
- County
- Dauphin County · 247,857 people
- City population
- 184,296
- Metro
- Harrisburg-Carlisle, PA
- Population (ZIP)
- 18,541
- Household income
- $46,510
- Rent vs Own
- Severe rent burden
- 1166.0
Population outlook (Dauphin County) Hauer SSP2
- Today (2025)
- 281,628 people
- By 2030
- 283,549 · +0.7%
- By 2040
- 285,385 · +1.3%
- By 2050
- 286,188 · +1.6%
- By 2075
- 291,053 · +3.3%
- By 2100
- 282,374 · +0.3%
Race, ethnicity, and origin ACS 2023
- Neighborhood character
- Diverse neighborhood (Simpson 0.69)
- Race & ethnicity
- Black 44% Hispanic / Latino 29% White 19% Two or more races 12% Asian 3% Native American 1%
- Hispanic origin (detail)
- Puerto Rican 21% Dominican 6%
- Common ancestry
- Polish 1% Romanian 1% Slovak 1%
- Foreign-born
- 10% · Canada, China, Vietnam
- Languages at home
- 73% English-only · Spanish 21% Other Indo-European 1% Chinese 1%
Political lean MEDSL · Dauphin
- 2024 margin
- Lean D (+5.9) · D 52.4% · R 46.5% · Other 1.1%
- 2008→2024 swing
- -3.1pp toward R · 2008: 9.1pp · 2024: 5.9pp
- All cycles
- 2024: D+5.9 2020: D+8.5 2016: D+2.8 2012: D+6.0 2008: D+9.1
Not yet ingested
- Civics
- —
Market trends
- HPI YoY
- ▼ -22.83%
- Current HPI
- 340.2808
- Rent YoY
- ▲ 4.43%
- Metro
- Harrisburg-Carlisle, PA
- State GDP YoY
- ▲ 1.68%
- F500 in state
- 34
Industry mix (Fortune 500 HQ in PA)
| Industry | F500 HQs | Revenue |
|---|---|---|
| Healthcare | 2 | $309B |
|
||
| Insurance | 2 | $27B |
|
||
| Telecommunications / Media | 1 | $124B |
|
||
| Industrial Distribution | 1 | $22B |
|
||
| Financial Services | 1 | $20B |
|
||
| Chemicals / Materials | 1 | $18B |
|
||
Price history
+179.1% since first listed24 events — show timeline
- 2026-04-15 Price Changed $119,999 BRIGHT MLS
- 2026-04-11 Listed $124,999 BRIGHT MLS
- 2026-04-08 Sold (Public Records) $80,000 Public Records
- 2026-03-31 Sold (MLS) $80,000 BRIGHT MLS
- 2026-03-17 Pending — BRIGHT MLS
- 2026-03-16 Listed $70,000 BRIGHT MLS
- 2017-12-07 Sold (Public Records) $64,900 Public Records
- 2017-11-30 Sold (MLS) $64,900 BRIGHT MLS
- 2017-10-17 Listing Removed — BRIGHT MLS
- 2017-05-22 Listed $64,900 BRIGHT MLS
- 2016-09-30 Listing Removed — BRIGHT MLS
- 2015-10-21 Listed $57,000 BRIGHT MLS
- 2011-02-24 Sold (Public Records) $81,000 Public Records
- 2011-02-15 Sold (MLS) $81,000 BRIGHT MLS
- 2011-01-07 Listing Removed — BRIGHT MLS
- 2010-11-16 Listed $84,900 BRIGHT MLS
- 2010-07-26 Sold (MLS) $31,250 BRIGHT MLS
- 2010-07-07 Listing Removed — BRIGHT MLS
- 2010-04-28 Listed $34,900 BRIGHT MLS
- 2003-11-13 Sold (Public Records) $49,900 Public Records
- 2003-05-30 Sold (MLS) $25,000 BRIGHT MLS
- 2003-04-10 Listing Removed — BRIGHT MLS
- 2003-04-10 Listed $27,000 BRIGHT MLS
- 1995-06-06 Sold (Public Records) $43,000 Public Records
Property tax history
+1.0%/yrLatest (2026): $2,359 · +1.7% YoY. Source: county tax records.
Cash-flow waterfall
monthlySold comps — $/sqft
last 12 mo · ≤1 miLoading sold comps…