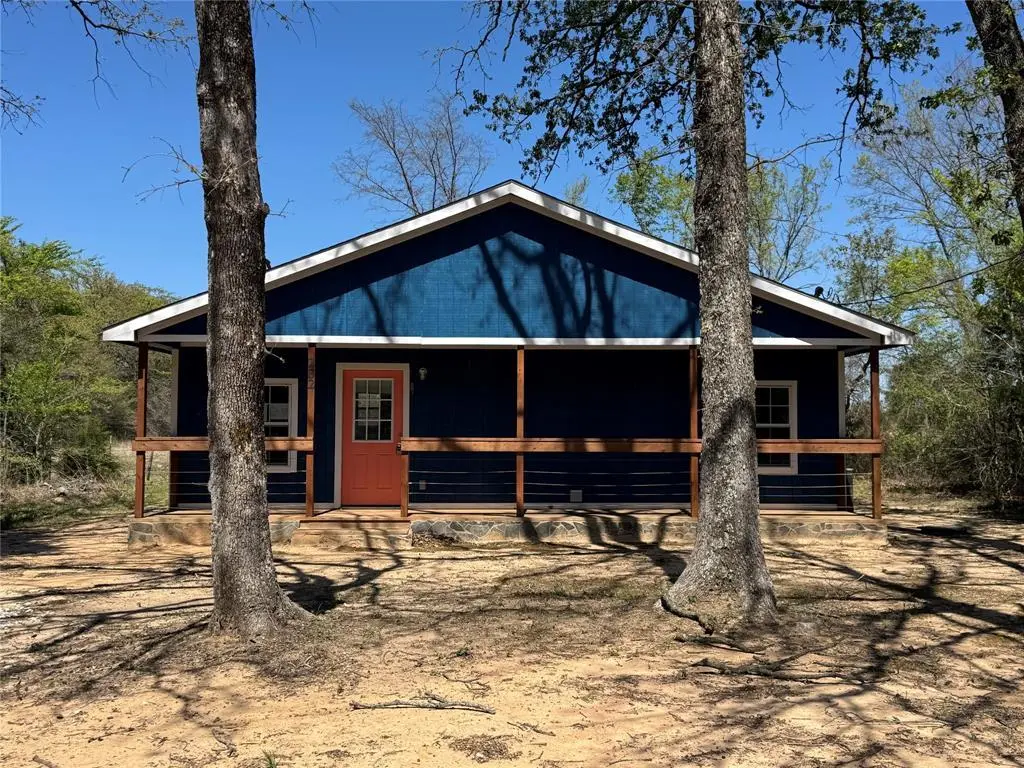
232 E Quanah Rd · Payne Springs, TX
Flood risk 1/10 · Minimal
- FEMA flood zone
- X (unshaded)
- Chance of flooding over 30 yrs
- 0.0%
- Est. flood insurance / yr
- $507 – $1,088
Fire risk 2/10 · Minimal
- Est. fire insurance / yr
- $1,222 – $2,270
Heat risk 7/10 · Major
- Hot days now (above 110°F)
- 7 days/yr
- Hot days in 30 yrs
- 26 days/yr
Wind risk 6/10 · Moderate
- Chance of severe wind over 30 yrs
- 74.0%
Air-quality risk 2/10 · Minimal
- Unhealthy air days now
- 0 days/yr
- Unhealthy air days in 30 yrs
- 1 days/yr
Risk factors via First Street. Map © Google.
Why this score? — see what drove the C+ grade
The composite is a weighted blend of 9 inputs, each scored 0–100. Each bar is that input's sub-score; the figure is the points it added to the 100-point composite (weight × sub-score).
- Cash flow +26.8/30.0
- DSCR +9.2/10.0
- 1% rule +7.5/10.0
- ARV discount +7.5/15.0
- Schools +3.2/10.0
- Livability +3.1/5.0
- Condition / age +2.5/5.0
- Rent growth +1.1/5.0
- Appreciation +0.0/10.0
$122,000
🖨 Deal sheet 📄 Offer letter ✓ Due diligence
Listing remarks
If lake life is calling your name, this Cedar Creek Lake retreat is ready to answer. Tucked away with charm and ease, this 2-bedroom, 1.5-bath home is designed for laid-back weekends and everyday escapes. Start your mornings with coffee on the front deck and wind down in the evenings on the back, both perfectly suited for soaking in the peaceful surroundings. Inside, the spacious kitchen is built for gathering—featuring sleek Samsung stainless steel appliances, including a self-cleaning air fry convection oven, dishwasher, and refrigerator with ice maker—all Wi-Fi enabled and Energy Star rated. The thoughtfully designed layout includes two bedrooms connected by a Jack-and-Jill b
Key facts
- Front deck
- Spacious kitchen
- Back deck
Tags
Property features AI
Finance
- Other: Property listed as Real Estate Owned (REO)
- Financial info: Accepted financing: Cash, Conventional, FHA, VA; No second mortgage reported
- HOA & community: Mandatory association; Annual HOA fee of $299; HOA covers full use of facilities and management fees; Community features include boat ramp and community pool
Exterior
- Parking: Driveway
- Utilities: Septic system; Asphalt street; Cable available; Not in a municipal utility district
- Home design: Single family residence; One story; Residential property; Not attached to another property
- Construction: Built in 2023; Siding exterior; Composition roof; Pillar/Post/Pier foundation
- Exterior features: Covered porch(es); Deck; No fencing
Interior
- Kitchen: Dishwasher; Electric range; Refrigerator
- Bedrooms: 2 bedrooms on the main level (including primary bedroom on main level)
- Flooring: Ceramic tile; Luxury vinyl plank
- Bathrooms: 1 full bathroom; 1 half bathroom
- Heating & cooling: Central heating; Central air conditioning
- Interior features: Open floorplan; Eat-in kitchen; One living area; One dining area; 3 total rooms
- Laundry & utility: Washer/dryer connections (utility details not specified)
Neighborhood map
What this means for you Summary
Snapshot
- This is a 2-bed/1.5-bath land listed at $122k.
Deal economics
- At list price, monthly cash flow is $335 ($4k/yr) — positive.
- The deal already cash-flows at list — no discount required.
- Meets the 1% rule at list price ($2k rent vs $122k).
- Recommended offer: $118k (3.0% below list) — sets the bar for market timing.
- Cap rate 9.6% vs local median 3.9% in Payne Springs — top-decile yield for the area; either an underpriced asset or a hidden risk that comps aren't pricing in. Stress-test before assuming the spread holds.
Location & tenants
- Location reads 61/100 on livability (#985 in TX) — a middle-class / working-renter tenant base. Strengths: crime A+, cost of living A+, housing A; Watch: amenities F, commute F, employment D-.
- Eustace ISD (rural): math 32% / reading 45% proficiency, ranked #455 of 826 in TX (top 55%) — families likely to look elsewhere, expect single-tenant / working-renter base with shorter leases; 62% free/reduced lunch — lower-income household profile, screen leases tightly.
- Zoned schools: Eustace Pri (497 students, 74% FRL).
- Market conditions: Rents falling (-5.8%/yr); 694 active listings in the ZIP; 3 comparable units currently listed for rent nearby; rentals lingering (median 44d on market — plan ~5-8 weeks vacancy on turnover, expect pricing pressure); 100% of comp listings sitting > 30 days — soft ceiling on asking rent; 263 units permitted in Henderson County in 2024 (0 in 5+ unit buildings).
- This rent runs 30% of the median local income ($61k/yr) — at the standard rent-burdened threshold; future hikes will face affordability resistance.
Forward outlook
- Local home prices are declining (-3.0%/yr); year-one equity from $843 of loan paydown is wiped out by about $4k of value loss. Plan a longer hold.
Negotiation context
- It's been on market 47 days — a 3% lower offer ($118k) is reasonable based on typical stale-listing flexibility.
Risks & watch-outs
- Climate carrying-cost: major wind risk, 74% chance of damaging wind over 30y; extreme-heat days projected 7→26/yr by 2055 (HVAC capex compounding) — expect insurance premiums to compound above CPI over the hold.
Questions for the listing agent
- It's been on market 47 days. Have you received any prior offers? Is the seller open to a 3% concession, seller financing, or rate buy-down credit?
- What does the HOA fee cover, when was the last increase, and are there any pending special assessments or reserve-fund shortfalls?
- Is there a deadline driving the sale (1031 exchange, divorce, estate, relocation)? That informs how much negotiation room exists.
- Schools are F-rated, which usually means shorter tenancies and higher turnover. Who's the typical renter profile here, and what's been the actual vacancy rate?
- What's the average days-on-market for RENTAL listings here right now (not sales)? A rising rental-DOM trend means longer vacancies and softer asking-rent achievability than the comps imply.
- What's the recent tenant-quality profile in this submarket — average credit score on applications, eviction rate, late-payment / NSF rate, and stable-employment percentage? A property-management company in the area should have these aggregated.
- How much new for-sale + rental construction is in the pipeline within 1–3 miles? Heavy new supply typically softens prices + rents 12–24 months out; constrained supply supports both.
Investment metrics
- 1% rule
- 1.25% ✓
- Cap rate
- 9.58%
- Cash-on-cash
- 11.76%
- DSCR
- 1.52
- GRM
- 6.7
CMA / ARV
- ARV (median comp)
- $17,000
- List price
- $122,000
- Delta
- 617.65%
- Verdict
- OVERPRICED
- Comps
- 11 within 1.0 mi
Projected returns pro-forma
-3.0% appreciation · 0.0% rent growth · sell at horizon
- IRR
- -2.3%
- Equity multiple
- 0.92×
- Total profit
- $-2,879
- Equity at exit
- $18,191
- IRR
- 3.7%
- Equity multiple
- 1.23×
- Total profit
- $7,850
- Equity at exit
- $10,548
Cash invested: $34,160 (down + closing). Projections, not guarantees.
Landlord ↔ Tenant lean methodology
- Overall (STATE)
- 87 Strongly Landlord-Friendly
- State Texas
- 87 Strongly Landlord-Friendly · R+5
- County
- — inherits STATE
- City
- — inherits STATE
ZIP-level market 75156
- Rents YoY
- -5.8%
- Active inventory
- 694
- Price-to-rent
- 6.7×
Monthly cashflow live
- Estimated rent
- $1,522 medium interval (Pro) →
- Mortgage (P&I)
- −$640
- Tax est. 1.5%
- −$152 /mo · $1,830/yr
- Insurance
- −$51
- HOA
- −$25
- Vacancy / Maint / Mgmt
- −$320
- Net cashflow
- $335
Break-even live
UW: 25.0% down · 7.5% · 30yr · 1.5% tax · 5.0% vac · 8.0% maint · 8.0% mgmt
Financing live
Cash to close
- Down payment
- $30,500
- Closing costs
- $3,660
- Reserves months
- —
- Total cash needed
- —
Loan-product check · same deal, 3 products live
Conventional
25% down · 7.5% · 30yr
- Down + closing
- —
- Monthly P&I
- —
- Monthly cashflow
- —
- DSCR
- —
- Eligible?
- —
Personal DTI + credit; lowest rate.
DSCR
20% down · 8.5% · 30yr
- Down + closing
- —
- Monthly P&I
- —
- Monthly cashflow
- —
- DSCR
- —
- Eligible?
- —
No personal income docs; deal must DSCR.
Hard money
10% down · 12.0% · 12mo
- Down + closing
- —
- Monthly P&I
- —
- Monthly cashflow
- —
- DSCR
- —
- Eligible?
- —
Short-term bridge; refi at stabilization.
Rent comps 3 comps
| Address | Beds | Baths | Sqft | Rent | $/sqft | DOM | Units | Dist |
|---|---|---|---|---|---|---|---|---|
| 110 Bowie St Mabank, TX | 3.0 | 2.0 | 1200 | $1,550 | $1.29 | 43d | 1 | 0.13mi |
| 120 Trails End St Mabank, TX | 2.0 | 2.0 | 1176 | $1,895 | $1.61 | 43d | 1 | 1.28mi |
| 102 Lynn Creek Dr Mabank, TX | 3.0 | 1.0 | 1400 | $995 | $0.71 | 43d | 1 | 1.33mi |
HOA detail
- Monthly dues
- $25 · $300/yr
- Likely covers
- internet
Listing history 18 events
-
2026-06-19days on market $122,000 Active 47 DOM
-
2026-06-18days on market $122,000 Active 46 DOM
-
2026-06-17days on market $122,000 Active 45 DOM
-
2026-06-16days on market $122,000 Active 44 DOM
-
2026-06-15days on market $122,000 Active 43 DOM
-
2026-06-14days on market $122,000 Active 41 DOM
-
2026-06-12days on market $122,000 Active 40 DOM
-
2026-06-09days on market $122,000 Active 37 DOM
-
2026-06-08days on market $122,000 Active 36 DOM
-
2026-06-07days on market $122,000 Active 35 DOM
-
2026-06-05pricedays on market $122,000 Active 32 DOM
-
2026-06-02days on market $132,000 Active 30 DOM
-
2026-06-01days on market $132,000 Active 29 DOM
-
2026-05-31days on market $132,000 Active 28 DOM
-
2026-05-30days on market $132,000 Active 27 DOM
-
2026-05-03$132,000 Active 1078-char remark
-
2026-01-28soldstatus
-
1995-05-16soldstatus
ⓘ Source: listings_history table (triggers on properties + properties_extension) + one-shot
backfill from property_details.listing_events for pre-trigger history.
Climate risk First Street
- Flood 1/10 Low FEMA zone X (unshaded) · 0% chance over 30 yrs
- Wildfire 2/10 Low
- Heat 7/10 Severe 7 d/yr ≥110°F today · 26 d/yr by 30 yrs out
- Wind 6/10 Major 74% chance of damaging wind over 30 yrs
- Air quality 2/10 Low 0 unhealthy d/yr today · 1 by 30 yrs out
Nearby sold comps map
Loading sold comps map…
Walkable amenities ~0.75 mi
Loading nearby amenities…
Taxation est. · year 1
- Rental income
- $18,270
- − Mortgage interest
- −$6,834
- − Property taxes
- −$1,830
- − Insurance
- −$610
- − Repairs & maintenance
- −$1,462
- − Management
- −$1,462
- − HOA
- −$300
- − Depreciation
- −$3,549
- Taxable income
- $2,224
- Est. tax owed @ 24.0%
- −$534
- After-tax cash flow
- $3,482/yr
For passive investors: Depreciation is non-cash, so a rental often shows a tax loss while cash-flowing — sheltering income. Rental losses are passive: they offset passive income freely, and up to $25,000/yr can offset ordinary (W-2) income if you actively participate and your MAGI is under $100k (phasing out to $0 by $150k); unused losses carry forward. On sale, claimed depreciation is recaptured at up to 25%, and gains may owe capital-gains tax (a 1031 exchange can defer both). Figures are a year-1 estimate at your 24.0% rate — not tax advice; consult a CPA.
Schools (NCES district)
- District
- Eustace ISD
- NCES district ID
- 4818720
- Math proficiency
- 32% ▼ -18.00%
- Reading proficiency
- 45% ▼ -7.00%
- Median HH income
- $42,425
- Composite
- 32.48/100
- National rank
- #5711
- State rank
- #455 of 826 in TX
Livability — Payne Springs
- Score
- 61/100
- State rank
- #985
- US rank
- #17539
Category grades
Schools grade is shown separately in the Schools card above.
Census & demographics
- County
- Henderson County · 34,977 people
- City population
- 16,333
- Metro
- Athens, TX
- Population (ZIP)
- 16,333
- Household income
- $60,867
- Rent vs Own
- Severe rent burden
- 400.0
Population outlook (Henderson County) Hauer SSP2
- Today (2025)
- 80,471 people
- By 2030
- 80,608 · +0.2%
- By 2040
- 80,087 · -0.5%
- By 2050
- 78,208 · -2.8%
- By 2075
- 72,423 · -10.0%
- By 2100
- 61,012 · -24.2%
Race, ethnicity, and origin ACS 2023
- Neighborhood character
- Predominantly White (85%)
- Race & ethnicity
- White 85% Hispanic / Latino 7% Two or more races 7% Black 1%
- Hispanic origin (detail)
- Mexican 5%
- Common ancestry
- Slovak 3% Serbian 2% European 2%
- Foreign-born
- 4% · Canada, Jamaica
- Languages at home
- 94% English-only · Spanish 4% Other Indo-European 1%
Political lean MEDSL · Henderson
- 2024 margin
- Solid R (+63.5) · D 18.0% · R 81.4%
- 2008→2024 swing
- -18.8pp toward R · 2008: -44.6pp · 2024: -63.5pp
- All cycles
- 2024: R+63.5 2020: R+60.2 2016: R+60.0 2012: R+54.8 2008: R+44.6
Not yet ingested
- Civics
- —
Market trends
- HPI YoY
- ▼ -216.77%
- Current HPI
- 199.8108
- Rent YoY
- ▼ -5.76%
- Metro
- Athens, TX
- State GDP YoY
- ▲ 3.95%
- F500 in state
- 110
Industry mix (Fortune 500 HQ in TX)
| Industry | F500 HQs | Revenue |
|---|---|---|
| Energy | 16 | $1,198B |
|
||
| Technology | 5 | $198B |
|
||
| Engineering / Construction | 4 | $72B |
|
||
| Energy Services | 3 | $60B |
|
||
| Utilities | 3 | $41B |
|
||
| Healthcare | 2 | $330B |
|
||
Price history
-7.6% since first listed4 events — show timeline
- 2026-06-05 Price Changed $122,000 NTREIS
- 2026-05-03 Listed $132,000 NTREIS
- 2026-01-28 Sold (Public Records) — Public Records
- 1995-05-16 Sold (Public Records) — Public Records
Property tax history
+6.1%/yrLatest (2025): $59 · +18.7% YoY. Source: county tax records.
Cash-flow waterfall
monthlySold comps — $/sqft
last 12 mo · ≤1 miLoading sold comps…