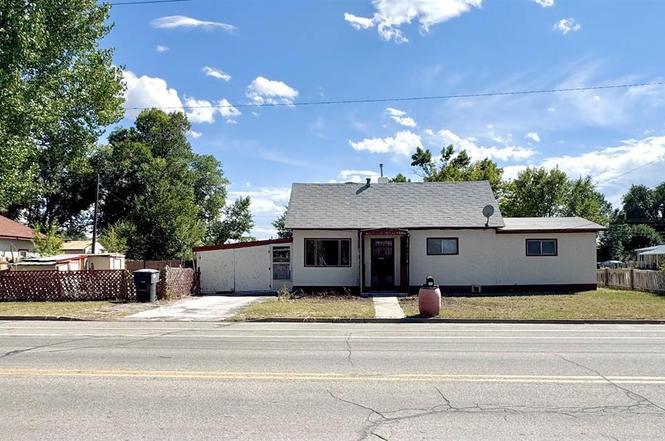
1002 Edison Ave · Alamosa, CO
Flood risk 1/10 · Minimal
- FEMA flood zone
- X (shaded)
- Chance of flooding over 30 yrs
- 0.0%
- Est. flood insurance / yr
- $507 – $1,088
Fire risk 4/10 · Minor
- Est. fire insurance / yr
- $939 – $1,743
Heat risk 1/10 · Minimal
- Hot days now (above 85°F)
- 7 days/yr
- Hot days in 30 yrs
- 20 days/yr
Wind risk 1/10 · Minimal
- Chance of severe wind over 30 yrs
- —
Air-quality risk 1/10 · Minimal
- Unhealthy air days now
- 0 days/yr
- Unhealthy air days in 30 yrs
- 0 days/yr
Risk factors via First Street. Map © Google.
Why this score? — see what drove the B- grade
The composite is a weighted blend of 9 inputs, each scored 0–100. Each bar is that input's sub-score; the figure is the points it added to the 100-point composite (weight × sub-score).
- Cash flow +25.7/30.0
- ARV discount +15.0/15.0
- DSCR +8.6/10.0
- 1% rule +5.5/10.0
- Livability +3.6/5.0
- Rent growth +2.5/5.0
- Condition / age +2.5/5.0
- Schools +2.4/10.0
- Appreciation +0.0/10.0
$130,000
🖨 Deal sheet 📄 Offer letter ✓ Due diligence
Key facts
- 4,791 sq ft lot
- 2 parking spots
- Built 1901
Property features AI
Exterior
- Parking: Carport with space for 2 vehicles
- Utilities: Public water; Public sewer; Electricity available; Natural gas available; High-speed internet available; Cellular phone reception
- Home design: Single-story; Residential single-family
- Construction: Stucco and stick-built construction
- Exterior features: Partial fencing; Shed(s)
Interior
- Kitchen: Oven; Range; Refrigerator
- Bathrooms: 1 full bathroom; 1 half bathroom
- Interior features: Unfurnished
Neighborhood map
What this means for you Summary
Snapshot
- This is a 2-bed/1.0-bath single-family listed at $130k.
Deal economics
- At list price, monthly cash flow is $310 ($4k/yr) — positive.
- The deal already cash-flows at list — no discount required.
- Meets the 1% rule at list price ($1k rent vs $130k).
- Recommended offer: $114k (12.0% below list) — sets the bar for market timing.
- Cap rate 9.2% vs local median 3.6% in Alamosa — top-decile yield for the area; either an underpriced asset or a hidden risk that comps aren't pricing in. Stress-test before assuming the spread holds.
Location & tenants
- Location reads 71/100 on livability (#79 in CO) — a middle-class / working-renter tenant base. Strengths: amenities A+, cost of living A+, health & safety A+; Watch: schools F, crime F, employment F.
- Alamosa School District No. Re-11J (town): math 23% / reading 36% proficiency, ranked #59 of 86 in CO (top 69%) — low school quality limits family demand, transient renter base, plan for 1-2y turnover; 61% free/reduced lunch — lower-income household profile, screen leases tightly.
- Market conditions: 188 active listings in the ZIP; 12 comparable units currently listed for rent nearby; rentals at typical pace (median 14d on market — plan ~3-4 weeks tenant-placement turnaround); 51 units permitted in Alamosa County in 2024 (0 in 5+ unit buildings).
Forward outlook
- Local home prices are declining (-3.0%/yr); year-one equity from $899 of loan paydown is wiped out by about $4k of value loss. Plan a longer hold.
- Alamosa County population projected at +21% by 2050 — long-run rental-demand tailwind backs the buy-and-hold thesis.
Negotiation context
- It's been on market 271 days — a 12% lower offer ($114k) is reasonable based on typical stale-listing flexibility.
Risks & watch-outs
- Watch-outs: built in 1901 — expect roof / HVAC / electrical / plumbing capex.
Questions for the listing agent
- It's been on market 271 days. Have you received any prior offers? Is the seller open to a 12% concession, seller financing, or rate buy-down credit?
- Built in 1901 — when were the roof, HVAC, electrical panel, plumbing, and water heater last replaced?
- Why hasn't it sold? Are there any deal-killer items the seller is aware of (foundation, flood, title, zoning, code violations)?
- Is there a deadline driving the sale (1031 exchange, divorce, estate, relocation)? That informs how much negotiation room exists.
- Schools are F-rated, which usually means shorter tenancies and higher turnover. Who's the typical renter profile here, and what's been the actual vacancy rate?
- Crime grade is F in this area — have there been break-ins, vandalism, or insurance claims at this property in the last 3 years? What carrier currently insures it and at what premium?
- What's the average days-on-market for RENTAL listings here right now (not sales)? A rising rental-DOM trend means longer vacancies and softer asking-rent achievability than the comps imply.
- What's the recent tenant-quality profile in this submarket — average credit score on applications, eviction rate, late-payment / NSF rate, and stable-employment percentage? A property-management company in the area should have these aggregated.
- How much new for-sale + rental construction is in the pipeline within 1–3 miles? Heavy new supply typically softens prices + rents 12–24 months out; constrained supply supports both.
Investment metrics
- 1% rule
- 1.05% ✓
- Cap rate
- 9.16%
- Cash-on-cash
- 10.24%
- DSCR
- 1.46
- GRM
- 7.9
CMA / ARV
- ARV (on-the-fly)
- $225,428
- Comps found
- 12
Show comp detail 12 sales within ~0.75 mi
| Address | Dist | Beds/Ba | Sqft | Sold | Price | $/sf | Match |
|---|---|---|---|---|---|---|---|
| 1002 Edison Ave | 0.00mi | 3/1.5 (+1) | 1,162 (0%) | 0mo | $95,000 | $82 | 93 |
| 913 Hunt Ave | 0.25mi | 2/1.0 | 1,064 (-8%) | 2mo | $194,000 | $182 | 73 |
| 1306 State Ave | 0.30mi | 2/1.0 | 1,066 (-8%) | 6mo | $207,000 | $194 | 67 |
| 1121 San Juan Ave | 0.13mi | 3/1.0 (+1) | 1,012 (-13%) | 7mo | $115,000 | $114 | 62 |
| 1114 La Due Ave | 0.47mi | 3/1.0 (+1) | 1,201 (+3%) | 12mo | $200,000 | $167 | 57 |
| 422 Seventh St | 0.37mi | 2/1.0 | 1,046 (-10%) | 13mo | $117,500 | $112 | 56 |
| 206 Bell Ave | 0.64mi | 3/1.0 (+1) | 1,074 (-8%) | 2mo | $221,000 | $206 | 51 |
| 1704 Ross Ave | 0.53mi | 2/1.0 | 1,009 (-13%) | 5mo | $130,000 | $129 | 49 |
| 1731 San Juan Ave | 0.59mi | 3/2.0 (+1) | 1,260 (+8%) | 5mo | $289,000 | $229 | 45 |
| 123 Twelfth St | 0.58mi | 3/1.0 (+1) | 1,014 (-13%) | 3mo | $220,000 | $217 | 45 |
| 1218 Second St | 0.74mi | 3/2.0 (+1) | 1,235 (+6%) | 4mo | $259,000 | $210 | 43 |
| 1821 San Juan Ave | 0.64mi | 3/2.0 (+1) | 1,232 (+6%) | 12mo | $280,000 | $227 | 41 |
Match score weights: distance 35% · size 25% · config 20% · recency 20%. Top-matched comps best support the ARV.
Projected returns pro-forma
-3.0% appreciation · 3.0% rent growth · sell at horizon
- IRR
- -1.0%
- Equity multiple
- 0.96×
- Total profit
- $-1,347
- Equity at exit
- $19,383
- IRR
- 8.7%
- Equity multiple
- 1.66×
- Total profit
- $24,059
- Equity at exit
- $11,240
Cash invested: $36,400 (down + closing). Projections, not guarantees.
Landlord ↔ Tenant lean methodology
- Overall (STATE)
- 38 Tenant-Leaning
- State Colorado
- 38 Tenant-Leaning · D+4
- County
- — inherits STATE
- City
- — inherits STATE
ZIP-level market 81101
- Home prices YoY
- -23.8%
- Active inventory
- 188
- Price-to-rent
- 7.9×
Monthly cashflow live
- Estimated rent
- $1,370 high interval (Pro) →
- Mortgage (P&I)
- −$682
- Tax from tax record
- −$36 /mo · $428/yr
- Insurance
- −$54
- HOA
- −$0
- Vacancy / Maint / Mgmt
- −$288
- Net cashflow
- $310
Break-even live
UW: 25.0% down · 7.5% · 30yr · 1.5% tax · 5.0% vac · 8.0% maint · 8.0% mgmt
Financing live
Cash to close
- Down payment
- $32,500
- Closing costs
- $3,900
- Reserves months
- —
- Total cash needed
- —
Loan-product check · same deal, 3 products live
Conventional
25% down · 7.5% · 30yr
- Down + closing
- —
- Monthly P&I
- —
- Monthly cashflow
- —
- DSCR
- —
- Eligible?
- —
Personal DTI + credit; lowest rate.
DSCR
20% down · 8.5% · 30yr
- Down + closing
- —
- Monthly P&I
- —
- Monthly cashflow
- —
- DSCR
- —
- Eligible?
- —
No personal income docs; deal must DSCR.
Hard money
10% down · 12.0% · 12mo
- Down + closing
- —
- Monthly P&I
- —
- Monthly cashflow
- —
- DSCR
- —
- Eligible?
- —
Short-term bridge; refi at stabilization.
Rent comps 12 comps
| Address | Beds | Baths | Sqft | Rent | $/sqft | DOM | Units | Dist |
|---|---|---|---|---|---|---|---|---|
| 908 9th St Unit 908 Alamosa, CO | 1.0 | 1.0 | 755 | $1,000 | $1.32 | 2d | 1 | 0.12mi |
| 1777 Edison Ave Apt 1 Alamosa, CO | 3.0 | 1.0 | 1115 | $1,425 | $1.28 | 2d | 1 | 0.57mi |
| 729 3rd St Alamosa, CO | 2.0 | 1.0 | 722 | $1,250 | $1.73 | 14d | 1 | 0.60mi |
| 122 10th St Alamosa, CO | 2.0 | 1.0 | 946 | $1,200 | $1.27 | 2d | 1 | 0.60mi |
| 511 Crestone Ave Unit 511 Alamosa, CO | 3.0 | 1.0 | 1205 | $1,700 | $1.41 | 14d | 1 | 0.86mi |
| 507 Crestone Ave Alamosa, CO | 3.0 | 1.0 | 1205 | $1,650 | $1.37 | 23d | 1 | 0.87mi |
| 525 Washington Ave Alamosa, CO | 3.0 | 2.0 | 1275 | $1,950 | $1.53 | 2d | 1 | 0.90mi |
| 517 Washington Ave Alamosa, CO | 3.0 | 2.0 | 1275 | $1,800 | $1.41 | 23d | 1 | 0.90mi |
| 511 Washington Ave Alamosa, CO | 3.0 | 2.0 | 1275 | $1,850 | $1.45 | 23d | 1 | 0.91mi |
| 509 Washington Ave Alamosa, CO | 3.0 | 2.0 | 1275 | $1,850 | $1.45 | 23d | 1 | 0.91mi |
| 512 Bell Ct Unit B7 Alamosa, CO | 2.0 | 1.0 | 980 | $1,150 | $1.17 | 2d | 1 | 1.47mi |
| 2614 First St Alamosa, CO | 2.0 | 1.0 | 800 | $950 | $1.19 | 2d | 1 | 1.49mi |
Listing history 9 events
-
2026-06-03days on market $130,000 Active 271 DOM
-
2026-06-02days on market $130,000 Active 270 DOM
-
2026-06-01days on market $130,000 Active 269 DOM
-
2026-05-31days on market $130,000 Active 268 DOM
-
2026-05-31days on market $130,000 Active 267 DOM
-
2026-02-26price $130,000
-
2025-10-23price $144,000
-
2025-09-23price $162,000
-
2025-09-05$172,000 Active
ⓘ Source: listings_history table (triggers on properties + properties_extension) + one-shot
backfill from property_details.listing_events for pre-trigger history.
Tax reassessment forecast CO · Resets to sale price
- Current annual tax
- $428 · $36/mo
- Projected year-2 tax
- $715 · $60/mo
- Expected delta
- +$287/yr (+$24/mo · 67.1%)
ⓘ Screening estimate from a state-policy table — verify with the county assessor before closing.
Climate risk First Street
- Flood 1/10 Low FEMA zone X (shaded) · 0% chance over 30 yrs
- Wildfire 4/10 Moderate
- Heat 1/10 Low 7 d/yr ≥85°F today · 20 d/yr by 30 yrs out
- Wind 1/10 Low
- Air quality 1/10 Low 0 unhealthy d/yr today · 0 by 30 yrs out
Nearby sold comps map
Loading sold comps map…
Walkable amenities ~0.75 mi
Loading nearby amenities…
Taxation est. · year 1
- Rental income
- $16,436
- − Mortgage interest
- −$7,282
- − Property taxes
- −$428
- − Insurance
- −$650
- − Repairs & maintenance
- −$1,315
- − Management
- −$1,315
- − Depreciation
- −$3,782
- Taxable income
- $1,665
- Est. tax owed @ 24.0%
- −$400
- After-tax cash flow
- $3,326/yr
For passive investors: Depreciation is non-cash, so a rental often shows a tax loss while cash-flowing — sheltering income. Rental losses are passive: they offset passive income freely, and up to $25,000/yr can offset ordinary (W-2) income if you actively participate and your MAGI is under $100k (phasing out to $0 by $150k); unused losses carry forward. On sale, claimed depreciation is recaptured at up to 25%, and gains may owe capital-gains tax (a 1031 exchange can defer both). Figures are a year-1 estimate at your 24.0% rate — not tax advice; consult a CPA.
Schools (NCES district)
- District
- Alamosa School District No. Re-11J
- NCES district ID
- 0802070
- Math proficiency
- 23% ▼ -1.00%
- Reading proficiency
- 36% ▬ 0.00%
- Median HH income
- $34,857
- Composite
- 24.29/100
- National rank
- #7713
- State rank
- #59 of 86 in CO
Livability — Alamosa
- Score
- 71/100
- State rank
- #79
- US rank
- #7230
Category grades
Schools grade is shown separately in the Schools card above.
Census & demographics
- Census place
- Alamosa, CO
- County
- Alamosa County · 15,550 people
- City population
- 15,550
- Metro
- nan
- Population (ZIP)
- 15,550
- Household income
- $54,844
- Rent vs Own
- Severe rent burden
- 511.0
Population outlook (Alamosa County) Hauer SSP2
- Today (2025)
- 17,715 people
- By 2030
- 18,383 · +3.8%
- By 2040
- 19,792 · +11.7%
- By 2050
- 21,412 · +20.9%
- By 2075
- 26,342 · +48.7%
- By 2100
- 28,866 · +62.9%
Race, ethnicity, and origin ACS 2023
- Neighborhood character
- Diverse neighborhood (Simpson 0.56)
- Race & ethnicity
- Hispanic / Latino 50% White 44% Two or more races 24% Native American 5% Black 2%
- Hispanic origin (detail)
- Mexican 33%
- Common ancestry
- Italian 4% Russian 2% Lithuanian 1%
- Foreign-born
- 5% · Canada
- Languages at home
- 78% English-only · Spanish 21%
Political lean MEDSL · Alamosa
- 2024 margin
- R (+10.8) · D 43.1% · R 54.0% · Other 2.9%
- 2008→2024 swing
- -24.9pp toward R · 2008: 14.1pp · 2024: -10.8pp
- All cycles
- 2024: R+10.8 2020: R+0.7 2016: D+2.0 2012: D+16.3 2008: D+14.1
Not yet ingested
- Civics
- —
Market trends
- HPI YoY
- ▼ -88.63%
- Current HPI
- 284.5384
- Rent YoY
- —
- Metro
- nan
- State GDP YoY
- ▲ 1.95%
- F500 in state
- 14
Industry mix (Fortune 500 HQ in CO)
| Industry | F500 HQs | Revenue |
|---|---|---|
| Technology Distribution | 1 | $31B |
|
||
| Food / Agriculture | 1 | $18B |
|
||
| Packaging | 1 | $14B |
|
||
| Healthcare | 1 | $13B |
|
||
| Energy | 1 | $10B |
|
||
| Technology | 1 | $4B |
|
||
Price history
-24.4% since first listed4 events — show timeline
- 2026-02-26 Price Changed $130,000 cren
- 2025-10-23 Price Changed $144,000 cren
- 2025-09-23 Price Changed $162,000 cren
- 2025-09-05 Listed $172,000 cren
Property tax history
+3.2%/yrLatest (2025): $428 · -7.4% YoY. Source: county tax records.
Cash-flow waterfall
monthlySold comps — $/sqft
last 12 mo · ≤1 miLoading sold comps…