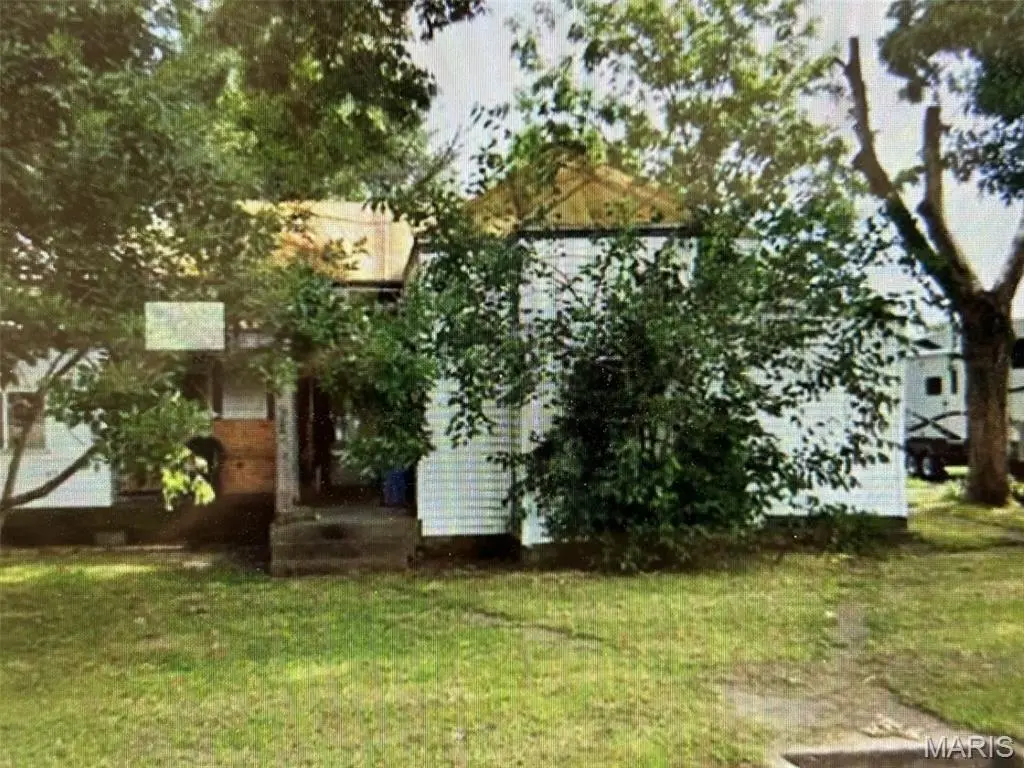
209 S Spring St · Perryville, MO
Flood risk 1/10 · Minimal
- FEMA flood zone
- X (unshaded)
- Chance of flooding over 30 yrs
- 0.0%
- Est. flood insurance / yr
- $473 – $860
Fire risk 1/10 · Minimal
- Est. fire insurance / yr
- $1,054 – $1,958
Heat risk 5/10 · Moderate
- Hot days now (above 106°F)
- 7 days/yr
- Hot days in 30 yrs
- 21 days/yr
Wind risk 2/10 · Minimal
- Chance of severe wind over 30 yrs
- 2.0%
Air-quality risk 2/10 · Minimal
- Unhealthy air days now
- 1 days/yr
- Unhealthy air days in 30 yrs
- 1 days/yr
Risk factors via First Street. Map © Google.
Why this score? — see what drove the B- grade
The composite is a weighted blend of 9 inputs, each scored 0–100. Each bar is that input's sub-score; the figure is the points it added to the 100-point composite (weight × sub-score).
- Cash flow +30.0/30.0
- 1% rule +10.0/10.0
- DSCR +10.0/10.0
- ARV discount +7.5/15.0
- Livability +3.4/5.0
- Schools +3.1/10.0
- Rent growth +2.5/5.0
- Condition / age +2.5/5.0
- Appreciation +0.0/10.0
$30,000
🖨 Deal sheet 📄 Offer letter ✓ Due diligence
Listing remarks MLS
This is one for tried and true investors! Lots of square footage to work with here!
Key facts
- 8,319 sq ft lot
- Built 1920
- Listed 28 days
Property features AI
Exterior
- Utilities: Public water; Public sewer; Electric service available; Cable available
- Home design: Single-family residence; One level
- Construction: Construction materials: Unknown
- Exterior features: Back yard
Interior
- Bedrooms: 2 bedrooms on the main level
- Bathrooms: 1 full bathroom on the main level
- Heating & cooling: Other heating; No central cooling
- Interior features: Fireplace (1); Has basement
Neighborhood map
What this means for you Summary
Snapshot
- This is a 2-bed/1.0-bath other listed at $30k.
Deal economics
- At list price, monthly cash flow is $664 ($8k/yr) — positive.
- The deal already cash-flows at list — no discount required.
- Meets the 1% rule at list price ($1k rent vs $30k).
- Recommended offer: $30k (1.5% below list) — sets the bar for market timing.
- Cap rate 32.9% vs local median 2.9% in Perryville — top-decile yield for the area; either an underpriced asset or a hidden risk that comps aren't pricing in. Stress-test before assuming the spread holds.
Location & tenants
- Location reads 68/100 on livability (#178 in MO) — a middle-class / working-renter tenant base. Strengths: cost of living A+, housing A+, crime B; Watch: health & safety C-, amenities F, commute F.
- Perry County 32 (town): math 31% / reading 42% proficiency, ranked #189 of 324 in MO (top 58%) — families likely to look elsewhere, expect single-tenant / working-renter base with shorter leases.
- Zoned schools: Perryville Elem. (math 32% / reading 37%, grade F, #676 of 1,115 statewide, top 66%, 423 students, 59% FRL); Perryville Sr. High (math 40% / reading 52%, grade D-, #170 of 521 statewide, top 33%, 755 students, 39% FRL).
- Market conditions: 88 active listings in the ZIP; 36 units permitted in Perry County in 2024 (0 in 5+ unit buildings).
Forward outlook
- Local home prices are declining (-3.0%/yr); year-one equity from $207 of loan paydown is wiped out by about $900 of value loss. Plan a longer hold.
- At projected returns (-3.0% appreciation + 3.0% rent growth), your $8k cash investment doubles in ~2 years — after that, you're playing with house money.
Negotiation context
- It's been on market 29 days — a 2% lower offer ($30k) is reasonable based on typical stale-listing flexibility.
- 2 sale attempts since 3y ago; this cycle's ask has dropped $9k (23%) from the opening price — seller is motivated, your offer sets the floor, not the list.
Risks & watch-outs
- Watch-outs: built in 1920 — expect roof / HVAC / electrical / plumbing capex.
- Climate carrying-cost: extreme-heat days projected 7→21/yr by 2055 (HVAC capex compounding) — expect insurance premiums to compound above CPI over the hold.
Questions for the listing agent
- Built in 1920 — when were the roof, HVAC, electrical panel, plumbing, and water heater last replaced?
- Is there a deadline driving the sale (1031 exchange, divorce, estate, relocation)? That informs how much negotiation room exists.
- Schools are D-rated, which usually means shorter tenancies and higher turnover. Who's the typical renter profile here, and what's been the actual vacancy rate?
- What's the average days-on-market for RENTAL listings here right now (not sales)? A rising rental-DOM trend means longer vacancies and softer asking-rent achievability than the comps imply.
- What's the recent tenant-quality profile in this submarket — average credit score on applications, eviction rate, late-payment / NSF rate, and stable-employment percentage? A property-management company in the area should have these aggregated.
- How much new for-sale + rental construction is in the pipeline within 1–3 miles? Heavy new supply typically softens prices + rents 12–24 months out; constrained supply supports both.
Investment metrics
- 1% rule
- 3.67% ✓
- Cap rate
- 32.86%
- Cash-on-cash
- 94.89%
- DSCR
- 5.22
- GRM
- 2.3
CMA / ARV
No comps found within radius.
Projected returns pro-forma
-3.0% appreciation · 3.0% rent growth · sell at horizon
- IRR
- 95.8%
- Equity multiple
- 5.46×
- Total profit
- $37,459
- Equity at exit
- $4,473
- IRR
- 98.5%
- Equity multiple
- 11.38×
- Total profit
- $87,154
- Equity at exit
- $2,594
Cash invested: $8,400 (down + closing). Projections, not guarantees.
Landlord ↔ Tenant lean methodology
- Overall (STATE)
- 81 Strongly Landlord-Friendly
- State Missouri
- 81 Strongly Landlord-Friendly · R+10
- County
- — inherits STATE
- City
- — inherits STATE
ZIP-level market 63775
- Home prices YoY
- -18.9%
- Active inventory
- 88
- Price-to-rent
- 2.3×
Monthly cashflow live
- Estimated rent
- $1,100 medium interval (Pro) →
- Mortgage (P&I)
- −$157
- Tax from tax record
- −$35 /mo · $422/yr
- Insurance
- −$12
- HOA
- −$0
- Vacancy / Maint / Mgmt
- −$231
- Net cashflow
- $664
Break-even live
UW: 25.0% down · 7.5% · 30yr · 1.5% tax · 5.0% vac · 8.0% maint · 8.0% mgmt
Financing live
Cash to close
- Down payment
- $7,500
- Closing costs
- $900
- Reserves months
- —
- Total cash needed
- —
Loan-product check · same deal, 3 products live
Conventional
25% down · 7.5% · 30yr
- Down + closing
- —
- Monthly P&I
- —
- Monthly cashflow
- —
- DSCR
- —
- Eligible?
- —
Personal DTI + credit; lowest rate.
DSCR
20% down · 8.5% · 30yr
- Down + closing
- —
- Monthly P&I
- —
- Monthly cashflow
- —
- DSCR
- —
- Eligible?
- —
No personal income docs; deal must DSCR.
Hard money
10% down · 12.0% · 12mo
- Down + closing
- —
- Monthly P&I
- —
- Monthly cashflow
- —
- DSCR
- —
- Eligible?
- —
Short-term bridge; refi at stabilization.
Listing history 22 events
-
2026-06-18days on market $30,000 Active 29 DOM
-
2026-06-17pricedays on market $30,000 Active 28 DOM
-
2026-06-16days on market $33,500 Active 27 DOM
-
2026-06-15days on market $33,500 Active 26 DOM
-
2026-06-13days on market $33,500 Active 24 DOM
-
2026-06-12days on market $33,500 Active 23 DOM
-
2026-06-09days on market $33,500 Active 20 DOM
-
2026-06-08days on market $33,500 Active 19 DOM
-
2026-06-07pricedays on market $33,500 Active 18 DOM
-
2026-06-04days on market $38,750 Active 14 DOM
-
2026-06-02days on market $38,750 Active 13 DOM
-
2026-06-01days on market $38,750 Active 12 DOM
-
2026-05-31days on market $38,750 Active 11 DOM
-
2026-05-20$38,750 Active
-
2026-05-19historical $38,750
-
2024-08-23soldstatus
-
2024-08-19soldstatus Closed 83-char remark
Show marketing remark (83 chars)
This is one for tried and true investors! Lots of square footage to work with here!
-
2024-03-25status Pending 83-char remark
Show marketing remark (83 chars)
This is one for tried and true investors! Lots of square footage to work with here!
-
2024-03-07price $25,900 83-char remark
Show marketing remark (83 chars)
This is one for tried and true investors! Lots of square footage to work with here!
-
2024-01-17price $28,900 83-char remark
Show marketing remark (83 chars)
This is one for tried and true investors! Lots of square footage to work with here!
-
2023-12-21price $49,900 83-char remark
Show marketing remark (83 chars)
This is one for tried and true investors! Lots of square footage to work with here!
-
2023-12-13$54,900 Active 83-char remark
Show marketing remark (83 chars)
This is one for tried and true investors! Lots of square footage to work with here!
ⓘ Source: listings_history table (triggers on properties + properties_extension) + one-shot
backfill from property_details.listing_events for pre-trigger history.
Tax reassessment forecast MO · Resets to sale price
- Current annual tax
- $422 · $35/mo
- Projected year-2 tax
- $422 · $35/mo
- Expected delta
- $0/yr ($0/mo · 0.0%)
ⓘ Screening estimate from a state-policy table — verify with the county assessor before closing.
Climate risk First Street
- Flood 1/10 Low FEMA zone X (unshaded) · 0% chance over 30 yrs
- Wildfire 1/10 Low
- Heat 5/10 Major 7 d/yr ≥106°F today · 21 d/yr by 30 yrs out
- Wind 2/10 Low 2% chance of damaging wind over 30 yrs
- Air quality 2/10 Low 1 unhealthy d/yr today · 1 by 30 yrs out
Nearby sold comps map
Loading sold comps map…
Walkable amenities ~0.75 mi
Loading nearby amenities…
Taxation est. · year 1
- Rental income
- $13,204
- − Mortgage interest
- −$1,680
- − Property taxes
- −$422
- − Insurance
- −$150
- − Repairs & maintenance
- −$1,056
- − Management
- −$1,056
- − Depreciation
- −$873
- Taxable income
- $7,966
- Est. tax owed @ 24.0%
- −$1,912
- After-tax cash flow
- $6,059/yr
For passive investors: Depreciation is non-cash, so a rental often shows a tax loss while cash-flowing — sheltering income. Rental losses are passive: they offset passive income freely, and up to $25,000/yr can offset ordinary (W-2) income if you actively participate and your MAGI is under $100k (phasing out to $0 by $150k); unused losses carry forward. On sale, claimed depreciation is recaptured at up to 25%, and gains may owe capital-gains tax (a 1031 exchange can defer both). Figures are a year-1 estimate at your 24.0% rate — not tax advice; consult a CPA.
Schools (NCES district)
- District
- Perry County 32
- NCES district ID
- 2924530
- Math proficiency
- 31% ▼ -11.00%
- Reading proficiency
- 42% ▬ 0.00%
- Median HH income
- $48,272
- Composite
- 31.39/100
- National rank
- #5992
- State rank
- #189 of 324 in MO
Livability — Perryville
- Score
- 68/100
- State rank
- #178
- US rank
- #9349
Category grades
Schools grade is shown separately in the Schools card above.
Census & demographics
- Census place
- Perryville, MO
- City population
- 15,993
- Population (ZIP)
- 15,993
Population outlook (Perry County) Hauer SSP2
- Today (2025)
- 19,583 people
- By 2030
- 19,714 · +0.7%
- By 2040
- 19,695 · +0.6%
- By 2050
- 19,172 · -2.1%
- By 2075
- 17,199 · -12.2%
- By 2100
- 13,661 · -30.2%
Race, ethnicity, and origin ACS 2023
- Neighborhood character
- Predominantly White (93%)
- Race & ethnicity
- White 93% Two or more races 3% Hispanic / Latino 3%
- Common ancestry
- Lithuanian 6% Romanian 1% Slovak 1%
- Foreign-born
- 2% · Canada
- Languages at home
- 96% English-only · Spanish 2% Other Asian/Pacific 1% German/W. Germanic 1%
Political lean MEDSL · Perry
- 2024 margin
- Solid R (+63.4) · D 17.9% · R 81.3%
- 2008→2024 swing
- -34.2pp toward R · 2008: -29.2pp · 2024: -63.4pp
- All cycles
- 2024: R+63.4 2020: R+63.4 2016: R+61.7 2012: R+43.6 2008: R+29.2
Not yet ingested
- Civics
- —
Market trends
- HPI YoY
- ▼ -51.70%
- Current HPI
- 222.3729
- Rent YoY
- —
- Metro
- —
- State GDP YoY
- ▲ 1.84%
- F500 in state
- 20
Industry mix (Fortune 500 HQ in MO)
| Industry | F500 HQs | Revenue |
|---|---|---|
| Healthcare | 1 | $163B |
|
||
| Insurance | 1 | $21B |
|
||
| Industrial Technology | 1 | $17B |
|
||
| Retail | 1 | $16B |
|
||
| Industrial Distribution | 1 | $10B |
|
||
| Utilities | 1 | $9B |
|
||
Price history
-29.4% since first listed9 events — show timeline
- 2026-05-20 Listed $38,750 MARIS as Distributed by MLS Grid
- 2026-05-19 Coming Soon $38,750 MARIS as Distributed by MLS Grid
- 2024-08-23 Sold (Public Records) — Public Records
- 2024-08-19 Sold (MLS) — MARIS as Distributed by MLS Grid
- 2024-03-25 Pending — MARIS as Distributed by MLS Grid
- 2024-03-07 Price Changed $25,900 MARIS as Distributed by MLS Grid
- 2024-01-17 Price Changed $28,900 MARIS as Distributed by MLS Grid
- 2023-12-21 Price Changed $49,900 MARIS as Distributed by MLS Grid
- 2023-12-13 Listed $54,900 MARIS as Distributed by MLS Grid
Property tax history
+3.3%/yrLatest (2025): $422 · -4.2% YoY. Source: county tax records.
Cash-flow waterfall
monthlySold comps — $/sqft
last 12 mo · ≤1 miLoading sold comps…