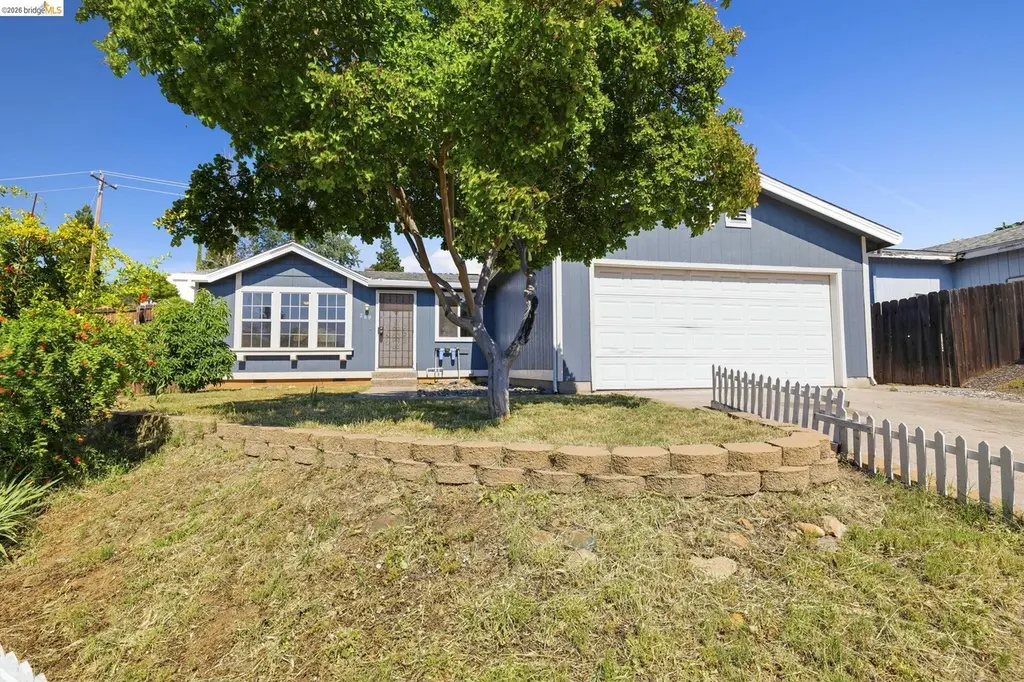
289 Deer Field Cir · Copperopolis, CA
Flood risk 1/10 · Minimal
- FEMA flood zone
- X (unshaded)
- Chance of flooding over 30 yrs
- 0.0%
- Est. flood insurance / yr
- $507 – $1,088
Fire risk 9/10 · Severe
- Est. fire insurance / yr
- $659 – $1,223
Heat risk 7/10 · Major
- Hot days now (above 103°F)
- 7 days/yr
- Hot days in 30 yrs
- 17 days/yr
Wind risk 1/10 · Minimal
- Chance of severe wind over 30 yrs
- —
Air-quality risk 10/10 · Severe
- Unhealthy air days now
- 30 days/yr
- Unhealthy air days in 30 yrs
- 35 days/yr
Risk factors via First Street. Map © Google.
Why this score? — see what drove the D grade
The composite is a weighted blend of 9 inputs, each scored 0–100. Each bar is that input's sub-score; the figure is the points it added to the 100-point composite (weight × sub-score).
- Cash flow +13.3/30.0
- ARV discount +7.5/15.0
- Schools +4.5/10.0
- DSCR +4.0/10.0
- 1% rule +3.1/10.0
- Livability +2.9/5.0
- Rent growth +2.5/5.0
- Condition / age +2.5/5.0
- Appreciation +0.0/10.0
$250,000
🖨 Deal sheet 📄 Offer letter ✓ Due diligence
Listing remarks MLS
What a deal! Light and Airy, Open floor plan with 2 Bedrooms and 2 full Bathrooms. Living/Dining room, plus Separate room that is perfect for an office or formal dining room. New carpet, interior paint and remodeled bathroom in the last year. Large Fenced back yard. Minutes from Lake Tulloch, New Melones and all the summer fun you'll need.
Key facts
- Single level home
- Indoor laundry room
- Fenced backyard
Tags
Property features AI
Finance
- HOA & community: Copper Meadows Homeowners Association; Monthly association fee of $20
Exterior
- Parking: Attached garage; 2 covered parking spaces; 2 garage spaces
- Utilities: Public water; Public sewer
- Home design: Single family residence; Manufactured house; Built in 1993
- Construction: Wood siding; Shingle roof; Crawl space foundation
- Exterior features: Back yard; Deck; Level lot
Interior
- Kitchen: Dishwasher; Disposal; Gas range / cooktop; Refrigerator
- Bedrooms: 3 bedrooms
- Flooring: Laminate; Vinyl; Carpet
- Bathrooms: 2 full bathrooms; Primary bathroom with stall shower; Additional bathroom(s) with shower over tub
- Heating & cooling: Central heating
- Interior features: No additional rooms; Main entry; One fireplace
- Laundry & utility: Laundry room with sink
Neighborhood map
What this means for you Summary
Snapshot
- This is a 2-bed/2.0-bath manufactured listed at $250k.
Deal economics
- At list price, monthly cash flow is $-1 ($-13/yr) — negative.
- To cash-flow at today's rent, offer at most $250k (0.1% below list).
- To meet the 1% rule (rent ≥ 1% of price), the offer needs to be $202k (19.2% below list).
- Recommended offer: $202k (19.2% below list) — sets the bar for 1% rule.
- Cap rate 6.3% vs local median 2.0% in Copperopolis — top-decile yield for the area; either an underpriced asset or a hidden risk that comps aren't pricing in. Stress-test before assuming the spread holds.
Location & tenants
- Location reads 58/100 on livability (#691 in CA) — a working-class tenant base; expect higher turnover. Strengths: housing A+, employment A-, crime B+; Watch: schools D+, amenities F, commute F.
- Bret Harte Union High (town): math 35% / reading 65% proficiency, ranked #429 of 1,400 in CA (top 31%) — acceptable for families but not a draw, mixed tenant base, ~2y average lease.
- Market conditions: 235 active listings in the ZIP; 77 units permitted in Calaveras County in 2024 (0 in 5+ unit buildings).
Forward outlook
- Local home prices are declining (-3.0%/yr); year-one equity from $2k of loan paydown is wiped out by about $8k of value loss. Plan a longer hold.
- Calaveras County population projected at -18% by 2050 — secular population decline; favor cash flow + early exit over multi-decade hold.
Negotiation context
- Only 12 days on market — expect competitive offers; lowballing is unlikely to land.
- 2 sale attempts since 11y ago with the ask held roughly flat each time — persistent listings suggest the price (not the market) is what's stuck; bring a comps-based counter.
- Current owner paid $120k; list at $250k implies a 108% gain — meaningful room to come down on a strong offer.
Risks & watch-outs
- Climate carrying-cost: severe wildfire risk; extreme-heat days projected 7→17/yr by 2055 (HVAC capex compounding) — expect insurance premiums to compound above CPI over the hold.
Questions for the listing agent
- What do current leases actually rent for vs. the listed asking? Can we see a recent rent roll and the last 12 months of T-12 income?
- What does the HOA fee cover, when was the last increase, and are there any pending special assessments or reserve-fund shortfalls?
- Is there a deadline driving the sale (1031 exchange, divorce, estate, relocation)? That informs how much negotiation room exists.
- Schools are D-rated, which usually means shorter tenancies and higher turnover. Who's the typical renter profile here, and what's been the actual vacancy rate?
- The area grade is low — what's the realistic commute time and amenity access for the typical tenant pool here? Any planned neighborhood developments (good or bad) we should know about?
- What's the average days-on-market for RENTAL listings here right now (not sales)? A rising rental-DOM trend means longer vacancies and softer asking-rent achievability than the comps imply.
- What's the recent tenant-quality profile in this submarket — average credit score on applications, eviction rate, late-payment / NSF rate, and stable-employment percentage? A property-management company in the area should have these aggregated.
- How much new for-sale + rental construction is in the pipeline within 1–3 miles? Heavy new supply typically softens prices + rents 12–24 months out; constrained supply supports both.
Investment metrics
- 1% rule
- 0.81% ✗
- Cap rate
- 6.29%
- Cash-on-cash
- -0.02%
- DSCR
- 1.00
- GRM
- 10.3
CMA / ARV
- ARV (on-the-fly)
- $158,848
- Comps found
- 4
Show comp detail 4 sales within ~0.75 mi
| Address | Dist | Beds/Ba | Sqft | Sold | Price | $/sf | Match |
|---|---|---|---|---|---|---|---|
| 954 Morado Cir | 0.36mi | 2/2.0 | 1,050 (-4%) | 9mo | $137,500 | $131 | 70 |
| 976 Morado Cir | 0.39mi | 3/2.0 (+1) | 1,020 (-6%) | 5mo | $149,000 | $146 | 62 |
| 923 Morado Cir | 0.34mi | 3/2.0 (+1) | 960 (-12%) | 7mo | $141,500 | $147 | 54 |
| 979 Morado Cir #123 | 0.38mi | 2/1.0 | 1,196 (+10%) | 22mo | $128,000 | $107 | 43 |
Match score weights: distance 35% · size 25% · config 20% · recency 20%. Top-matched comps best support the ARV.
Projected returns pro-forma
-3.0% appreciation · 3.0% rent growth · sell at horizon
- IRR
- -16.4%
- Equity multiple
- 0.42×
- Total profit
- $-40,628
- Equity at exit
- $37,276
- IRR
- -8.1%
- Equity multiple
- 0.49×
- Total profit
- $-35,666
- Equity at exit
- $21,615
Cash invested: $70,000 (down + closing). Projections, not guarantees.
Landlord ↔ Tenant lean methodology
- Overall (STATE)
- 18 Strongly Tenant-Friendly
- State California
- 18 Strongly Tenant-Friendly · D+13
- County
- — inherits STATE
- City
- — inherits STATE
ZIP-level market 95228
- Active inventory
- 235
- Price-to-rent
- 10.3×
Monthly cashflow live
- Estimated rent
- $2,021 medium interval (Pro) →
- Mortgage (P&I)
- −$1,311
- Tax from tax record
- −$162 /mo · $1,950/yr
- Insurance
- −$104
- HOA
- −$20
- Vacancy / Maint / Mgmt
- −$424
- Net cashflow
- $-1
Break-even live
UW: 25.0% down · 7.5% · 30yr · 1.5% tax · 5.0% vac · 8.0% maint · 8.0% mgmt
Financing live
Cash to close
- Down payment
- $62,500
- Closing costs
- $7,500
- Reserves months
- —
- Total cash needed
- —
Loan-product check · same deal, 3 products live
Conventional
25% down · 7.5% · 30yr
- Down + closing
- —
- Monthly P&I
- —
- Monthly cashflow
- —
- DSCR
- —
- Eligible?
- —
Personal DTI + credit; lowest rate.
DSCR
20% down · 8.5% · 30yr
- Down + closing
- —
- Monthly P&I
- —
- Monthly cashflow
- —
- DSCR
- —
- Eligible?
- —
No personal income docs; deal must DSCR.
Hard money
10% down · 12.0% · 12mo
- Down + closing
- —
- Monthly P&I
- —
- Monthly cashflow
- —
- DSCR
- —
- Eligible?
- —
Short-term bridge; refi at stabilization.
HOA detail
- Monthly dues
- $20 · $240/yr
Listing history 4 events
-
2026-05-15$250,000 Active
-
2015-07-24soldstatus $120,000 341-char remark
Show marketing remark (341 chars)
What a deal! Light and Airy, Open floor plan with 2 Bedrooms and 2 full Bathrooms. Living/Dining room, plus Separate room that is perfect for an office or formal dining room. New carpet, interior paint and remodeled bathroom in the last year. Large Fenced back yard. Minutes from Lake Tulloch, New Melones and all the summer fun you'll need.
-
2015-07-24soldstatus $120,100
Show marketing remark (341 chars)
What a deal! Light and Airy, Open floor plan with 2 Bedrooms and 2 full Bathrooms. Living/Dining room, plus Separate room that is perfect for an office or formal dining room. New carpet, interior paint and remodeled bathroom in the last year. Large Fenced back yard. Minutes from Lake Tulloch, New Melones and all the summer fun you'll need.
-
2015-03-21$129,000 341-char remark
Show marketing remark (341 chars)
What a deal! Light and Airy, Open floor plan with 2 Bedrooms and 2 full Bathrooms. Living/Dining room, plus Separate room that is perfect for an office or formal dining room. New carpet, interior paint and remodeled bathroom in the last year. Large Fenced back yard. Minutes from Lake Tulloch, New Melones and all the summer fun you'll need.
ⓘ Source: listings_history table (triggers on properties + properties_extension) + one-shot
backfill from property_details.listing_events for pre-trigger history.
Tax reassessment forecast CA · Resets to sale price
- Current annual tax
- $1,950 · $162/mo
- Projected year-2 tax
- $1,950 · $162/mo
- Expected delta
- $0/yr ($0/mo · 0.0%)
ⓘ Screening estimate from a state-policy table — verify with the county assessor before closing.
Climate risk First Street
- Flood 1/10 Low FEMA zone X (unshaded) · 0% chance over 30 yrs
- Wildfire 9/10 Extreme
- Heat 7/10 Severe 7 d/yr ≥103°F today · 17 d/yr by 30 yrs out
- Wind 1/10 Low
- Air quality 10/10 Extreme 30 unhealthy d/yr today · 35 by 30 yrs out
Nearby sold comps map
Loading sold comps map…
Walkable amenities ~0.75 mi
Loading nearby amenities…
Taxation est. · year 1
- Rental income
- $24,252
- − Mortgage interest
- −$14,004
- − Property taxes
- −$1,950
- − Insurance
- −$1,250
- − Repairs & maintenance
- −$1,940
- − Management
- −$1,940
- − HOA
- −$240
- − Depreciation
- −$7,273
- Taxable loss
- −$4,344
- Est. tax savings @ 24.0%
- +$1,043
- After-tax cash flow
- $1,030/yr
For passive investors: Depreciation is non-cash, so a rental often shows a tax loss while cash-flowing — sheltering income. Rental losses are passive: they offset passive income freely, and up to $25,000/yr can offset ordinary (W-2) income if you actively participate and your MAGI is under $100k (phasing out to $0 by $150k); unused losses carry forward. On sale, claimed depreciation is recaptured at up to 25%, and gains may owe capital-gains tax (a 1031 exchange can defer both). Figures are a year-1 estimate at your 24.0% rate — not tax advice; consult a CPA.
Schools (NCES district)
- District
- Bret Harte Union High
- NCES district ID
- 0605940
- Math proficiency
- 35% ▲ 5.00%
- Reading proficiency
- 65% ▲ 5.00%
- Median HH income
- $56,974
- Composite
- 45.41/100
- National rank
- #5708
- State rank
- #429 of 1400 in CA
Livability — Copperopolis
- Score
- 58/100
- State rank
- #691
- US rank
- #21010
Category grades
Schools grade is shown separately in the Schools card above.
Census & demographics
- Census place
- Copperopolis, CA
- Population (ZIP)
- 4,880
Population outlook (Calaveras County) Hauer SSP2
- Today (2025)
- 43,163 people
- By 2030
- 41,703 · -3.4%
- By 2040
- 38,202 · -11.5%
- By 2050
- 35,385 · -18.0%
- By 2075
- 30,807 · -28.6%
- By 2100
- 25,755 · -40.3%
Race, ethnicity, and origin ACS 2023
- Neighborhood character
- Predominantly White (71%)
- Race & ethnicity
- White 71% Hispanic / Latino 25% Two or more races 15% Black 2%
- Hispanic origin (detail)
- Mexican 21%
- Common ancestry
- Iranian 4% Romanian 4% Russian 3%
- Foreign-born
- 3% · Canada
- Languages at home
- 91% English-only · Spanish 9% Tagalog/Filipino 1%
Political lean MEDSL · Calaveras
- 2024 margin
- Strong R (+28.1) · D 34.7% · R 62.8% · Other 2.5%
- 2008→2024 swing
- -15.2pp toward R · 2008: -13.0pp · 2024: -28.1pp
- All cycles
- 2024: R+28.1 2020: R+23.8 2016: R+23.9 2012: R+17.0 2008: R+13.0
Not yet ingested
- Civics
- —
Market trends
- HPI YoY
- ▼ -141.73%
- Current HPI
- 176.1251
- Rent YoY
- —
- Metro
- —
- State GDP YoY
- ▲ 3.21%
- F500 in state
- 116
Industry mix (Fortune 500 HQ in CA)
| Industry | F500 HQs | Revenue |
|---|---|---|
| Technology | 27 | $1,492B |
|
||
| Financial Services | 3 | $174B |
|
||
| Retail | 3 | $44B |
|
||
| Insurance | 3 | $26B |
|
||
| Media / Entertainment | 2 | $115B |
|
||
| Pharmaceuticals / Biotech | 2 | $62B |
|
||
Price history
+93.8% since first listed4 events — show timeline
- 2026-05-15 Listed $250,000 bridgeMLS, Bay East AOR, or Contra Costa AOR
- 2015-07-24 Sold (Public Records) $120,100 Public Records
- 2015-07-24 Sold (MLS) $120,000 bridgeMLS, Bay East AOR, or Contra Costa AOR
- 2015-03-21 Listed $129,000 bridgeMLS, Bay East AOR, or Contra Costa AOR
Property tax history
+5.5%/yrLatest (2025): $1,950 · +0.8% YoY. Source: county tax records.
Cash-flow waterfall
monthlySold comps — $/sqft
last 12 mo · ≤1 miLoading sold comps…