 🏗️ New Construction
8614 Giovanni Ave · Lakewood Park, FL
Flood risk 1/10 · Minimal
- FEMA flood zone
- X (unshaded)
- Chance of flooding over 30 yrs
- 0.0%
- Est. flood insurance / yr
- $507 – $1,088
Fire risk 5/10 · Moderate
- Est. fire insurance / yr
- $947 – $1,759
Heat risk 10/10 · Severe
- Hot days now (above 107°F)
- 7 days/yr
- Hot days in 30 yrs
- 24 days/yr
Wind risk 10/10 · Severe
- Chance of severe wind over 30 yrs
- 99.0%
Air-quality risk 1/10 · Minimal
- Unhealthy air days now
- 0 days/yr
- Unhealthy air days in 30 yrs
- 0 days/yr
Risk factors via First Street. Map © Google.
Why this score? — see what drove the D- grade
The composite is a weighted blend of 9 inputs, each scored 0–100. Each bar is that input's sub-score; the figure is the points it added to the 100-point composite (weight × sub-score).
- Cash flow +13.1/30.0
- ARV discount +7.5/15.0
- DSCR +3.9/10.0
- Schools +3.7/10.0
- 1% rule +3.2/10.0
- Livability +3.2/5.0
- Rent growth +2.5/5.0
- Condition / age +2.5/5.0
- Appreciation +0.0/10.0
$326,300
🖨 Deal sheet 📄 Offer letter ✓ Due diligence
Listing remarks
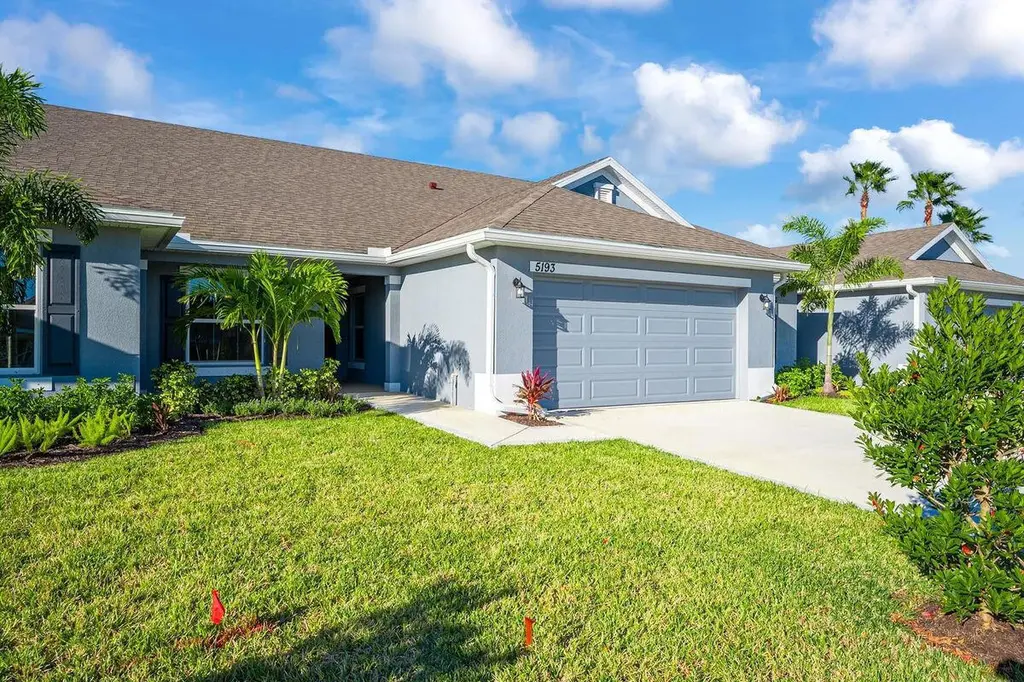
Find the perfect balance of togetherness and privacy in this beautiful 3-bedroom, 2-bath family home. The bright, open-concept living area is designed for making memories, offering a seamless flow from the kitchen to the dining space. You'll love the split-bedroom layout, featuring a private master suite with relaxing pond views—your own personal retreat at the end of a busy day. Located in a serene setting with a spacious 2-car garage, this home is ready for your family to move in and grow! Sample Photos
Key facts
- 4,095 sq ft lot
- 2 garage spots
- Community pool
Property features AI
Finance
- Other: Pets allowed with no restrictions
- HOA & community: Community amenities include clubhouse, fitness center, pool, playground, picnic area, tennis and pickleball courts, and sidewalks; HOA dues approximately $80 monthly (covers grounds and structure maintenance and common areas)
Exterior
- Parking: Attached 2-car garage; Driveway parking; Concrete surfaces; Total parking for 4 vehicles (2 covered spaces)
- Security: Smoke detectors
- Utilities: Public water; Public sewer; Electricity connected; Water connected; Sewer connected; Cable available
- Home design: Villa (single-story); New construction; South-facing
- Construction: Built by Adams Homes (model 1509); Block/concrete/CB S construction with stucco finish; Shingle roof; Block foundation
- Exterior features: Covered patio; Patio; Waterfront (no waterfront features indicated)
Interior
- Kitchen: Dishwasher; Electric range; Microwave; Garbage disposal
- Bedrooms: Three bedrooms on the main level
- Flooring: Carpet; Ceramic tile
- Bathrooms: Two full bathrooms
- Heating & cooling: Central electric heating; Central air conditioning; Ceiling fans
- Interior features: Cathedral and vaulted ceilings; Kitchen island; Walk-in closets; Split bedroom layout; Roman tub; Insulated windows
- Laundry & utility: Laundry closet with washer and electric dryer hookups inside; Electric water heater
Neighborhood map
What this means for you Summary
Snapshot
- This is a 3-bed/2.0-bath land listed at $326k.
Deal economics
- At list price, monthly cash flow is $-13 ($-155/yr) — negative.
- To cash-flow at today's rent, offer at most $324k (0.7% below list).
- To meet the 1% rule (rent ≥ 1% of price), the offer needs to be $267k (18.2% below list).
- Recommended offer: $267k (18.2% below list) — sets the bar for 1% rule.
Location & tenants
- Location reads 63/100 on livability (#719 in FL) — a middle-class / working-renter tenant base. Strengths: cost of living A+, housing A+; Watch: amenities F, commute F, health & safety D-.
- St. Lucie (urban): math 40% / reading 48% proficiency, ranked #51 of 73 in FL (top 70%) — families likely to look elsewhere, expect single-tenant / working-renter base with shorter leases.
- Zoned schools: Dan Mccarty Middle School (math 23% / reading 23%, grade F, #542 of 571 statewide, top 95%, 747 students, 88% FRL); Fort Pierce Central High School (math 15% / reading 45%, grade F, #441 of 667 statewide, top 67%, 3,091 students, 62% FRL) — zoned schools average 75% FRL vs 59% district-wide (16 pts higher); higher-poverty schools than district average — tighter screening recommended.
- Zoned-school proficiency averages 26% at this address vs 44% district-wide (-18 pts) — the specific schools serving this property underperform the St. Lucie average; the district grade overstates school quality for this exact location.
- Market conditions: 292 active listings in the ZIP; 10 comparable units currently listed for rent nearby; rentals at typical pace (median 21d on market — plan ~3-4 weeks tenant-placement turnaround); 4,868 units permitted in St. Lucie County in 2024 (268 in 5+ unit buildings).
- At $2,669/mo this rent would consume 51% of the median local household income ($63k/yr) (locally 140% of renters already pay >50% of income on rent) — very limited rent-growth headroom before tenants either downsize or default.
Forward outlook
- Local home prices are declining (-3.0%/yr); year-one equity from $2k of loan paydown is wiped out by about $10k of value loss. Plan a longer hold.
- St. Lucie County population projected at +20% by 2050 — long-run rental-demand tailwind backs the buy-and-hold thesis.
Negotiation context
- It's been on market 42 days — a 3% lower offer ($317k) is reasonable based on typical stale-listing flexibility.
Risks & watch-outs
- Climate carrying-cost: severe wind risk, 99% chance of damaging wind over 30y; moderate wildfire risk; extreme-heat days projected 7→24/yr by 2055 (HVAC capex compounding) — expect insurance premiums to compound above CPI over the hold.
Questions for the listing agent
- What do current leases actually rent for vs. the listed asking? Can we see a recent rent roll and the last 12 months of T-12 income?
- It's been on market 42 days. Have you received any prior offers? Is the seller open to a 18% concession, seller financing, or rate buy-down credit?
- What does the HOA fee cover, when was the last increase, and are there any pending special assessments or reserve-fund shortfalls?
- Is there a deadline driving the sale (1031 exchange, divorce, estate, relocation)? That informs how much negotiation room exists.
- Schools are F-rated, which usually means shorter tenancies and higher turnover. Who's the typical renter profile here, and what's been the actual vacancy rate?
- The area grade is low — what's the realistic commute time and amenity access for the typical tenant pool here? Any planned neighborhood developments (good or bad) we should know about?
- What's the average days-on-market for RENTAL listings here right now (not sales)? A rising rental-DOM trend means longer vacancies and softer asking-rent achievability than the comps imply.
- What's the recent tenant-quality profile in this submarket — average credit score on applications, eviction rate, late-payment / NSF rate, and stable-employment percentage? A property-management company in the area should have these aggregated.
- How much new for-sale + rental construction is in the pipeline within 1–3 miles? Heavy new supply typically softens prices + rents 12–24 months out; constrained supply supports both.
Investment metrics
- 1% rule
- 0.82% ✗
- Cap rate
- 6.25%
- Cash-on-cash
- -0.17%
- DSCR
- 0.99
- GRM
- 10.2
CMA / ARV
No comps found within radius.
Projected returns pro-forma
-3.0% appreciation · 3.0% rent growth · sell at horizon
- IRR
- -16.6%
- Equity multiple
- 0.41×
- Total profit
- $-53,739
- Equity at exit
- $48,652
- IRR
- -8.4%
- Equity multiple
- 0.47×
- Total profit
- $-48,025
- Equity at exit
- $28,212
Cash invested: $91,364 (down + closing). Projections, not guarantees.
Landlord ↔ Tenant lean methodology
- Overall (STATE)
- 87 Strongly Landlord-Friendly
- State Florida
- 87 Strongly Landlord-Friendly · R+3
- County
- — inherits STATE
- City
- — inherits STATE
ZIP-level market 34951
- Home prices YoY
- -23.6%
- Active inventory
- 292
- Price-to-rent
- 10.2×
Monthly cashflow live
- Estimated rent
- $2,669 high interval (Pro) →
- Mortgage (P&I)
- −$1,711
- Tax from tax record
- −$194 /mo · $2,333/yr
- Insurance
- −$136
- HOA
- −$80
- Vacancy / Maint / Mgmt
- −$561
- Net cashflow
- $-13
Break-even live
UW: 25.0% down · 7.5% · 30yr · 1.5% tax · 5.0% vac · 8.0% maint · 8.0% mgmt
Financing live
Cash to close
- Down payment
- $81,575
- Closing costs
- $9,789
- Reserves months
- —
- Total cash needed
- —
Loan-product check · same deal, 3 products live
Conventional
25% down · 7.5% · 30yr
- Down + closing
- —
- Monthly P&I
- —
- Monthly cashflow
- —
- DSCR
- —
- Eligible?
- —
Personal DTI + credit; lowest rate.
DSCR
20% down · 8.5% · 30yr
- Down + closing
- —
- Monthly P&I
- —
- Monthly cashflow
- —
- DSCR
- —
- Eligible?
- —
No personal income docs; deal must DSCR.
Hard money
10% down · 12.0% · 12mo
- Down + closing
- —
- Monthly P&I
- —
- Monthly cashflow
- —
- DSCR
- —
- Eligible?
- —
Short-term bridge; refi at stabilization.
Rent comps 10 comps
| Address | Beds | Baths | Sqft | Rent | $/sqft | DOM | Units | Dist |
|---|---|---|---|---|---|---|---|---|
| 5154 Armina Pl Fort Pierce, FL | 3.0 | 2.0 | 1477 | $2,350 | $1.59 | 14d | 1 | 0.16mi |
| 5082 Armina Pl Fort Pierce, FL | 3.0 | 2.0 | 1464 | $3,000 | $2.05 | 23d | 1 | 0.19mi |
| 5226 Armina Pl Fort Pierce, FL | 4.0 | 2.0 | 2003 | $2,950 | $1.47 | 21d | 1 | 0.23mi |
| 8674 Pavia St Fort Pierce, FL | 4.0 | 2.0 | 1824 | $2,600 | $1.43 | 21d | 1 | 0.49mi |
| 5234 Oakland Lake Cir Fort Pierce, FL | 3.0 | 2.0 | 1460 | $2,300 | $1.58 | 14d | 1 | 0.84mi |
| 7704 Pacific Ave Fort Pierce, FL | 3.0 | 2.0 | 1719 | $2,500 | $1.45 | 14d | 1 | 1.09mi |
| 6602 Palomar Pkwy Unit A Fort Pierce, FL | 3.0 | 1.0 | 1200 | $2,000 | $1.67 | 23d | 1 | 1.27mi |
| 5010 Killarney Ave Unit A Fort Pierce, FL | 2.0 | 1.0 | 1720 | $1,500 | $0.87 | 23d | 1 | 1.29mi |
| 7403 Winter Garden Pkwy Fort Pierce, FL | 3.0 | 2.0 | 1372 | $2,200 | $1.60 | 21d | 1 | 1.33mi |
| 5510 Shannon Dr Fort Pierce, FL | 3.0 | 2.0 | 1594 | $2,350 | $1.47 | 14d | 1 | 1.38mi |
HOA detail
- Monthly dues
- $80 · $960/yr
Listing history 20 events
-
2026-06-18days on market $326,300 Active 42 DOM
-
2026-06-17days on market $326,300 Active 41 DOM
-
2026-06-16days on market $326,300 Active 40 DOM
-
2026-06-15days on market $326,300 Active 39 DOM
-
2026-06-14days on market $326,300 Active 37 DOM
-
2026-06-13days on market $326,300 Active 36 DOM
-
2026-06-10days on market $326,300 Active 34 DOM
-
2026-06-09days on market $326,300 Active 33 DOM
-
2026-06-08days on market $326,300 Active 32 DOM
-
2026-06-07days on market $326,300 Active 31 DOM
-
2026-06-05days on market $326,300 Active 28 DOM
-
2026-06-03days on market $326,300 Active 27 DOM
-
2026-06-02days on market $326,300 Active 26 DOM
-
2026-06-01days on market $326,300 Active 25 DOM
-
2026-05-31days on market $326,300 Active 24 DOM
-
2026-05-30days on market $326,300 Active 23 DOM
-
2026-05-20price $326,300
-
2026-05-17price $320,300
-
2026-05-09price $317,300
-
2026-05-07$294,300 Active
ⓘ Source: listings_history table (triggers on properties + properties_extension) + one-shot
backfill from property_details.listing_events for pre-trigger history.
Tax reassessment forecast FL · Resets to sale price
- Current annual tax
- $2,333 · $194/mo
- Projected year-2 tax
- $2,708 · $226/mo
- Expected delta
- +$375/yr (+$31/mo · 16.1%)
ⓘ Screening estimate from a state-policy table — verify with the county assessor before closing.
Climate risk First Street
- Flood 1/10 Low FEMA zone X (unshaded) · 0% chance over 30 yrs
- Wildfire 5/10 Major
- Heat 10/10 Extreme 7 d/yr ≥107°F today · 24 d/yr by 30 yrs out
- Wind 10/10 Extreme 99% chance of damaging wind over 30 yrs
- Air quality 1/10 Low 0 unhealthy d/yr today · 0 by 30 yrs out
Nearby sold comps map
Loading sold comps map…
Walkable amenities ~0.75 mi
Loading nearby amenities…
Taxation est. · year 1
- Rental income
- $32,030
- − Mortgage interest
- −$18,278
- − Property taxes
- −$2,333
- − Insurance
- −$1,632
- − Repairs & maintenance
- −$2,562
- − Management
- −$2,562
- − HOA
- −$960
- − Depreciation
- −$9,492
- Taxable loss
- −$5,790
- Est. tax savings @ 24.0%
- +$1,390
- After-tax cash flow
- $1,235/yr
For passive investors: Depreciation is non-cash, so a rental often shows a tax loss while cash-flowing — sheltering income. Rental losses are passive: they offset passive income freely, and up to $25,000/yr can offset ordinary (W-2) income if you actively participate and your MAGI is under $100k (phasing out to $0 by $150k); unused losses carry forward. On sale, claimed depreciation is recaptured at up to 25%, and gains may owe capital-gains tax (a 1031 exchange can defer both). Figures are a year-1 estimate at your 24.0% rate — not tax advice; consult a CPA.
Schools (NCES district)
- District
- St. Lucie
- NCES district ID
- 1201770
- Math proficiency
- 40% ▼ -11.00%
- Reading proficiency
- 48% ▼ -4.00%
- Median HH income
- $44,737
- Composite
- 37.28/100
- National rank
- #4449
- State rank
- #51 of 73 in FL
Livability — Lakewood Park
- Score
- 63/100
- State rank
- #719
- US rank
- #15407
Category grades
Schools grade is shown separately in the Schools card above.
Census & demographics
- County
- Saint Lucie County · 337,150 people
- Metro
- Port St. Lucie, FL
- Population (ZIP)
- 17,148
- Household income
- $63,122
- Rent vs Own
- Severe rent burden
- 140.0
Population outlook (St. Lucie County) Hauer SSP2
- Today (2025)
- 338,016 people
- By 2030
- 355,687 · +5.2%
- By 2040
- 385,521 · +14.1%
- By 2050
- 406,106 · +20.1%
- By 2075
- 441,054 · +30.5%
- By 2100
- 436,885 · +29.2%
Race, ethnicity, and origin ACS 2023
- Neighborhood character
- Predominantly White (74%)
- Race & ethnicity
- White 74% Black 13% Hispanic / Latino 8% Two or more races 7% Asian 2%
- Hispanic origin (detail)
- Mexican 2% Puerto Rican 2% Cuban 2%
- Common ancestry
- Romanian 3% Italian 2% Lithuanian 2%
- Foreign-born
- 10% · Canada, Jamaica, Vietnam
- Languages at home
- 88% English-only · Spanish 7% French/Haitian/Cajun 3% Vietnamese 1%
Political lean MEDSL · St. Lucie
- 2024 margin
- Lean R (+9.1) · D 45.1% · R 54.2%
- 2008→2024 swing
- -21.2pp toward R · 2008: 12.1pp · 2024: -9.1pp
- All cycles
- 2024: R+9.1 2020: R+1.6 2016: R+2.5 2012: D+7.9 2008: D+12.1
Not yet ingested
- Civics
- —
Market trends
- HPI YoY
- ▼ -106.06%
- Current HPI
- 343.1376
- Rent YoY
- —
- Metro
- Port St. Lucie, FL
- State GDP YoY
- ▲ 3.28%
- F500 in state
- 36
Industry mix (Fortune 500 HQ in FL)
| Industry | F500 HQs | Revenue |
|---|---|---|
| Industrial Technology | 2 | $29B |
|
||
| Insurance | 2 | $17B |
|
||
| Retail | 1 | $60B |
|
||
| Technology Distribution | 1 | $58B |
|
||
| Homebuilding | 1 | $35B |
|
||
| Technology Manufacturing | 1 | $35B |
|
||
Price history
+10.9% since first listed4 events — show timeline
- 2026-05-20 Price Changed $326,300 Beaches MLS
- 2026-05-17 Price Changed $320,300 Beaches MLS
- 2026-05-09 Price Changed $317,300 Beaches MLS
- 2026-05-07 Listed $294,300 Beaches MLS
Property tax history
+4.4%/yrLatest (2025): $2,333 · +3.5% YoY. Source: county tax records.
Cash-flow waterfall
monthlySold comps — $/sqft
last 12 mo · ≤1 miLoading sold comps…