10722 Locust Dr · Gladewater, TX
Flood risk 1/10 · Minimal
- FEMA flood zone
- X (unshaded)
- Chance of flooding over 30 yrs
- 0.0%
- Est. flood insurance / yr
- $507 – $1,088
Fire risk 5/10 · Moderate
- Est. fire insurance / yr
- $1,222 – $2,270
Heat risk 7/10 · Major
- Hot days now (above 110°F)
- 7 days/yr
- Hot days in 30 yrs
- 27 days/yr
Wind risk 6/10 · Moderate
- Chance of severe wind over 30 yrs
- 67.0%
Air-quality risk 2/10 · Minimal
- Unhealthy air days now
- 1 days/yr
- Unhealthy air days in 30 yrs
- 2 days/yr
Risk factors via First Street. Map © Google.
Why this score? — see what drove the C- grade
The composite is a weighted blend of 9 inputs, each scored 0–100. Each bar is that input's sub-score; the figure is the points it added to the 100-point composite (weight × sub-score).
- Cash flow +21.4/30.0
- ARV discount +7.5/15.0
- DSCR +6.8/10.0
- Schools +5.0/10.0
- 1% rule +4.3/10.0
- Condition / age +4.0/5.0
- Livability +3.2/5.0
- Rent growth +2.5/5.0
- Appreciation +0.0/10.0
$129,000
🖨 Deal sheet (PDF) 📄 Offer letter ✓ Due diligence
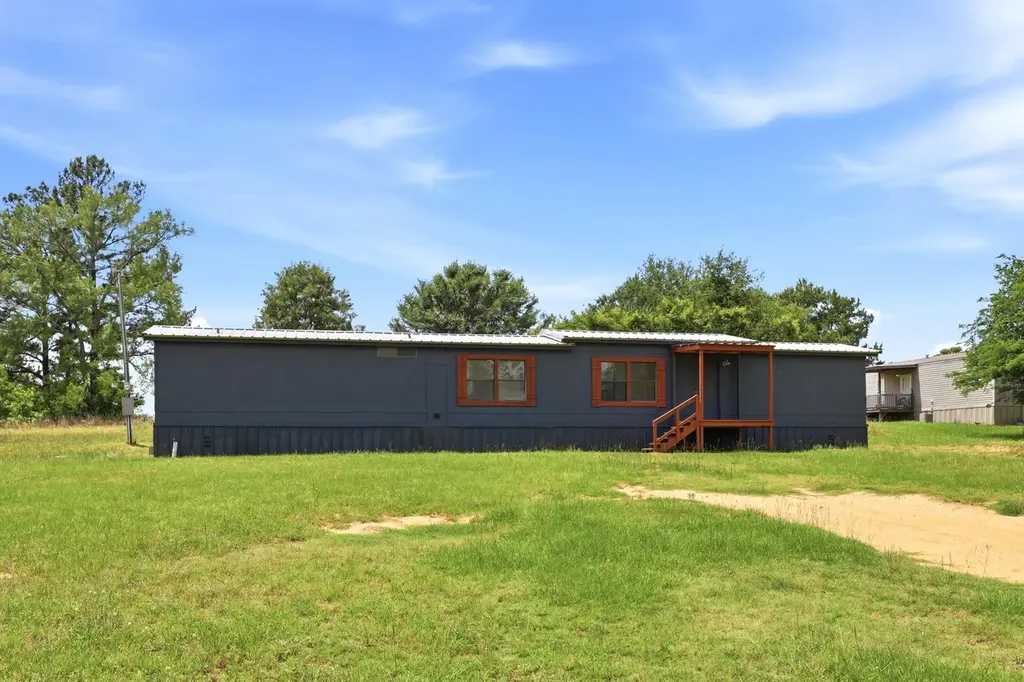
Listing remarks
OWNER FINANCING AVAILABLE! This 2 bed 2 bath manufactured home has been recently remodeled and is ready for a new owner. These updates include new flooring, new fixtures, fresh paint, new bathroom vanities, and more. This property is a half acre lot situated between Gladewater and Big Sandy. It would make a great investment property or primary residence.
Key facts
- Recently remodeled
- Fresh paint
- New flooring
Tags
Property features AI
Finance
- Financial info: Annual tax amount listed (not included per instructions)
Exterior
- Utilities: Electric water heater
- Home design: Single-story manufactured home; Residential property
- Exterior features: Half-acre lot (0.5 acre)
Interior
- Bedrooms: Total of 4 rooms (includes bedrooms and other living spaces)
- Bathrooms: 2 full bathrooms
- Heating & cooling: Window unit(s) for cooling
- Interior features: Electric water heater; Window cooling units
Neighborhood map
What this means for you Summary
Snapshot
- This is a 2-bed/2.0-bath manufactured listed at $129k. Condition is rated good.
Deal economics
- At list price, monthly cash flow is $192 ($2k/yr) — positive.
- The deal already cash-flows at list — no discount required.
- To meet the 1% rule (rent ≥ 1% of price), the offer needs to be $120k (7.0% below list).
- Recommended offer: $120k (7.0% below list) — sets the bar for 1% rule.
- Cap rate 8.1% vs local median 4.9% in Gladewater — top-decile yield for the area; either an underpriced asset or a hidden risk that comps aren't pricing in. Stress-test before assuming the spread holds.
Location & tenants
- Location reads 64/100 on livability (#805 in TX) — a middle-class / working-renter tenant base. Strengths: cost of living A+, housing A; Watch: crime C-, schools D+, amenities F.
- Market conditions: 101 active listings in the ZIP; 1 comparable units currently listed for rent nearby; 34 units permitted in Upshur County in 2024 (0 in 5+ unit buildings).
Forward outlook
- Local home prices are declining (-3.0%/yr); year-one equity from $892 of loan paydown is wiped out by about $4k of value loss. Plan a longer hold.
- Upshur County population projected at +9% by 2050 — modest demand growth; plan on rents tracking national, not racing it.
Negotiation context
- Only 5 days on market — expect competitive offers; lowballing is unlikely to land.
Risks & watch-outs
- Climate carrying-cost: major wind risk, 67% chance of damaging wind over 30y; moderate wildfire risk; extreme-heat days projected 7→27/yr by 2055 (HVAC capex compounding) — expect insurance premiums to compound above CPI over the hold.
Questions for the listing agent
- Is there a deadline driving the sale (1031 exchange, divorce, estate, relocation)? That informs how much negotiation room exists.
- Schools are D-rated, which usually means shorter tenancies and higher turnover. Who's the typical renter profile here, and what's been the actual vacancy rate?
- What's the average days-on-market for RENTAL listings here right now (not sales)? A rising rental-DOM trend means longer vacancies and softer asking-rent achievability than the comps imply.
- What's the recent tenant-quality profile in this submarket — average credit score on applications, eviction rate, late-payment / NSF rate, and stable-employment percentage? A property-management company in the area should have these aggregated.
- How much new for-sale + rental construction is in the pipeline within 1–3 miles? Heavy new supply typically softens prices + rents 12–24 months out; constrained supply supports both.
Investment metrics
- 1% rule
- 0.93% ✗
- Cap rate
- 8.08%
- Cash-on-cash
- 6.39%
- DSCR
- 1.28
- GRM
- 9.0
CMA / ARV
No comps found within radius.
Projected returns pro-forma
-3.0% appreciation · 3.0% rent growth · sell at horizon
- IRR
- -6.5%
- Equity multiple
- 0.76×
- Total profit
- $-8,722
- Equity at exit
- $19,234
- IRR
- 3.0%
- Equity multiple
- 1.22×
- Total profit
- $7,909
- Equity at exit
- $11,154
Cash invested: $36,120 (down + closing). Projections, not guarantees.
Landlord ↔ Tenant lean methodology
- Overall (STATE)
- 87 Strongly Landlord-Friendly
- State Texas
- 87 Strongly Landlord-Friendly · R+5
- County
- — inherits STATE
- City
- — inherits STATE
ZIP-level market 75755
- Home prices YoY
- -18.6%
- Active inventory
- 101
- Price-to-rent
- 9.0×
Monthly cashflow live
- Estimated rent
- $1,200 medium interval (Pro) →
- Mortgage (P&I)
- −$676
- Tax from tax record
- −$25 /mo · $306/yr
- Insurance
- −$54
- HOA
- −$0
- Vacancy / Maint / Mgmt
- −$252
- Net cashflow
- $192
Break-even live
Sensitivity live
| Price | -10% $265 | -5% $229 | +0% $192 | +5% $156 | +10% $119 |
|---|---|---|---|---|---|
| Rent | -10% $97 | -5% $145 | +0% $192 | +5% $240 | +10% $287 |
| Rate | -1.0pp $257 | -0.5pp $225 | base $192 | +0.5pp $159 | +1.0pp $125 |
UW: 25.0% down · 7.5% · 30yr · 1.5% tax · 5.0% vac · 8.0% maint · 8.0% mgmt
Financing live
Cash to close
- Down payment
- $32,250
- Closing costs
- $3,870
- Reserves months
- —
- Total cash needed
- —
Loan-product check · same deal, 3 products live
Conventional
25% down · 7.5% · 30yr
- Down + closing
- —
- Monthly P&I
- —
- Monthly cashflow
- —
- DSCR
- —
- Eligible?
- —
Personal DTI + credit; lowest rate.
DSCR
20% down · 8.5% · 30yr
- Down + closing
- —
- Monthly P&I
- —
- Monthly cashflow
- —
- DSCR
- —
- Eligible?
- —
No personal income docs; deal must DSCR.
Hard money
10% down · 12.0% · 12mo
- Down + closing
- —
- Monthly P&I
- —
- Monthly cashflow
- —
- DSCR
- —
- Eligible?
- —
Short-term bridge; refi at stabilization.
Rent comps 1 comps
| Address | Beds | Baths | Sqft | Rent | $/sqft | DOM | Units | Dist |
|---|---|---|---|---|---|---|---|---|
| 519 North St Unit 521 Gladewater, TX | 2.0 | 1.0 | 865 | $1,200 | $1.39 | 44d | 1 | 1.14mi |
Listing history 3 events
-
2026-05-20status Pending
-
2026-05-15$129,000 Active
-
2025-10-28soldstatus
ⓘ Source: listings_history table (triggers on properties + properties_extension) + one-shot
backfill from property_details.listing_events for pre-trigger history.
Tax reassessment forecast TX · Resets to sale price
- Current annual tax
- $306 · $25/mo
- Projected year-2 tax
- $2,361 · $197/mo
- Expected delta
- +$2,055/yr (+$171/mo · 672.3%)
ⓘ Screening estimate from a state-policy table — verify with the county assessor before closing.
Climate risk First Street
- Flood 1/10 Low FEMA zone X (unshaded) · 0% chance over 30 yrs
- Wildfire 5/10 Major
- Heat 7/10 Severe 7 d/yr ≥110°F today · 27 d/yr by 30 yrs out
- Wind 6/10 Major 67% chance of damaging wind over 30 yrs
- Air quality 2/10 Low 1 unhealthy d/yr today · 2 by 30 yrs out
Nearby sold comps map
Loading sold comps map…
Walkable amenities ~0.75 mi
Loading nearby amenities…
Taxation est. · year 1
- Rental income
- $14,400
- − Mortgage interest
- −$7,226
- − Property taxes
- −$306
- − Insurance
- −$645
- − Repairs & maintenance
- −$1,152
- − Management
- −$1,152
- − Depreciation
- −$3,753
- Taxable income
- $167
- Est. tax owed @ 24.0%
- −$40
- After-tax cash flow
- $2,267/yr
For passive investors: Depreciation is non-cash, so a rental often shows a tax loss while cash-flowing — sheltering income. Rental losses are passive: they offset passive income freely, and up to $25,000/yr can offset ordinary (W-2) income if you actively participate and your MAGI is under $100k (phasing out to $0 by $150k); unused losses carry forward. On sale, claimed depreciation is recaptured at up to 25%, and gains may owe capital-gains tax (a 1031 exchange can defer both). Figures are a year-1 estimate at your 24.0% rate — not tax advice; consult a CPA.
Condition & rehab AI · 12 photos
This recently remodeled manufactured home is in excellent condition with new flooring, cabinets, and appliances, making it a great investment property or primary residence.
Value-add opportunities
- Both Painting exterior and interior walls — Enhances curb appeal and interior aesthetics.
- Both Landscaping and curb appeal improvements — Improves property's visual appeal and marketability.
- Both Upgrading appliances — Modernizes the home and increases its value for both resale and rental purposes.
Renovation cost estimate screening
Value-add ROI direction
- Both Painting exterior and interior walls — Enhances curb appeal and interior aesthetics. ↑
- Both Landscaping and curb appeal improvements — Improves property's visual appeal and marketability. ↑
- Both Upgrading appliances — Modernizes the home and increases its value for both resale and rental purposes. ↑
ⓘ Cost ranges are severity-bucket heuristics (US national rule-of-thumb). Get contractor quotes + a written scope before underwriting a rehab budget.
Schools (NCES district)
No district data.
Livability — Gladewater
- Score
- 64/100
- State rank
- #805
- US rank
- #14670
Category grades
Schools grade is shown separately in the Schools card above.
Census & demographics
- Population (ZIP)
- 4,863
Population outlook (Upshur County) Hauer SSP2
- Today (2025)
- 42,771 people
- By 2030
- 43,788 · +2.4%
- By 2040
- 45,574 · +6.6%
- By 2050
- 46,683 · +9.1%
- By 2075
- 49,137 · +14.9%
- By 2100
- 47,457 · +11.0%
Race, ethnicity, and origin ACS 2023
- Neighborhood character
- Predominantly White (81%)
- Race & ethnicity
- White 81% Black 13% Hispanic / Latino 4% Two or more races 3%
- Common ancestry
- Serbian 5% Slovak 4% Italian 3%
- Foreign-born
- 4% · Canada
- Languages at home
- 97% English-only · Spanish 3%
Political lean MEDSL · Upshur
- 2024 margin
- Solid R (+71.0) · D 14.2% · R 85.2%
- 2008→2024 swing
- -22.0pp toward R · 2008: -49.0pp · 2024: -71.0pp
- All cycles
- 2024: R+71.0 2020: R+68.5 2016: R+68.0 2012: R+59.8 2008: R+49.0
Not yet ingested
- Civics
- —
Market trends
- HPI YoY
- ▼ -43.30%
- Current HPI
- 189.9675
- Rent YoY
- —
- Metro
- —
- State GDP YoY
- ▲ 3.95%
- F500 in state
- 110
Industry mix (Fortune 500 HQ in TX)
| Industry | F500 HQs | Revenue |
|---|---|---|
| Energy | 16 | $1,198B |
|
||
| Technology | 5 | $198B |
|
||
| Engineering / Construction | 4 | $72B |
|
||
| Energy Services | 3 | $60B |
|
||
| Utilities | 3 | $41B |
|
||
| Healthcare | 2 | $330B |
|
||
Price history
3 events — show timeline
- 2026-05-20 Pending — LAAR
- 2026-05-15 Listed $129,000 LAAR
- 2025-10-28 Sold (Public Records) — Public Records
Property tax history
+16.6%/yrLatest (2025): $306 · -1.8% YoY. Source: county tax records.
Cash-flow waterfall
monthlySold comps — $/sqft
last 12 mo · ≤1 miLoading sold comps…