232 E Calhoun St · Bruce, MS
Flood risk No data
- FEMA flood zone
- —
- Chance of flooding over 30 yrs
- —
- Est. flood insurance / yr
- —
Fire risk No data
- Est. fire insurance / yr
- —
Heat risk 7/10 · Major
- Hot days now (above threshold)
- 7 days/yr
- Hot days in 30 yrs
- 21 days/yr
Wind risk No data
- Chance of severe wind over 30 yrs
- —
Air-quality risk 2/10 · Minimal
- Unhealthy air days now
- 0 days/yr
- Unhealthy air days in 30 yrs
- 1 days/yr
Risk factors via First Street. Map © Google.
Why this score? — see what drove the B grade
The composite is a weighted blend of 9 inputs, each scored 0–100. Each bar is that input's sub-score; the figure is the points it added to the 100-point composite (weight × sub-score).
- Cash flow +30.0/30.0
- DSCR +10.0/10.0
- 1% rule +9.2/10.0
- ARV discount +7.5/15.0
- Appreciation +6.2/10.0
- Livability +3.2/5.0
- Rent growth +2.5/5.0
- Condition / age +2.5/5.0
- Schools +2.3/10.0
$96,000
🖨 Deal sheet 📄 Offer letter ✓ Due diligence
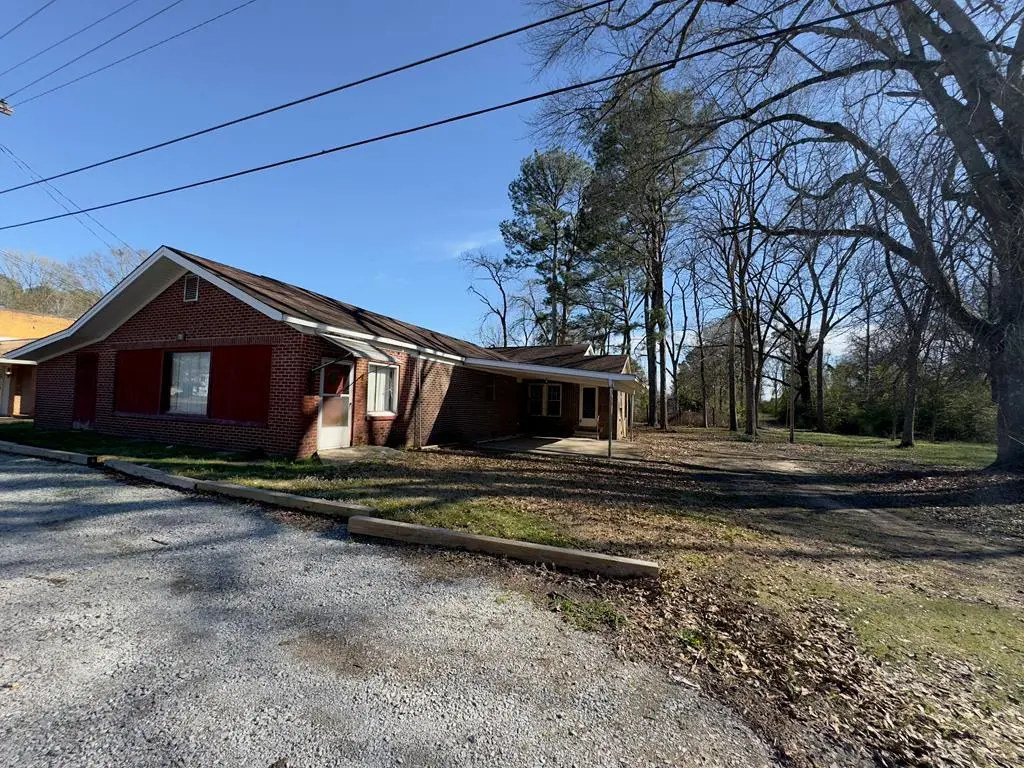
Listing remarks MLS
NEW ROOF ! Great opportunity to have investment property can be residential or commercial. Plenty of parking! Opportunities are endless for this property sitting on 2.6 ACRES
Key facts
- Plenty of parking
- 2.6 acres
- New roof
Tags
Neighborhood map
What this means for you Summary
Snapshot
- This is a 4-bed/3.0-bath single-family listed at $96k.
Deal economics
- At list price, monthly cash flow is $398 ($5k/yr) — positive.
- The deal already cash-flows at list — no discount required.
- Meets the 1% rule at list price ($1k rent vs $96k).
- Recommended offer: $84k (12.0% below list) — sets the bar for market timing.
Location & tenants
- Location reads 63/100 on livability (#147 in MS) — a middle-class / working-renter tenant base. Strengths: cost of living A+, housing A+; Watch: schools D+, health & safety D+, amenities F.
- Calhoun County School District (rural): math 28% / reading 29% proficiency, ranked #75 of 130 in MS (top 58%) — low school quality limits family demand, transient renter base, plan for 1-2y turnover; 69% free/reduced lunch — lower-income household profile, screen leases tightly.
- Market conditions: 25 active listings in the ZIP; 10 units permitted in Calhoun County in 2024 (0 in 5+ unit buildings).
Forward outlook
- In year one you build about $3k of equity ($664 loan paydown + $2k appreciation (2.4% local appreciation)).
- Calhoun County population projected at -19% by 2050 — secular population decline; favor cash flow + early exit over multi-decade hold.
- At projected returns (2.4% appreciation + 3.0% rent growth), your $27k cash investment doubles in ~4 years — after that, you're playing with house money.
Negotiation context
- It's been on market 141 days — a 12% lower offer ($84k) is reasonable based on typical stale-listing flexibility.
- 2 sale attempts since 2y ago with the ask held roughly flat each time — persistent listings suggest the price (not the market) is what's stuck; bring a comps-based counter.
Risks & watch-outs
- Watch-outs: built in 1955 — expect roof / HVAC / electrical / plumbing capex.
- Climate carrying-cost: extreme-heat days projected 7→21/yr by 2055 (HVAC capex compounding) — expect insurance premiums to compound above CPI over the hold.
Questions for the listing agent
- It's been on market 141 days. Have you received any prior offers? Is the seller open to a 12% concession, seller financing, or rate buy-down credit?
- Built in 1955 — when were the roof, HVAC, electrical panel, plumbing, and water heater last replaced?
- Why hasn't it sold? Are there any deal-killer items the seller is aware of (foundation, flood, title, zoning, code violations)?
- Is there a deadline driving the sale (1031 exchange, divorce, estate, relocation)? That informs how much negotiation room exists.
- Schools are D-rated, which usually means shorter tenancies and higher turnover. Who's the typical renter profile here, and what's been the actual vacancy rate?
- What's the average days-on-market for RENTAL listings here right now (not sales)? A rising rental-DOM trend means longer vacancies and softer asking-rent achievability than the comps imply.
- What's the recent tenant-quality profile in this submarket — average credit score on applications, eviction rate, late-payment / NSF rate, and stable-employment percentage? A property-management company in the area should have these aggregated.
- How much new for-sale + rental construction is in the pipeline within 1–3 miles? Heavy new supply typically softens prices + rents 12–24 months out; constrained supply supports both.
Investment metrics
- 1% rule
- 1.42% ✓
- Cap rate
- 11.27%
- Cash-on-cash
- 17.77%
- DSCR
- 1.79
- GRM
- 5.9
CMA / ARV
No comps found within radius.
Projected returns pro-forma
2.37% appreciation · 3.0% rent growth · sell at horizon
- IRR
- 22.9%
- Equity multiple
- 2.26×
- Total profit
- $33,805
- Equity at exit
- $39,827
- IRR
- 24.4%
- Equity multiple
- 4.31×
- Total profit
- $88,873
- Equity at exit
- $58,899
Cash invested: $26,880 (down + closing). Projections, not guarantees.
Landlord ↔ Tenant lean methodology
- Overall (STATE)
- 90 Strongly Landlord-Friendly
- State Mississippi
- 90 Strongly Landlord-Friendly · R+11
- County
- — inherits STATE
- City
- — inherits STATE
ZIP-level market 38915
- Home prices YoY
- 1.7%
- Active inventory
- 25
- Price-to-rent
- 5.9×
Monthly cashflow live
- Estimated rent
- $1,358 medium interval (Pro) →
- Mortgage (P&I)
- −$503
- Tax from tax record
- −$132 /mo · $1,580/yr
- Insurance
- −$40
- HOA
- −$0
- Vacancy / Maint / Mgmt
- −$285
- Net cashflow
- $398
Break-even live
UW: 25.0% down · 7.5% · 30yr · 1.5% tax · 5.0% vac · 8.0% maint · 8.0% mgmt
Financing live
Cash to close
- Down payment
- $24,000
- Closing costs
- $2,880
- Reserves months
- —
- Total cash needed
- —
Loan-product check · same deal, 3 products live
Conventional
25% down · 7.5% · 30yr
- Down + closing
- —
- Monthly P&I
- —
- Monthly cashflow
- —
- DSCR
- —
- Eligible?
- —
Personal DTI + credit; lowest rate.
DSCR
20% down · 8.5% · 30yr
- Down + closing
- —
- Monthly P&I
- —
- Monthly cashflow
- —
- DSCR
- —
- Eligible?
- —
No personal income docs; deal must DSCR.
Hard money
10% down · 12.0% · 12mo
- Down + closing
- —
- Monthly P&I
- —
- Monthly cashflow
- —
- DSCR
- —
- Eligible?
- —
Short-term bridge; refi at stabilization.
Listing history 18 events
-
2026-06-19days on market $96,000 Active 141 DOM
-
2026-06-18days on market $96,000 Active 140 DOM
-
2026-06-17days on market $96,000 Active 139 DOM
-
2026-06-16days on market $96,000 Active 138 DOM
-
2026-06-15days on market $96,000 Active 137 DOM
-
2026-06-14days on market $96,000 Active 135 DOM
-
2026-06-12days on market $96,000 Active 134 DOM
-
2026-06-09days on market $96,000 Active 131 DOM
-
2026-06-08days on market $96,000 Active 130 DOM
-
2026-06-07days on market $96,000 Active 129 DOM
-
2026-06-05days on market $96,000 Active 126 DOM
-
2026-06-02days on market $96,000 Active 124 DOM
-
2026-06-01days on market $96,000 Active 123 DOM
-
2026-05-31days on market $96,000 Active 122 DOM
-
2026-05-30days on market $96,000 Active 121 DOM
-
2026-01-29$96,000 Active 174-char remark
Show marketing remark (174 chars)
NEW ROOF ! Great opportunity to have investment property can be residential or commercial. Plenty of parking! Opportunities are endless for this property sitting on 2.6 ACRES
-
2024-04-03$105,000 Active
-
1959-06-11soldstatus
ⓘ Source: listings_history table (triggers on properties + properties_extension) + one-shot
backfill from property_details.listing_events for pre-trigger history.
Tax reassessment forecast MS · Resets to sale price
- Current annual tax
- $1,580 · $132/mo
- Projected year-2 tax
- $1,580 · $132/mo
- Expected delta
- $0/yr ($0/mo · 0.0%)
ⓘ Screening estimate from a state-policy table — verify with the county assessor before closing.
Climate risk First Street
- Heat 7/10 Severe
- Air quality 2/10 Low 0 unhealthy d/yr today · 1 by 30 yrs out
Nearby sold comps map
Loading sold comps map…
Walkable amenities ~0.75 mi
Loading nearby amenities…
Taxation est. · year 1
- Rental income
- $16,301
- − Mortgage interest
- −$5,377
- − Property taxes
- −$1,580
- − Insurance
- −$480
- − Repairs & maintenance
- −$1,304
- − Management
- −$1,304
- − Depreciation
- −$2,793
- Taxable income
- $3,463
- Est. tax owed @ 24.0%
- −$831
- After-tax cash flow
- $3,945/yr
For passive investors: Depreciation is non-cash, so a rental often shows a tax loss while cash-flowing — sheltering income. Rental losses are passive: they offset passive income freely, and up to $25,000/yr can offset ordinary (W-2) income if you actively participate and your MAGI is under $100k (phasing out to $0 by $150k); unused losses carry forward. On sale, claimed depreciation is recaptured at up to 25%, and gains may owe capital-gains tax (a 1031 exchange can defer both). Figures are a year-1 estimate at your 24.0% rate — not tax advice; consult a CPA.
Schools (NCES district)
- District
- Calhoun County School District
- NCES district ID
- 2800870
- Math proficiency
- 28% ▼ -12.00%
- Reading proficiency
- 29% ▼ -9.00%
- Median HH income
- $30,951
- Composite
- 23.14/100
- National rank
- #7952
- State rank
- #75 of 130 in MS
Livability — Bruce
- Score
- 63/100
- State rank
- #147
- US rank
- #15075
Category grades
Schools grade is shown separately in the Schools card above.
Census & demographics
- Census place
- Bruce, MS
- Population (ZIP)
- 3,186
Population outlook (Calhoun County) Hauer SSP2
- Today (2025)
- 14,108 people
- By 2030
- 13,650 · -3.2%
- By 2040
- 12,586 · -10.8%
- By 2050
- 11,417 · -19.1%
- By 2075
- 8,381 · -40.6%
- By 2100
- 5,478 · -61.2%
Race, ethnicity, and origin ACS 2023
- Neighborhood character
- Predominantly White (68%)
- Race & ethnicity
- White 68% Black 29% Two or more races 3%
- Common ancestry
- Italian 1%
Political lean MEDSL · Calhoun
- 2024 margin
- Solid R (+48.0) · D 25.6% · R 73.6%
- 2008→2024 swing
- -20.3pp toward R · 2008: -27.7pp · 2024: -48.0pp
- All cycles
- 2024: R+48.0 2020: R+41.3 2016: R+39.1 2012: R+27.3 2008: R+27.7
Not yet ingested
- Civics
- —
Market trends
- HPI YoY
- ▲ 2.37%
- Current HPI
- 143.4197
- Rent YoY
- —
- Metro
- —
- State GDP YoY
- —
- F500 in state
- 0
Price history
-8.6% since first listed3 events — show timeline
- 2026-01-29 Listed $96,000 NCMBR
- 2024-04-03 Listed $105,000 NCMBR
- 1959-06-11 Sold (Public Records) — Public Records
Property tax history
+2.0%/yrLatest (2025): $1,580 · +2.4% YoY. Source: county tax records.
Cash-flow waterfall
monthlySold comps — $/sqft
last 12 mo · ≤1 miLoading sold comps…