 🌊 Lakefront
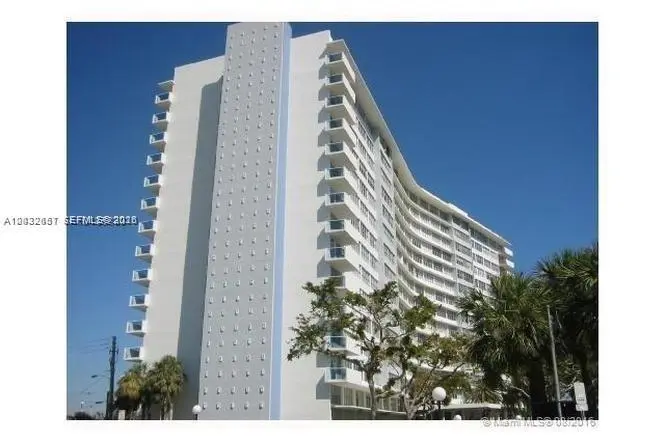
7441 Wayne Ave Unit 2O · Miami Beach, FL
Flood risk 10/10 · Severe
- FEMA flood zone
- AE
- Chance of flooding over 30 yrs
- 0.99%
- Est. flood insurance / yr
- $1,737 – $8,500
Fire risk 1/10 · Minimal
- Est. fire insurance / yr
- $947 – $1,759
Heat risk 10/10 · Severe
- Hot days now (above 103°F)
- 7 days/yr
- Hot days in 30 yrs
- 28 days/yr
Wind risk 10/10 · Severe
- Chance of severe wind over 30 yrs
- 99.0%
Air-quality risk 2/10 · Minimal
- Unhealthy air days now
- 1 days/yr
- Unhealthy air days in 30 yrs
- 2 days/yr
Risk factors via First Street. Map © Google.
Why this score? — see what drove the B grade
The composite is a weighted blend of 9 inputs, each scored 0–100. Each bar is that input's sub-score; the figure is the points it added to the 100-point composite (weight × sub-score).
- Cash flow +29.4/30.0
- 1% rule +10.0/10.0
- DSCR +10.0/10.0
- ARV discount +7.5/15.0
- Schools +4.2/10.0
- Livability +4.0/5.0
- Rent growth +2.6/5.0
- Condition / age +2.5/5.0
- Appreciation +0.0/10.0
$227,000
🖨 Deal sheet 📄 Offer letter ✓ Due diligence
Listing remarks MLS
APPROVED!! APPROVED!!APPROVED!!Beautiful unit in MIami Beach. This is ready to close at $73,000K CASH TO CLOSE. Porperty is vacant and APPROVED.
Key facts
- $721 HOA
- Garage
- Built 1964
Property features AI
Finance
- Financial info: Pets allowed
- HOA & community: Monthly association fee of $721; Association covers common areas, cable TV, hot water, insurance, internet, grounds maintenance, structure maintenance, parking, and pest control; Community amenities include bike storage, business center, laundry, storage, and elevators
Exterior
- Parking: One covered garage space; Garage door opener
- Security: Closed-circuit cameras; Complex fenced; Doorman; Key card entry
- Utilities: Water: available; Sewer: available; Power: available
- Home design: Attached property; Entry on level 2; 15-story building
- Construction: Block construction
- Exterior features: Security/high-impact doors; Canal-front waterfront; Has a view
Interior
- Kitchen: Electric range
- Flooring: Laminate flooring; Tile flooring
- Bathrooms: One full bathroom
- Heating & cooling: Central heating; Central air conditioning
- Interior features: Impact glass windows; Second floor entry; Elevator; Other interior features
- Laundry & utility: Laundry in common area
Neighborhood map
What this means for you Summary
Snapshot
- This is a 1-bed/1.0-bath condo listed at $227k.
Deal economics
- At list price, monthly cash flow is $377 ($5k/yr) — positive.
- The deal already cash-flows at list — no discount required.
- Meets the 1% rule at list price ($4k rent vs $227k).
- Cap rate 10.5% vs local median 1.5% in Miami Beach — top-decile yield for the area; either an underpriced asset or a hidden risk that comps aren't pricing in. Stress-test before assuming the spread holds.
Location & tenants
- Location reads 80/100 on livability (#108 in FL, #1,672 nationally) — a professional / high-income tenant draw. Strengths: crime A+, commute A+, health & safety A+; Watch: housing C-, amenities D-, cost of living F.
- Miami-Dade (suburban): math 45% / reading 54% proficiency, ranked #40 of 73 in FL (top 55%) — families likely to look elsewhere, expect single-tenant / working-renter base with shorter leases; 64% free/reduced lunch — lower-income household profile, screen leases tightly.
- Market conditions: Rents flat; 644 active listings in the ZIP; 10,051 units permitted in Miami-Dade County in 2024 (7,758 in 5+ unit buildings).
- At $3,854/mo this rent would consume 67% of the median local household income ($69k/yr) (locally 3521% of renters already pay >50% of income on rent) — very limited rent-growth headroom before tenants either downsize or default.
Forward outlook
- Local home prices are declining (-3.0%/yr); year-one equity from $2k of loan paydown is wiped out by about $7k of value loss. Plan a longer hold.
- Miami-Dade County population projected at +28% by 2050 — long-run rental-demand tailwind backs the buy-and-hold thesis.
Negotiation context
- Only 11 days on market — expect competitive offers; lowballing is unlikely to land.
- Current owner paid $65k; list at $227k implies a 249% gain — meaningful room to come down on a strong offer.
Risks & watch-outs
- Watch-outs: flood insurance adds $427/mo.
- Climate carrying-cost: in FEMA flood zone AE (mandatory federal flood insurance); severe wind risk, 99% chance of damaging wind over 30y; extreme-heat days projected 7→28/yr by 2055 (HVAC capex compounding) — expect insurance premiums to compound above CPI over the hold.
Questions for the listing agent
- Built in 1964 — when were the roof, HVAC, electrical panel, plumbing, and water heater last replaced?
- What's the actual annual flood-insurance premium (NFIP or private), and is the property in a SFHA with mandatory coverage?
- What does the HOA fee cover, when was the last increase, and are there any pending special assessments or reserve-fund shortfalls?
- Any open or pending special assessments — roof, HVAC, plumbing, elevator, façade? What's the per-unit balance and payoff schedule, and is the seller paying it off at close or rolling it to the buyer?
- Is there a deadline driving the sale (1031 exchange, divorce, estate, relocation)? That informs how much negotiation room exists.
- Schools are A-rated — typically a magnet for longer-tenancy family renters. What's the average tenant stay here, and is there a school-zone premium baked into asking?
- This sits on a lake — are riparian / water-frontage rights deeded with the parcel? Any dock permits, shoreline easements, or HOA water-use restrictions?
- What's the documented flood / surge / shoreline-erosion history here (FEMA AND non-FEMA — e.g., storm surge, creek backup, septic-field saturation)?
- Any water-quality or seasonal algae-bloom issues that affect tenant satisfaction or short-term-rental demand?
- What's the average days-on-market for RENTAL listings here right now (not sales)? A rising rental-DOM trend means longer vacancies and softer asking-rent achievability than the comps imply.
- What's the recent tenant-quality profile in this submarket — average credit score on applications, eviction rate, late-payment / NSF rate, and stable-employment percentage? A property-management company in the area should have these aggregated.
- How much new apartment / multifamily construction is in the pipeline within 1–3 miles? Heavy new supply (>2% of stock underway) typically softens rents 12–24 months out; light construction supports rent growth.
Investment metrics
- 1% rule
- 1.70% ✓
- Cap rate
- 10.54%
- Cash-on-cash
- 15.18%
- DSCR
- 1.68
- GRM
- 4.9
CMA / ARV
No comps found within radius.
Projected returns pro-forma
-3.0% appreciation · 0.44% rent growth · sell at horizon
- IRR
- -9.7%
- Equity multiple
- 0.66×
- Total profit
- $-21,697
- Equity at exit
- $33,846
- IRR
- -6.8%
- Equity multiple
- 0.64×
- Total profit
- $-22,702
- Equity at exit
- $19,627
Cash invested: $63,560 (down + closing). Projections, not guarantees.
Landlord ↔ Tenant lean methodology
- Overall (STATE)
- 87 Strongly Landlord-Friendly
- State Florida
- 87 Strongly Landlord-Friendly · R+3
- County
- — inherits STATE
- City
- — inherits STATE
ZIP-level market 33141
- Rents YoY
- 0.4%
- Active inventory
- 644
- Price-to-rent
- 4.9×
Monthly cashflow live
- Estimated rent
- $3,854 medium interval (Pro) →
- Mortgage (P&I)
- −$1,190
- Tax from tax record
- −$235 /mo · $2,816/yr
- Insurance
- −$95
- Flood insurance flood zone
- −$427 /mo · $5,118/yr
- HOA
- −$721
- Vacancy / Maint / Mgmt
- −$809
- Net cashflow
- $377
Break-even live
UW: 25.0% down · 7.5% · 30yr · 1.5% tax · 5.0% vac · 8.0% maint · 8.0% mgmt
Financing live
Cash to close
- Down payment
- $56,750
- Closing costs
- $6,810
- Reserves months
- —
- Total cash needed
- —
Loan-product check · same deal, 3 products live
Conventional
25% down · 7.5% · 30yr
- Down + closing
- —
- Monthly P&I
- —
- Monthly cashflow
- —
- DSCR
- —
- Eligible?
- —
Personal DTI + credit; lowest rate.
DSCR
20% down · 8.5% · 30yr
- Down + closing
- —
- Monthly P&I
- —
- Monthly cashflow
- —
- DSCR
- —
- Eligible?
- —
No personal income docs; deal must DSCR.
Hard money
10% down · 12.0% · 12mo
- Down + closing
- —
- Monthly P&I
- —
- Monthly cashflow
- —
- DSCR
- —
- Eligible?
- —
Short-term bridge; refi at stabilization.
HOA detail condo
- Monthly dues
- $721 · $8,652/yr
- Assessments
- None detected in remarks — confirm with the listing agent.
Listing history 8 events
-
2026-06-18days on market $227,000 Active 11 DOM
-
2026-06-17days on market $227,000 Active 10 DOM
-
2026-06-16days on market $227,000 Active 9 DOM
-
2026-06-15days on market $227,000 Active 8 DOM
-
2026-06-13days on market $227,000 Active 6 DOM
-
2026-06-09days on market $227,000 Active 2 DOM
-
2026-06-08remarks 699-char remark
-
2026-06-08$227,000 Active 1 DOM
ⓘ Source: listings_history table (triggers on properties + properties_extension) + one-shot
backfill from property_details.listing_events for pre-trigger history.
Tax reassessment forecast FL · Resets to sale price
- Current annual tax
- $2,816 · $235/mo
- Projected year-2 tax
- $2,816 · $235/mo
- Expected delta
- $0/yr ($0/mo · 0.0%)
ⓘ Screening estimate from a state-policy table — verify with the county assessor before closing.
Climate risk First Street
- Flood 10/10 Extreme FEMA zone AE · 99% chance over 30 yrs
- Wildfire 1/10 Low
- Heat 10/10 Extreme 7 d/yr ≥103°F today · 28 d/yr by 30 yrs out
- Wind 10/10 Extreme 99% chance of damaging wind over 30 yrs
- Air quality 2/10 Low 1 unhealthy d/yr today · 2 by 30 yrs out
Nearby sold comps map
Loading sold comps map…
Walkable amenities ~0.75 mi
Loading nearby amenities…
Taxation est. · year 1
- Rental income
- $46,246
- − Mortgage interest
- −$12,716
- − Property taxes
- −$2,816
- − Insurance
- −$6,254
- − Repairs & maintenance
- −$3,700
- − Management
- −$3,700
- − HOA
- −$8,652
- − Depreciation
- −$6,604
- Taxable income
- $1,806
- Est. tax owed @ 24.0%
- −$433
- After-tax cash flow
- $4,095/yr
For passive investors: Depreciation is non-cash, so a rental often shows a tax loss while cash-flowing — sheltering income. Rental losses are passive: they offset passive income freely, and up to $25,000/yr can offset ordinary (W-2) income if you actively participate and your MAGI is under $100k (phasing out to $0 by $150k); unused losses carry forward. On sale, claimed depreciation is recaptured at up to 25%, and gains may owe capital-gains tax (a 1031 exchange can defer both). Figures are a year-1 estimate at your 24.0% rate — not tax advice; consult a CPA.
Schools (NCES district)
- District
- Miami-Dade
- NCES district ID
- 1200390
- Math proficiency
- 45% ▼ -16.00%
- Reading proficiency
- 54% ▼ -5.00%
- Median HH income
- $43,928
- Composite
- 41.76/100
- National rank
- #3397
- State rank
- #40 of 73 in FL
Livability — Miami Beach
- Score
- 80/100
- State rank
- #108
- US rank
- #1672
Category grades
Schools grade is shown separately in the Schools card above.
Census & demographics
- Census place
- Miami Beach, FL
- County
- Miami-Dade County · 2,697,751 people
- City population
- 90,533
- Metro
- Miami-Fort Lauderdale-Pompano Beach, FL
- Population (ZIP)
- 36,438
- Household income
- $68,738
- Rent vs Own
- Severe rent burden
- 3521.0
Population outlook (Miami-Dade County) Hauer SSP2
- Today (2025)
- 3,126,439 people
- By 2030
- 3,325,765 · +6.4%
- By 2040
- 3,697,561 · +18.3%
- By 2050
- 4,012,134 · +28.3%
- By 2075
- 4,605,612 · +47.3%
- By 2100
- 4,866,598 · +55.7%
Race, ethnicity, and origin ACS 2023
- Neighborhood character
- Predominantly Hispanic (67%)
- Race & ethnicity
- Hispanic / Latino 67% Two or more races 36% White 20% Black 4% Asian 3%
- Hispanic origin (detail)
- Mexican 1% Puerto Rican 3% Cuban 27% Salvadoran 6%
- Common ancestry
- Scotch-Irish 2% Romanian 2% Armenian 1%
- Foreign-born
- 62% · Canada, Jamaica, Dominican Republic
- Languages at home
- 18% English-only · Spanish 69% Other Indo-European 4% French/Haitian/Cajun 3%
Political lean MEDSL · Miami-Dade
- 2024 margin
- R (+11.4) · D 43.9% · R 55.4%
- 2008→2024 swing
- -27.6pp toward R · 2008: 16.1pp · 2024: -11.4pp
- All cycles
- 2024: R+11.4 2020: D+7.3 2016: D+29.6 2012: D+23.7 2008: D+16.1
Not yet ingested
- Civics
- —
Market trends
- HPI YoY
- ▼ -472.71%
- Current HPI
- 336.7298
- Rent YoY
- ▲ 0.44%
- Metro
- Miami-Fort Lauderdale-Pompano Beach, FL
- State GDP YoY
- ▲ 3.28%
- F500 in state
- 36
Industry mix (Fortune 500 HQ in FL)
| Industry | F500 HQs | Revenue |
|---|---|---|
| Industrial Technology | 2 | $29B |
|
||
| Insurance | 2 | $17B |
|
||
| Retail | 1 | $60B |
|
||
| Technology Distribution | 1 | $58B |
|
||
| Homebuilding | 1 | $35B |
|
||
| Technology Manufacturing | 1 | $35B |
|
||
Price history
+354.0% since first listed5 events — show timeline
- 2026-06-07 Listed $227,000 MARMLS
- 2011-11-01 Sold (MLS) $65,000 MARMLS
- 2004-08-06 Sold (Public Records) $128,000 Public Records
- 2002-06-20 Sold (Public Records) $83,500 Public Records
- 1994-03-25 Sold (Public Records) $50,000 Public Records
Property tax history
+6.5%/yrLatest (2025): $2,816 · -1.8% YoY. Source: county tax records.
Cash-flow waterfall
monthlySold comps — $/sqft
last 12 mo · ≤1 miLoading sold comps…