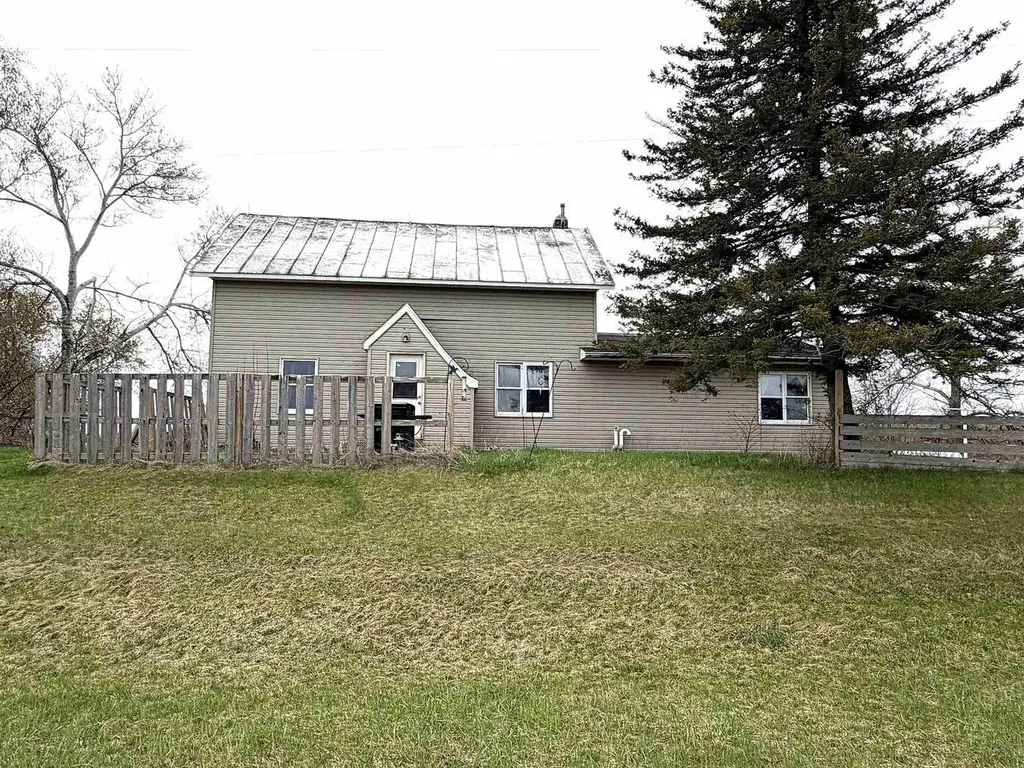
W4663 Woodlund Rd · Peshtigo, WI
Flood risk 4/10 · Minor
- FEMA flood zone
- X
- Chance of flooding over 30 yrs
- 0.2%
- Est. flood insurance / yr
- $473 – $860
Fire risk 1/10 · Minimal
- Est. fire insurance / yr
- $636 – $1,182
Heat risk 1/10 · Minimal
- Hot days now (above 93°F)
- 7 days/yr
- Hot days in 30 yrs
- 13 days/yr
Wind risk 1/10 · Minimal
- Chance of severe wind over 30 yrs
- —
Air-quality risk 2/10 · Minimal
- Unhealthy air days now
- 0 days/yr
- Unhealthy air days in 30 yrs
- 1 days/yr
Risk factors via First Street. Map © Google.
Why this score? — see what drove the B- grade
The composite is a weighted blend of 9 inputs, each scored 0–100. Each bar is that input's sub-score; the figure is the points it added to the 100-point composite (weight × sub-score).
- Cash flow +30.0/30.0
- 1% rule +10.0/10.0
- DSCR +10.0/10.0
- ARV discount +7.5/15.0
- Livability +3.5/5.0
- Schools +2.6/10.0
- Rent growth +2.5/5.0
- Condition / age +2.5/5.0
- Appreciation +0.0/10.0
$59,900
🖨 Deal sheet (PDF) 📄 Offer letter ✓ Due diligence
Listing remarks MLS
Large country home priced to sell, a little bit of work could make this a nice home. Being sold 'As Is'.
Key facts
- Nicely sized kitchen
- Outbuilding
- Rural setting
Tags
Property features AI
Finance
- Other: Stove and any items left on site will be included; sellers' personal belongings excluded
Exterior
- Utilities: Well water (and other — see remarks); Sewer: other (see remarks)
- Home design: 1.5-story single-family home; Construction completed
- Construction: Finished above grade area approximately 2,260 (estimate); No finished below-grade living area
- Exterior features: Vinyl exterior; Property includes silo(s); Approximately 2.08 acres; Zoned residential
Interior
- Kitchen: Kitchen on main level, 13 x 17; Range/Oven included
- Bedrooms: Main-level primary bedroom, 11 x 21; Main-level bedroom, 10 x 13; Upper-level bedroom, 10 x 13; Upper-level bedroom, 10 x 16; Upper-level bedroom, 11 x 13
- Bathrooms: One full bathroom
- Heating & cooling: Forced air heating; Electric and LP gas fuel
- Interior features: Partial basement with block and stone walls; Bonus room over the garage (8 x 11)
Neighborhood map
What this means for you Summary
Snapshot
- This is a 5-bed/1.0-bath single-family listed at $60k.
Deal economics
- At list price, monthly cash flow is $477 ($6k/yr) — positive.
- The deal already cash-flows at list — no discount required.
- Meets the 1% rule at list price ($1k rent vs $60k).
- Recommended offer: $58k (3.0% below list) — sets the bar for market timing.
- Cap rate 15.9% vs local median 2.6% in Peshtigo — top-decile yield for the area; either an underpriced asset or a hidden risk that comps aren't pricing in. Stress-test before assuming the spread holds.
Location & tenants
- Location reads 69/100 on livability (#348 in WI) — a middle-class / working-renter tenant base. Strengths: crime A+, cost of living A+, housing A+; Watch: amenities F, commute F.
- Peshtigo School District (town): math 28% / reading 30% proficiency, ranked #283 of 342 in WI (top 83%) — low school quality limits family demand, transient renter base, plan for 1-2y turnover.
- Zoned schools: Peshtigo Elementary (math 37% / reading 35%, grade F, #607 of 1,041 statewide, top 58%, 573 students, 40% FRL); Peshtigo Middle (math 17% / reading 22%, grade F, #347 of 383 statewide, top 92%, 167 students, 32% FRL); Peshtigo High (math 17% / reading 27%, grade F, #349 of 483 statewide, top 75%, 339 students, 28% FRL) — zoned schools at 34% FRL track the district average.
- Market conditions: 18 active listings in the ZIP; 145 units permitted in Marinette County in 2024 (0 in 5+ unit buildings).
Forward outlook
- Local home prices are declining (-3.0%/yr); year-one equity from $414 of loan paydown is wiped out by about $2k of value loss. Plan a longer hold.
- Marinette County population projected at -26% by 2050 — secular population decline; favor cash flow + early exit over multi-decade hold.
- At projected returns (-3.0% appreciation + 3.0% rent growth), your $17k cash investment doubles in ~4 years — after that, you're playing with house money.
Negotiation context
- It's been on market 49 days — a 3% lower offer ($58k) is reasonable based on typical stale-listing flexibility.
- Current owner paid $50k; 20% above their basis — modest negotiation headroom, anchor on the comps not their cost.
Risks & watch-outs
- Watch-outs: property tax is 2.8% of price; built in 1900 — expect roof / HVAC / electrical / plumbing capex.
Questions for the listing agent
- It's been on market 49 days. Have you received any prior offers? Is the seller open to a 3% concession, seller financing, or rate buy-down credit?
- Built in 1900 — when were the roof, HVAC, electrical panel, plumbing, and water heater last replaced?
- Property tax is high relative to price — has the assessment been appealed recently, and will the sale trigger a re-assessment?
- Is there a deadline driving the sale (1031 exchange, divorce, estate, relocation)? That informs how much negotiation room exists.
- Schools are D-rated, which usually means shorter tenancies and higher turnover. Who's the typical renter profile here, and what's been the actual vacancy rate?
- What's the average days-on-market for RENTAL listings here right now (not sales)? A rising rental-DOM trend means longer vacancies and softer asking-rent achievability than the comps imply.
- What's the recent tenant-quality profile in this submarket — average credit score on applications, eviction rate, late-payment / NSF rate, and stable-employment percentage? A property-management company in the area should have these aggregated.
- How much new for-sale + rental construction is in the pipeline within 1–3 miles? Heavy new supply typically softens prices + rents 12–24 months out; constrained supply supports both.
Investment metrics
- 1% rule
- 2.02% ✓
- Cap rate
- 15.85%
- Cash-on-cash
- 34.14%
- DSCR
- 2.52
- GRM
- 4.1
CMA / ARV
No comps found within radius.
Projected returns pro-forma
-3.0% appreciation · 3.0% rent growth · sell at horizon
- IRR
- 29.6%
- Equity multiple
- 2.24×
- Total profit
- $20,739
- Equity at exit
- $8,931
- IRR
- 36.9%
- Equity multiple
- 4.42×
- Total profit
- $57,423
- Equity at exit
- $5,179
Cash invested: $16,772 (down + closing). Projections, not guarantees.
Landlord ↔ Tenant lean methodology
- Overall (STATE)
- 73 Landlord-Friendly
- State Wisconsin
- 73 Landlord-Friendly · R+2
- County
- — inherits STATE
- City
- — inherits STATE
ZIP-level market 54157
- Active inventory
- 18
- Price-to-rent
- 4.1×
Monthly cashflow live
- Estimated rent
- $1,210 medium interval (Pro) →
- Mortgage (P&I)
- −$314
- Tax from tax record
- −$139 /mo · $1,674/yr
- Insurance
- −$25
- HOA
- −$0
- Vacancy / Maint / Mgmt
- −$254
- Net cashflow
- $477
Break-even live
Sensitivity live
| Price | -10% $511 | -5% $494 | +0% $477 | +5% $460 | +10% $443 |
|---|---|---|---|---|---|
| Rent | -10% $382 | -5% $429 | +0% $477 | +5% $525 | +10% $573 |
| Rate | -1.0pp $507 | -0.5pp $492 | base $477 | +0.5pp $462 | +1.0pp $446 |
UW: 25.0% down · 7.5% · 30yr · 1.5% tax · 5.0% vac · 8.0% maint · 8.0% mgmt
Financing live
Cash to close
- Down payment
- $14,975
- Closing costs
- $1,797
- Reserves months
- —
- Total cash needed
- —
Loan-product check · same deal, 3 products live
Conventional
25% down · 7.5% · 30yr
- Down + closing
- —
- Monthly P&I
- —
- Monthly cashflow
- —
- DSCR
- —
- Eligible?
- —
Personal DTI + credit; lowest rate.
DSCR
20% down · 8.5% · 30yr
- Down + closing
- —
- Monthly P&I
- —
- Monthly cashflow
- —
- DSCR
- —
- Eligible?
- —
No personal income docs; deal must DSCR.
Hard money
10% down · 12.0% · 12mo
- Down + closing
- —
- Monthly P&I
- —
- Monthly cashflow
- —
- DSCR
- —
- Eligible?
- —
Short-term bridge; refi at stabilization.
Listing history 18 events
-
2026-06-19days on market $59,900 Active 49 DOM
-
2026-06-18days on market $59,900 Active 48 DOM
-
2026-06-17days on market $59,900 Active 47 DOM
-
2026-06-16days on market $59,900 Active 46 DOM
-
2026-06-15days on market $59,900 Active 45 DOM
-
2026-06-14days on market $59,900 Active 43 DOM
-
2026-06-12days on market $59,900 Active 42 DOM
-
2026-06-09days on market $59,900 Active 39 DOM
-
2026-06-08days on market $59,900 Active 38 DOM
-
2026-06-07days on market $59,900 Active 37 DOM
-
2026-06-05days on market $59,900 Active 35 DOM
-
2026-06-04days on market $59,900 Active 33 DOM
-
2026-06-02days on market $59,900 Active 32 DOM
-
2026-06-01days on market $59,900 Active 31 DOM
-
2026-05-31days on market $59,900 Active 30 DOM
-
2026-05-31days on market $59,900 Active 29 DOM
-
2026-05-01$64,900 Active 841-char remark
-
2008-05-23soldstatus $49,900 104-char remark
Show marketing remark (104 chars)
Large country home priced to sell, a little bit of work could make this a nice home. Being sold 'As Is'.
ⓘ Source: listings_history table (triggers on properties + properties_extension) + one-shot
backfill from property_details.listing_events for pre-trigger history.
Tax reassessment forecast WI · Partial reset (capped growth)
- Current annual tax
- $1,674 · $139/mo
- Projected year-2 tax
- $1,674 · $139/mo
- Expected delta
- $0/yr ($0/mo · 0.0%)
ⓘ Screening estimate from a state-policy table — verify with the county assessor before closing.
Climate risk First Street
- Flood 4/10 Moderate FEMA zone X · 20% chance over 30 yrs
- Wildfire 1/10 Low
- Heat 1/10 Low 7 d/yr ≥93°F today · 13 d/yr by 30 yrs out
- Wind 1/10 Low
- Air quality 2/10 Low 0 unhealthy d/yr today · 1 by 30 yrs out
Nearby sold comps map
Loading sold comps map…
Walkable amenities ~0.75 mi
Loading nearby amenities…
Taxation est. · year 1
- Rental income
- $14,516
- − Mortgage interest
- −$3,355
- − Property taxes
- −$1,674
- − Insurance
- −$300
- − Repairs & maintenance
- −$1,161
- − Management
- −$1,161
- − Depreciation
- −$1,743
- Taxable income
- $5,123
- Est. tax owed @ 24.0%
- −$1,229
- After-tax cash flow
- $4,496/yr
For passive investors: Depreciation is non-cash, so a rental often shows a tax loss while cash-flowing — sheltering income. Rental losses are passive: they offset passive income freely, and up to $25,000/yr can offset ordinary (W-2) income if you actively participate and your MAGI is under $100k (phasing out to $0 by $150k); unused losses carry forward. On sale, claimed depreciation is recaptured at up to 25%, and gains may owe capital-gains tax (a 1031 exchange can defer both). Figures are a year-1 estimate at your 24.0% rate — not tax advice; consult a CPA.
Schools (NCES district)
- District
- Peshtigo School District
- NCES district ID
- 5511610
- Math proficiency
- 28% ▼ -4.00%
- Reading proficiency
- 30% ▼ -6.00%
- Median HH income
- $51,344
- Composite
- 25.5/100
- National rank
- #7440
- State rank
- #283 of 342 in WI
Livability — Peshtigo
- Score
- 69/100
- State rank
- #348
- US rank
- #8882
Category grades
Schools grade is shown separately in the Schools card above.
Census & demographics
- Population (ZIP)
- 6,044
Population outlook (Marinette County) Hauer SSP2
- Today (2025)
- 38,716 people
- By 2030
- 37,015 · -4.4%
- By 2040
- 32,824 · -15.2%
- By 2050
- 28,502 · -26.4%
- By 2075
- 20,562 · -46.9%
- By 2100
- 15,072 · -61.1%
Race, ethnicity, and origin ACS 2023
- Neighborhood character
- Predominantly White (95%)
- Race & ethnicity
- White 95% Two or more races 3% Hispanic / Latino 2%
- Common ancestry
- Romanian 13% Lithuanian 8% Portuguese 3%
- Foreign-born
- 1% · Canada
- Languages at home
- 97% English-only · Spanish 2%
Political lean MEDSL · Marinette
- 2024 margin
- Solid R (+38.0) · D 30.4% · R 68.4% · Other 1.1%
- 2008→2024 swing
- -44.9pp toward R · 2008: 6.9pp · 2024: -38.0pp
- All cycles
- 2024: R+38.0 2020: R+34.5 2016: R+33.8 2012: R+3.6 2008: D+6.9
Not yet ingested
- Civics
- —
Market trends
- HPI YoY
- ▼ -110.47%
- Current HPI
- 191.5577
- Rent YoY
- —
- Metro
- —
- State GDP YoY
- ▲ 2.10%
- F500 in state
- 20
Industry mix (Fortune 500 HQ in WI)
| Industry | F500 HQs | Revenue |
|---|---|---|
| Industrial Machinery | 4 | $23B |
|
||
| Industrial Technology | 2 | $36B |
|
||
| Insurance | 1 | $36B |
|
||
| Professional Services | 1 | $19B |
|
||
| Utilities | 1 | $9B |
|
||
| Consumer Goods | 1 | $3B |
|
||
Price history
+20.0% since first listed3 events — show timeline
- 2026-05-19 Price Changed $59,900 RANW
- 2026-05-01 Listed $64,900 RANW
- 2008-05-23 Sold (MLS) $49,900 METROMLS
Property tax history
+1.6%/yrLatest (2025): $1,674 · -4.1% YoY. Source: county tax records.
Cash-flow waterfall
monthlySold comps — $/sqft
last 12 mo · ≤1 miLoading sold comps…