 Duplex
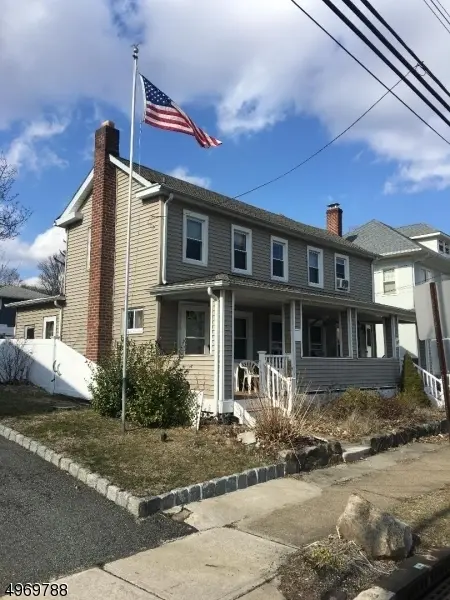
522 & 524 Boonton Ave · Boonton, NJ
Flood risk 1/10 · Minimal
- FEMA flood zone
- X
- Chance of flooding over 30 yrs
- 0.0%
- Est. flood insurance / yr
- $507 – $1,088
Fire risk 3/10 · Minor
- Est. fire insurance / yr
- $526 – $976
Heat risk 5/10 · Moderate
- Hot days now (above 99°F)
- 7 days/yr
- Hot days in 30 yrs
- 15 days/yr
Wind risk 6/10 · Moderate
- Chance of severe wind over 30 yrs
- 27.0%
Air-quality risk 3/10 · Minor
- Unhealthy air days now
- 2 days/yr
- Unhealthy air days in 30 yrs
- 3 days/yr
Risk factors via First Street. Map © Google.
Why this score? — see what drove the C- grade
The composite is a weighted blend of 9 inputs, each scored 0–100. Each bar is that input's sub-score; the figure is the points it added to the 100-point composite (weight × sub-score).
- Cash flow +18.2/30.0
- ARV discount +7.5/15.0
- DSCR +5.7/10.0
- Appreciation +5.0/10.0
- 1% rule +4.9/10.0
- Livability +4.0/5.0
- Schools +3.3/10.0
- Rent growth +2.5/5.0
- Condition / age +2.5/5.0
$699,900
🖨 Deal sheet 📄 Offer letter ✓ Due diligence
Multi-family units
County records classify this as Multi-Family (2-4 Unit). Listing-text estimate: 2 units. confirmed
Listing remarks
Fantastic investment opportunity in the heart of Boonton! This beautifully updated side-by-side duplex offers the perfect blend of timeless charm and modern convenience ideal for investors or owner-occupants alike. Each unit showcases stunning, fully renovated kitchens and baths, thoughtfully designed with today's finishes and functionality in mind. Rich hardwood floors flow throughout, adding warmth and character, while the inviting covered front porch provides the perfect place to relax and unwind. Step out back to a private, beautifully appointed patio space perfect for entertaining or enjoying quiet outdoor moments. The property also features ample off-street parking, a rare and valuabl
Key facts
- Covered front porch
- Rich hardwood floors
- Private patio space
Tags
Neighborhood map
What this means for you Summary
Snapshot
- This is a 2 × 3-bed/3.0-bath units multifamily listed at $700k.
Deal economics
- At list price, monthly cash flow is $629 ($8k/yr) — positive. Per door: $315/mo.
- The deal already cash-flows at list — no discount required.
- To meet the 1% rule (rent ≥ 1% of price), the offer needs to be $692k (1.1% below list).
- Recommended offer: $692k (1.1% below list) — sets the bar for 1% rule.
Location & tenants
- Location reads 81/100 on livability (#58 in NJ, #1,511 nationally) — a professional / high-income tenant draw. Strengths: crime A+, commute A+, employment A+; Watch: cost of living F.
- Boonton Town School District (suburban): math 20% / reading 50% proficiency, ranked #255 of 472 in NJ (top 54%) — families likely to look elsewhere, expect single-tenant / working-renter base with shorter leases.
- Zoned schools: School Street School (298 students, 31% FRL); Boonton High School (math 20% / reading 47%, grade F, #251 of 399 statewide, top 64%, 662 students, 28% FRL) — zoned schools at 29% FRL track the district average.
- Market conditions: 1 active listings in the ZIP; 2,357 units permitted in Morris County in 2024 (1,496 in 5+ unit buildings).
Forward outlook
- In year one you build about $26k of equity ($5k loan paydown + $21k appreciation (3.0% local appreciation)).
- Morris County population projected at +6% by 2050 — modest demand growth; plan on rents tracking national, not racing it.
- At projected returns (3.0% appreciation + 3.0% rent growth), your $196k cash investment doubles in ~6 years — after that, you're playing with house money.
- By year 2, paydown + projected appreciation supports a ~$42k cash-out refi (75% LTV) — recoverable capital for the next deal without selling this one.
Negotiation context
- Only 12 days on market — expect competitive offers; lowballing is unlikely to land.
- 2 sale attempts since 6y ago with the ask held roughly flat each time — persistent listings suggest the price (not the market) is what's stuck; bring a comps-based counter.
- Current owner paid $335k; list at $700k implies a 109% gain — meaningful room to come down on a strong offer.
Risks & watch-outs
- Watch-outs: built in 1880 — expect roof / HVAC / electrical / plumbing capex.
- Climate carrying-cost: major wind risk, 27% chance of damaging wind over 30y; extreme-heat days projected 7→15/yr by 2055 (HVAC capex compounding) — expect insurance premiums to compound above CPI over the hold.
Questions for the listing agent
- Can we see the unit-by-unit rent roll, current vacancy, and any below-market leases? What's the average tenancy length?
- What capital expenditures (roof, boiler, parking lot, exteriors) have been made in the last 5 years, and what's planned in the next 2?
- Built in 1880 — when were the roof, HVAC, electrical panel, plumbing, and water heater last replaced?
- Is there a deadline driving the sale (1031 exchange, divorce, estate, relocation)? That informs how much negotiation room exists.
- Schools are A-rated — typically a magnet for longer-tenancy family renters. What's the average tenant stay here, and is there a school-zone premium baked into asking?
- What's the average days-on-market for RENTAL listings here right now (not sales)? A rising rental-DOM trend means longer vacancies and softer asking-rent achievability than the comps imply.
- What's the recent tenant-quality profile in this submarket — average credit score on applications, eviction rate, late-payment / NSF rate, and stable-employment percentage? A property-management company in the area should have these aggregated.
- How much new apartment / multifamily construction is in the pipeline within 1–3 miles? Heavy new supply (>2% of stock underway) typically softens rents 12–24 months out; light construction supports rent growth.
Investment metrics
- 1% rule
- 0.99% ✗
- Cap rate
- 7.37%
- Cash-on-cash
- 3.85%
- DSCR
- 1.17
- GRM
- 8.4
CMA / ARV
No comps found within radius.
Show comp detail 1 sale within ~0.75 mi
| Address | Dist | Beds/Ba | Sqft | Sold | Price | $/sf | Match |
|---|---|---|---|---|---|---|---|
| 25 Cooper Dr | 0.40mi | 6/3.0 | — | 13mo | $850,000 | — | 46 |
Match score weights: distance 35% · size 25% · config 20% · recency 20%. Top-matched comps best support the ARV.
Projected returns pro-forma
3.0% appreciation · 3.0% rent growth · sell at horizon
- IRR
- 11.1%
- Equity multiple
- 1.64×
- Total profit
- $124,489
- Equity at exit
- $314,705
- IRR
- 13.3%
- Equity multiple
- 2.98×
- Total profit
- $387,263
- Equity at exit
- $484,998
Cash invested: $195,972 (down + closing). Projections, not guarantees.
Landlord ↔ Tenant lean methodology
- Overall (STATE)
- 21 Tenant-Leaning
- State New Jersey
- 21 Tenant-Leaning · D+6
- County
- — inherits STATE
- City
- — inherits STATE
ZIP-level market 07005-1510
- Active inventory
- 1
- Price-to-rent
- 16.9×
Monthly cashflow live
- Estimated rent
- $6,919 high interval (Pro) →
- Mortgage (P&I)
- −$3,670
- Tax est. 1.5%
- −$875 /mo · $10,498/yr
- Insurance
- −$292
- HOA
- −$0
- Vacancy / Maint / Mgmt
- −$1,453
- Net cashflow
- $629
Break-even live
2-unit breakdown (identical units grouped — click to expand)
| Units | Beds | Baths | Est. rent |
|---|---|---|---|
| 2× units | 3 | 3 | $6,918 |
| #1 | 3 | 3 | $3,459 |
| #2 | 3 | 3 | $3,459 |
| Total (2 units) | $6,919 | ||
UW: 25.0% down · 7.5% · 30yr · 1.5% tax · 5.0% vac · 8.0% maint · 8.0% mgmt
Financing live
Cash to close
- Down payment
- $174,975
- Closing costs
- $20,997
- Reserves months
- —
- Total cash needed
- —
Loan-product check · same deal, 3 products live
Conventional
25% down · 7.5% · 30yr
- Down + closing
- —
- Monthly P&I
- —
- Monthly cashflow
- —
- DSCR
- —
- Eligible?
- —
Personal DTI + credit; lowest rate.
DSCR
20% down · 8.5% · 30yr
- Down + closing
- —
- Monthly P&I
- —
- Monthly cashflow
- —
- DSCR
- —
- Eligible?
- —
No personal income docs; deal must DSCR.
Hard money
10% down · 12.0% · 12mo
- Down + closing
- —
- Monthly P&I
- —
- Monthly cashflow
- —
- DSCR
- —
- Eligible?
- —
Short-term bridge; refi at stabilization.
Listing history 5 events
-
2026-04-08status Under Contract
-
2026-03-27$699,900 Active
-
2020-05-12soldstatus $335,000 Sold
-
2020-03-20historical
-
2020-03-09$329,900 Active
ⓘ Source: listings_history table (triggers on properties + properties_extension) + one-shot
backfill from property_details.listing_events for pre-trigger history.
Climate risk First Street
- Flood 1/10 Low FEMA zone X · 0% chance over 30 yrs
- Wildfire 3/10 Moderate
- Heat 5/10 Major 7 d/yr ≥99°F today · 15 d/yr by 30 yrs out
- Wind 6/10 Major 27% chance of damaging wind over 30 yrs
- Air quality 3/10 Moderate 2 unhealthy d/yr today · 3 by 30 yrs out
Nearby sold comps map
Loading sold comps map…
Walkable amenities ~0.75 mi
Loading nearby amenities…
Taxation est. · year 1
- Rental income
- $83,028
- − Mortgage interest
- −$39,205
- − Property taxes
- −$10,498
- − Insurance
- −$3,500
- − Repairs & maintenance
- −$6,642
- − Management
- −$6,642
- − Depreciation
- −$20,361
- Taxable loss
- −$3,820
- Est. tax savings @ 24.0%
- +$917
- After-tax cash flow
- $8,467/yr
For passive investors: Depreciation is non-cash, so a rental often shows a tax loss while cash-flowing — sheltering income. Rental losses are passive: they offset passive income freely, and up to $25,000/yr can offset ordinary (W-2) income if you actively participate and your MAGI is under $100k (phasing out to $0 by $150k); unused losses carry forward. On sale, claimed depreciation is recaptured at up to 25%, and gains may owe capital-gains tax (a 1031 exchange can defer both). Figures are a year-1 estimate at your 24.0% rate — not tax advice; consult a CPA.
Schools (NCES district)
- District
- Boonton Town School District
- NCES district ID
- 3401950
- Math proficiency
- 20% ▼ -34.00%
- Reading proficiency
- 50% ▼ -12.00%
- Median HH income
- $83,957
- Composite
- 33.47/100
- National rank
- #5453
- State rank
- #255 of 472 in NJ
Livability — Boonton
- Score
- 81/100
- State rank
- #58
- US rank
- #1511
Category grades
Schools grade is shown separately in the Schools card above.
Census & demographics
- Census place
- Boonton, NJ
Population outlook (Morris County) Hauer SSP2
- Today (2025)
- 516,747 people
- By 2030
- 524,603 · +1.5%
- By 2040
- 539,582 · +4.4%
- By 2050
- 548,986 · +6.2%
- By 2075
- 571,326 · +10.6%
- By 2100
- 561,122 · +8.6%
Not yet ingested
- Political lean
- —
- Race & ethnicity
- —
- Common origin
- —
- Civics
- —
Market trends
- HPI YoY
- —
- Current HPI
- —
- Rent YoY
- —
- Metro
- —
- State GDP YoY
- ▲ 2.05%
- F500 in state
- 34
Industry mix (Fortune 500 HQ in NJ)
| Industry | F500 HQs | Revenue |
|---|---|---|
| Consumer Goods | 3 | $31B |
|
||
| Pharmaceuticals | 2 | $153B |
|
||
| Technology | 2 | $21B |
|
||
| Insurance | 2 | $20B |
|
||
| Healthcare | 2 | $19B |
|
||
| Financial Services | 1 | $70B |
|
||
Price history
+112.2% since first listed5 events — show timeline
- 2026-04-08 Pending — GSMLS
- 2026-03-27 Listed $699,900 GSMLS
- 2020-05-12 Sold (MLS) $335,000 GSMLS
- 2020-03-20 Delisted — GSMLS
- 2020-03-09 Listed $329,900 GSMLS
Cash-flow waterfall
monthlySold comps — $/sqft
last 12 mo · ≤1 miLoading sold comps…