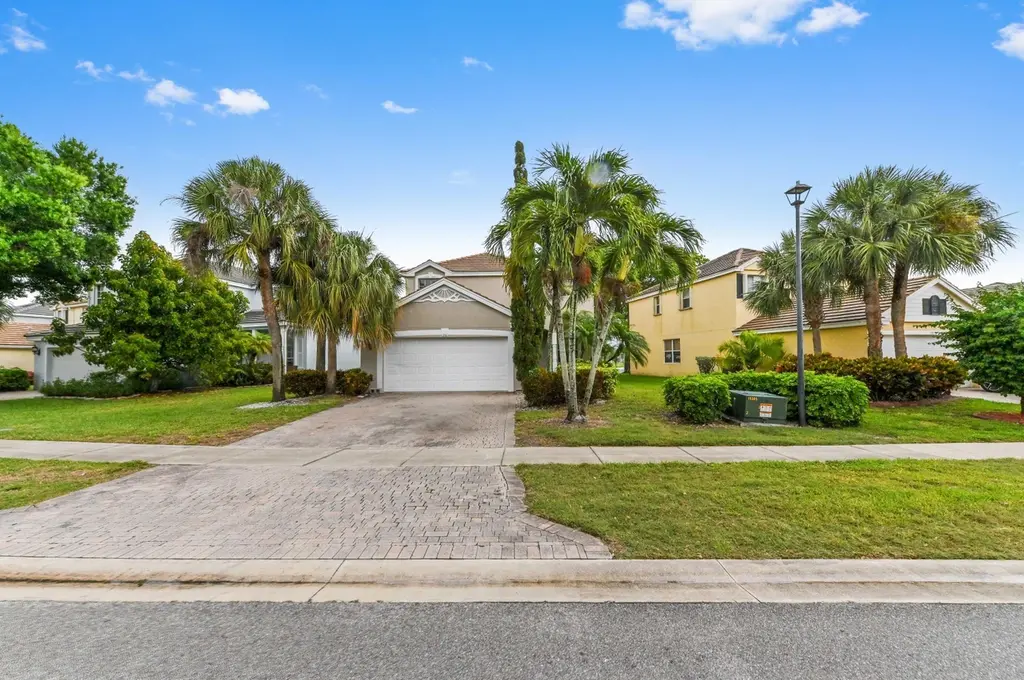
116 Hamilton Ter · Royal Palm Beach, FL
Flood risk 3/10 · Minor
- FEMA flood zone
- X (unshaded)
- Chance of flooding over 30 yrs
- 0.17%
- Est. flood insurance / yr
- $507 – $1,088
Fire risk 1/10 · Minimal
- Est. fire insurance / yr
- $947 – $1,759
Heat risk 10/10 · Severe
- Hot days now (above 107°F)
- 7 days/yr
- Hot days in 30 yrs
- 26 days/yr
Wind risk 10/10 · Severe
- Chance of severe wind over 30 yrs
- 99.0%
Air-quality risk 2/10 · Minimal
- Unhealthy air days now
- 0 days/yr
- Unhealthy air days in 30 yrs
- 1 days/yr
Risk factors via First Street. Map © Google.
Why this score? — see what drove the C grade
The composite is a weighted blend of 9 inputs, each scored 0–100. Each bar is that input's sub-score; the figure is the points it added to the 100-point composite (weight × sub-score).
- Cash flow +16.5/30.0
- ARV discount +15.0/15.0
- 1% rule +5.4/10.0
- DSCR +5.1/10.0
- Schools +4.3/10.0
- Livability +4.0/5.0
- Rent growth +3.1/5.0
- Condition / age +2.5/5.0
- Appreciation +0.0/10.0
$370,000
🖨 Deal sheet 📄 Offer letter ✓ Due diligence
Listing remarks MLS
Great home for first time home buyer. 4 beds, 2 car garage, screened patio with view of pond. Tile floors downstairs. Great opportunity. This information is deemed reliable but not guaranteed. BUYER is responsible for verifiying all information prior to close. Please email listing agent with any questions about the property or offer status.
Key facts
- Garage
- Built 2003
- Listed 3 days
Property features AI
Exterior
- Parking: 1-car garage
- Home design: Built in 2003
- Exterior features: Located in the Victoria Groves subdivision
Neighborhood map
What this means for you Summary
Snapshot
- This is a 4-bed/2.5-bath single-family listed at $370k.
Deal economics
- At list price, monthly cash flow is $218 ($3k/yr) — positive.
- The deal already cash-flows at list — no discount required.
- Meets the 1% rule at list price ($4k rent vs $370k).
Location & tenants
- Location reads 79/100 on livability (#135 in FL, #2,039 nationally) — a middle-class / working-renter tenant base. Strengths: employment A+, housing A+, health & safety A+; Watch: cost of living C-, amenities F, commute F.
- Palm Beach (suburban): math 46% / reading 53% proficiency, ranked #34 of 73 in FL (top 47%) — families likely to look elsewhere, expect single-tenant / working-renter base with shorter leases.
- Market conditions: Rents rising (+2.3%/yr); 616 active listings in the ZIP; 40 comparable units currently listed for rent nearby; rentals at typical pace (median 25d on market — plan ~3-4 weeks tenant-placement turnaround); high-income renter base; 3,974 units permitted in Palm Beach County in 2024 (1,012 in 5+ unit buildings).
- This rent runs 41% of the median local income ($112k/yr) — at the standard rent-burdened threshold; future hikes will face affordability resistance.
Forward outlook
- Local home prices are declining (-3.0%/yr); year-one equity from $3k of loan paydown is wiped out by about $11k of value loss. Plan a longer hold.
- Palm Beach County population projected at +30% by 2050 — long-run rental-demand tailwind backs the buy-and-hold thesis.
Negotiation context
- Only 4 days on market — expect competitive offers; lowballing is unlikely to land.
- 5 sale attempts since 14y ago; this cycle's ask is 10178% above the opening price — seller raised mid-cycle; expect resistance to lowballs.
- Current owner paid $190k; list at $370k implies a 95% gain — meaningful room to come down on a strong offer.
Risks & watch-outs
- Climate carrying-cost: severe wind risk, 99% chance of damaging wind over 30y; extreme-heat days projected 7→26/yr by 2055 (HVAC capex compounding) — expect insurance premiums to compound above CPI over the hold.
Questions for the listing agent
- Is there a deadline driving the sale (1031 exchange, divorce, estate, relocation)? That informs how much negotiation room exists.
- Schools are B-rated — typically a magnet for longer-tenancy family renters. What's the average tenant stay here, and is there a school-zone premium baked into asking?
- What's the average days-on-market for RENTAL listings here right now (not sales)? A rising rental-DOM trend means longer vacancies and softer asking-rent achievability than the comps imply.
- What's the recent tenant-quality profile in this submarket — average credit score on applications, eviction rate, late-payment / NSF rate, and stable-employment percentage? A property-management company in the area should have these aggregated.
- How much new for-sale + rental construction is in the pipeline within 1–3 miles? Heavy new supply typically softens prices + rents 12–24 months out; constrained supply supports both.
Investment metrics
- 1% rule
- 1.04% ✓
- Cap rate
- 7.00%
- Cash-on-cash
- 2.52%
- DSCR
- 1.11
- GRM
- 8.0
CMA / ARV
- ARV (on-the-fly)
- $507,400
- Comps found
- 1
Show comp detail 1 sale within ~0.75 mi
| Address | Dist | Beds/Ba | Sqft | Sold | Price | $/sf | Match |
|---|---|---|---|---|---|---|---|
| 244 Kensington Way | 0.29mi | 5/3.0 (+1) | 2,897 (+14%) | 5mo | $580,000 | $200 | 51 |
Match score weights: distance 35% · size 25% · config 20% · recency 20%. Top-matched comps best support the ARV.
Projected returns pro-forma
-3.0% appreciation · 2.31% rent growth · sell at horizon
- IRR
- -13.1%
- Equity multiple
- 0.53×
- Total profit
- $-48,526
- Equity at exit
- $55,168
- IRR
- -5.2%
- Equity multiple
- 0.67×
- Total profit
- $-34,237
- Equity at exit
- $31,991
Cash invested: $103,600 (down + closing). Projections, not guarantees.
Landlord ↔ Tenant lean methodology
- Overall (STATE)
- 87 Strongly Landlord-Friendly
- State Florida
- 87 Strongly Landlord-Friendly · R+3
- County
- — inherits STATE
- City
- — inherits STATE
ZIP-level market 33414
- Home prices YoY
- -30.2%
- Rents YoY
- 2.3%
- Active inventory
- 616
- Price-to-rent
- 8.0×
Monthly cashflow live
- Estimated rent
- $3,834 high interval (Pro) →
- Mortgage (P&I)
- −$1,940
- Tax from tax record
- −$717 /mo · $8,600/yr
- Insurance
- −$154
- HOA
- −$0
- Vacancy / Maint / Mgmt
- −$805
- Net cashflow
- $218
Break-even live
UW: 25.0% down · 7.5% · 30yr · 1.5% tax · 5.0% vac · 8.0% maint · 8.0% mgmt
Financing live
Cash to close
- Down payment
- $92,500
- Closing costs
- $11,100
- Reserves months
- —
- Total cash needed
- —
Loan-product check · same deal, 3 products live
Conventional
25% down · 7.5% · 30yr
- Down + closing
- —
- Monthly P&I
- —
- Monthly cashflow
- —
- DSCR
- —
- Eligible?
- —
Personal DTI + credit; lowest rate.
DSCR
20% down · 8.5% · 30yr
- Down + closing
- —
- Monthly P&I
- —
- Monthly cashflow
- —
- DSCR
- —
- Eligible?
- —
No personal income docs; deal must DSCR.
Hard money
10% down · 12.0% · 12mo
- Down + closing
- —
- Monthly P&I
- —
- Monthly cashflow
- —
- DSCR
- —
- Eligible?
- —
Short-term bridge; refi at stabilization.
Rent comps 40 comps
| Address | Beds | Baths | Sqft | Rent | $/sqft | DOM | Units | Dist |
|---|---|---|---|---|---|---|---|---|
| 116 Hamilton Ter Royal Palm Beach, FL | 4.0 | 2.5 | 2537 | $3,500 | $1.38 | 15d | 1 | 0.03mi |
| 116 Hamilton Ter Royal Palm Beach, FL | 4.0 | 2.5 | 2537 | $3,300 | $1.30 | 3d | 1 | 0.03mi |
| 137 Canterbury Pl Royal Palm Beach, FL | 3.0 | 2.5 | 1856 | $3,500 | $1.89 | 24d | 1 | 0.18mi |
| 113 Canterbury Pl Royal Palm Beach, FL | 4.0 | 2.5 | 2267 | $3,500 | $1.54 | 5d | 1 | 0.23mi |
| 113 Canterbury Pl Royal Palm Beach, FL | 4.0 | 2.5 | 2267 | $3,500 | $1.54 | 24d | 1 | 0.23mi |
| 169 Berenger Walk Royal Palm Beach, FL | 4.0 | 2.5 | 2262 | $3,750 | $1.66 | 24d | 1 | 0.33mi |
| 175 Berenger Walk Royal Palm Beach, FL | 4.0 | 2.5 | 2204 | $3,600 | $1.63 | 24d | 1 | 0.35mi |
| 147 Kensington Way Royal Palm Beach, FL | 4.0 | 2.5 | 2536 | $4,000 | $1.58 | 24d | 1 | 0.38mi |
| 2405 Shoma Dr Royal Palm Beach, FL | 3.0 | 3.5 | 1932 | $2,375 | $1.23 | 3d | 1 | 0.41mi |
| 3515 Shoma Dr Unit 3515 West Palm Beach, FL | 3.0 | 3.5 | 1815 | $3,250 | $1.79 | 24d | 1 | 0.42mi |
| 3808 Shoma Dr Unit 3808 West Palm Beach, FL | 3.0 | 3.0 | 2300 | $2,300 | $1.00 | 24d | 1 | 0.42mi |
| 3106 Shoma Dr Royal Palm Beach, FL | 4.0 | 3.5 | 1988 | $4,000 | $2.01 | 3d | 1 | 0.42mi |
| 3106 Shoma Dr Royal Palm Beach, FL | 4.0 | 3.5 | 1988 | $3,900 | $1.96 | 24d | 1 | 0.42mi |
| 3308 Shoma Dr Royal Palm Beach, FL | 4.0 | 3.5 | 1988 | $2,500 | $1.26 | 5d | 1 | 0.42mi |
| 3308 Shoma Dr Royal Palm Beach, FL | 4.0 | 3.5 | 1988 | $2,500 | $1.26 | 24d | 1 | 0.42mi |
| 217 Berenger Walk Royal Palm Beach, FL | 3.0 | 2.5 | 2204 | $3,000 | $1.36 | 17d | 1 | 0.50mi |
| 10454 Galleria St Wellington, FL | 5.0 | 3.0 | 3483 | $5,550 | $1.59 | 24d | 1 | 0.54mi |
| 10530 Galleria St Wellington, FL | 4.0 | 3.5 | 2811 | $4,050 | $1.44 | 8d | 1 | 0.54mi |
| 10690 Old Hammock Way Wellington, FL | 5.0 | 3.0 | 3065 | $6,000 | $1.96 | 24d | 1 | 0.55mi |
| 10671 Old Hammock Way Wellington, FL | 4.0 | 4.5 | 2811 | $4,100 | $1.46 | 22d | 1 | 0.57mi |
| 10671 Old Hammock Way Wellington, FL | 4.0 | 4.5 | 2811 | $4,200 | $1.49 | 24d | 1 | 0.57mi |
| 11200 Nicole Dr Wellington, FL | 1.0–4.0 | 1.0–3.5 | 1404 | $4,443 | $3.16 | 2d | 33 | 0.57mi |
| 11300 Channing Ln Unit 102 Royal Palm Beach, FL | 3.0 | 2.0 | 2111 | $4,299 | $2.04 | 24d | 1 | 0.63mi |
| 1451 Pioneer Way Royal Palm Beach, FL | 3.0 | 2.5 | 1900 | $4,750 | $2.50 | 22d | 1 | 0.70mi |
| 9433 Madewood Ct Royal Palm Beach, FL | 4.0 | 2.0 | 2616 | $5,350 | $2.05 | 24d | 1 | 0.81mi |
| 10793 Oak Bend Way Wellington, FL | 4.0 | 2.5 | 1852 | $4,000 | $2.16 | 11d | 1 | 0.89mi |
| 1429 Stonehaven Estates Dr West Palm Beach, FL | 3.0 | 2.0 | 2729 | $2,115 | $0.78 | 5d | 1 | 0.94mi |
| 625 Whippoorwill Ter West Palm Beach, FL | 3.0 | 2.0 | 1914 | $4,500 | $2.35 | 24d | 1 | 0.95mi |
| 1019 Larch Way Wellington, FL | 4.0 | 2.0 | 2125 | $4,000 | $1.88 | 24d | 1 | 0.98mi |
| 9326 Plantation Estates Dr Royal Palm Beach, FL | 5.0 | 3.0 | 3161 | $4,300 | $1.36 | 24d | 1 | 0.99mi |
| 930 Rambling Drive Cir Wellington, FL | 3.0 | 2.5 | 2440 | $7,950 | $3.26 | 24d | 1 | 1.01mi |
| 1104 Jackpine St Wellington, FL | 3.0 | 2.0 | 1760 | $6,700 | $3.81 | 24d | 1 | 1.03mi |
| 1104 Jackpine St Unit (off-season) Wellington, FL | 3.0 | 2.0 | 1760 | $3,500 | $1.99 | 24d | 1 | 1.03mi |
| 10569 Pelican Dr Wellington, FL | 4.0 | 3.5 | 1843 | $3,450 | $1.87 | 14d | 1 | 1.07mi |
| 502 Rambling Drive Cir Unit 1 Wellington, FL | 3.0 | 1.0 | 2600 | $3,600 | $1.38 | 24d | 1 | 1.15mi |
| 10667 Lake Shore Dr Wellington, FL | 3.0 | 2.5 | 1853 | $2,600 | $1.40 | 24d | 1 | 1.16mi |
| 11647 Anhinga Dr Wellington, FL | 5.0 | 3.0 | 2279 | $9,900 | $4.34 | 13d | 1 | 1.27mi |
| 11647 Anhinga Dr Wellington, FL | 5.0 | 3.0 | 2279 | $9,900 | $4.34 | 24d | 1 | 1.27mi |
| 1853 Shower Tree Way Wellington, FL | 3.0 | 2.0 | 2032 | $4,600 | $2.26 | 24d | 1 | 1.31mi |
| 1853 Shower Tree Way Wellington, FL | 3.0 | 2.0 | 2032 | $4,600 | $2.26 | 5d | 1 | 1.31mi |
Listing history 3 events
-
2026-06-09days on market $370,000 Active 4 DOM
-
2026-06-07remarks 172-char remark
-
2026-06-07$370,000 Active 2 DOM
ⓘ Source: listings_history table (triggers on properties + properties_extension) + one-shot
backfill from property_details.listing_events for pre-trigger history.
Tax reassessment forecast FL · Resets to sale price
- Current annual tax
- $8,600 · $717/mo
- Projected year-2 tax
- $8,600 · $717/mo
- Expected delta
- $0/yr ($0/mo · 0.0%)
ⓘ Screening estimate from a state-policy table — verify with the county assessor before closing.
Climate risk First Street
- Flood 3/10 Moderate FEMA zone X (unshaded) · 17% chance over 30 yrs
- Wildfire 1/10 Low
- Heat 10/10 Extreme 7 d/yr ≥107°F today · 26 d/yr by 30 yrs out
- Wind 10/10 Extreme 99% chance of damaging wind over 30 yrs
- Air quality 2/10 Low 0 unhealthy d/yr today · 1 by 30 yrs out
Nearby sold comps map
Loading sold comps map…
Walkable amenities ~0.75 mi
Loading nearby amenities…
Taxation est. · year 1
- Rental income
- $46,006
- − Mortgage interest
- −$20,726
- − Property taxes
- −$8,600
- − Insurance
- −$1,850
- − Repairs & maintenance
- −$3,681
- − Management
- −$3,681
- − Depreciation
- −$10,764
- Taxable loss
- −$3,294
- Est. tax savings @ 24.0%
- +$791
- After-tax cash flow
- $3,402/yr
For passive investors: Depreciation is non-cash, so a rental often shows a tax loss while cash-flowing — sheltering income. Rental losses are passive: they offset passive income freely, and up to $25,000/yr can offset ordinary (W-2) income if you actively participate and your MAGI is under $100k (phasing out to $0 by $150k); unused losses carry forward. On sale, claimed depreciation is recaptured at up to 25%, and gains may owe capital-gains tax (a 1031 exchange can defer both). Figures are a year-1 estimate at your 24.0% rate — not tax advice; consult a CPA.
Schools (NCES district)
- District
- Palm Beach
- NCES district ID
- 1201500
- Math proficiency
- 46% ▼ -16.00%
- Reading proficiency
- 53% ▼ -4.00%
- Median HH income
- $53,943
- Composite
- 42.72/100
- National rank
- #3160
- State rank
- #34 of 73 in FL
Livability — Royal Palm Beach
- Score
- 79/100
- State rank
- #135
- US rank
- #2039
Category grades
Schools grade is shown separately in the Schools card above.
Census & demographics
- Census place
- Royal Palm Beach, FL
- County
- Palm Beach County · 1,438,312 people
- City population
- 75,299
- Metro
- Miami-Fort Lauderdale-Pompano Beach, FL
- Population (ZIP)
- 60,184
- Household income
- $112,241
- Rent vs Own
- Severe rent burden
- 1566.0
Population outlook (Palm Beach County) Hauer SSP2
- Today (2025)
- 1,637,487 people
- By 2030
- 1,743,255 · +6.5%
- By 2040
- 1,948,712 · +19.0%
- By 2050
- 2,132,979 · +30.3%
- By 2075
- 2,530,027 · +54.5%
- By 2100
- 2,706,979 · +65.3%
Race, ethnicity, and origin ACS 2023
- Neighborhood character
- Diverse neighborhood (Simpson 0.67)
- Race & ethnicity
- White 47% Hispanic / Latino 29% Two or more races 20% Black 13% Asian 6%
- Hispanic origin (detail)
- Mexican 4% Puerto Rican 5% Cuban 6% Dominican 1% Salvadoran 1%
- Common ancestry
- Hispanic 4% Romanian 3% Lithuanian 2%
- Foreign-born
- 26% · Canada, Jamaica, China
- Languages at home
- 67% English-only · Spanish 23% French/Haitian/Cajun 3% Other Indo-European 3%
Political lean MEDSL · Palm Beach
- 2024 margin
- Toss-up / Even · D 50.0% · R 49.2%
- 2008→2024 swing
- -22.1pp toward R · 2008: 22.9pp · 2024: 0.8pp
- All cycles
- 2024: D+0.8 2020: D+12.8 2016: D+15.3 2012: D+17.0 2008: D+22.9
Not yet ingested
- Civics
- —
Market trends
- HPI YoY
- ▼ -152.58%
- Current HPI
- 352.9366
- Rent YoY
- ▲ 2.31%
- Metro
- Miami-Fort Lauderdale-Pompano Beach, FL
- State GDP YoY
- ▲ 3.28%
- F500 in state
- 36
Industry mix (Fortune 500 HQ in FL)
| Industry | F500 HQs | Revenue |
|---|---|---|
| Industrial Technology | 2 | $29B |
|
||
| Insurance | 2 | $17B |
|
||
| Retail | 1 | $60B |
|
||
| Technology Distribution | 1 | $58B |
|
||
| Homebuilding | 1 | $35B |
|
||
| Technology Manufacturing | 1 | $35B |
|
||
Price history
-98.1% since first listed9 events — show timeline
- 2026-06-07 Listed for Rent $3,600 RMLSFL
- 2026-06-07 Rental Removed $3,500 GFLMLS
- 2026-06-05 Listed $370,000 FSBO.com
- 2026-06-05 Listed for Rent $3,500 GFLMLS
- 2026-05-12 Rental Removed $3,500 RMLSFL
- 2026-04-21 Listed for Rent $3,500 RMLSFL
- 2012-12-11 Sold (MLS) $190,000 Beaches MLS
- 2012-11-19 Listing Removed — Beaches MLS
- 2012-09-17 Listed $185,000 Beaches MLS
Property tax history
+7.1%/yrLatest (2025): $8,600 · +6.3% YoY. Source: county tax records.
Cash-flow waterfall
monthlySold comps — $/sqft
last 12 mo · ≤1 miLoading sold comps…