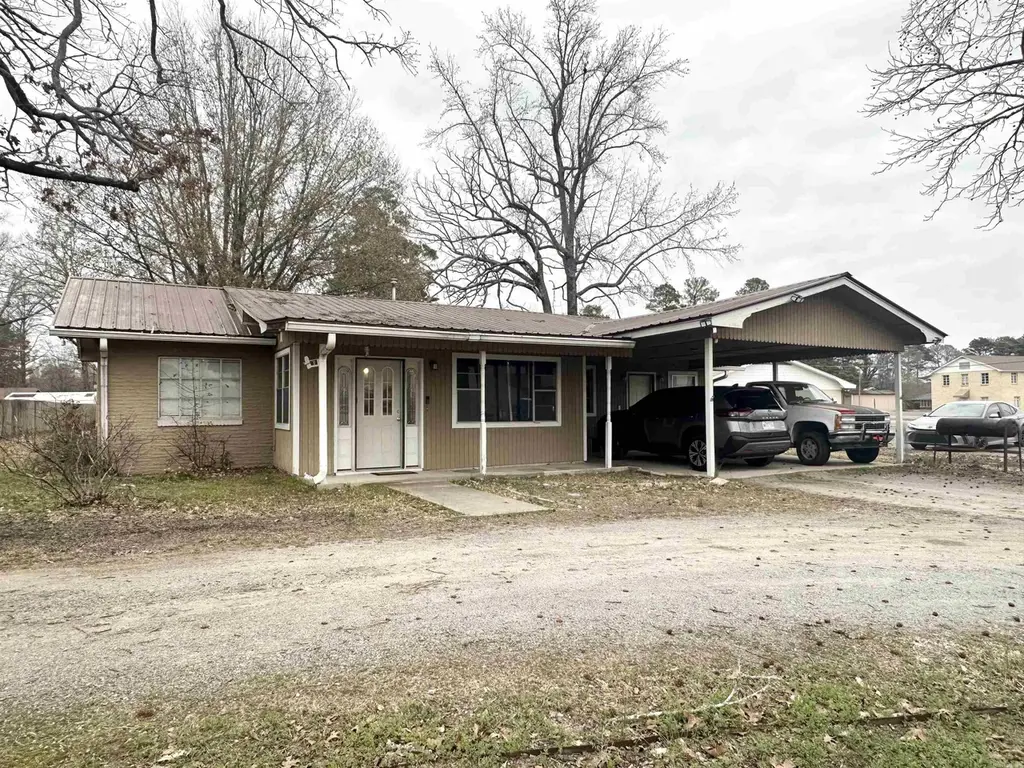
5709 Sulphur Springs Rd · Pine Bluff, AR
Flood risk 1/10 · Minimal
- FEMA flood zone
- X (unshaded)
- Chance of flooding over 30 yrs
- 0.0%
- Est. flood insurance / yr
- $507 – $1,088
Fire risk 5/10 · Moderate
- Est. fire insurance / yr
- $1,499 – $2,785
Heat risk 7/10 · Major
- Hot days now (above 109°F)
- 7 days/yr
- Hot days in 30 yrs
- 20 days/yr
Wind risk 4/10 · Minor
- Chance of severe wind over 30 yrs
- 24.0%
Air-quality risk 1/10 · Minimal
- Unhealthy air days now
- 0 days/yr
- Unhealthy air days in 30 yrs
- 0 days/yr
Risk factors via First Street. Map © Google.
Why this score? — see what drove the C grade
The composite is a weighted blend of 9 inputs, each scored 0–100. Each bar is that input's sub-score; the figure is the points it added to the 100-point composite (weight × sub-score).
- Cash flow +23.4/30.0
- ARV discount +12.4/15.0
- DSCR +7.5/10.0
- 1% rule +5.1/10.0
- Rent growth +2.5/5.0
- Livability +2.5/5.0
- Condition / age +2.5/5.0
- Schools +1.0/10.0
- Appreciation +0.0/10.0
$115,000
🖨 Deal sheet (PDF) 📄 Offer letter ✓ Due diligence
Listing remarks MLS
Excellent Investment Property, Next To The Newly Renovated Watson Chapel Schools! Split Floor Plan, Well Maintained, Large Laundry Room, Large Master With Walk In Closet! HUGE Back Yard! Please allow 24 hours for showing. Property currently has tenant in place. See Agent Remarks
Key facts
- Split floor plan
- Large laundry room
- Huge back yard
Tags
Neighborhood map
What this means for you Summary
Snapshot
- This is a 3-bed/1.0-bath single-family listed at $115k.
Deal economics
- At list price, monthly cash flow is $213 ($3k/yr) — positive.
- The deal already cash-flows at list — no discount required.
- Meets the 1% rule at list price ($1k rent vs $115k).
- Recommended offer: $105k (9.0% below list) — sets the bar for market timing.
Location & tenants
- Location reads 50/100 on livability (#483 in AR) — a working-class tenant base; expect higher turnover. Strengths: cost of living A+, housing A; Watch: schools F, crime F, amenities F.
- Watson Chapel School District (urban): math 10% / reading 12% proficiency, ranked #228 of 238 in AR (top 96%) — low school quality limits family demand, transient renter base, plan for 1-2y turnover; 68% free/reduced lunch — lower-income household profile, screen leases tightly.
- Market conditions: 211 active listings in the ZIP; 62 units permitted in Jefferson County in 2024 (0 in 5+ unit buildings).
Forward outlook
- Local home prices are declining (-3.0%/yr); year-one equity from $795 of loan paydown is wiped out by about $3k of value loss. Plan a longer hold.
- Jefferson County population projected at -33% by 2050 — secular population decline; favor cash flow + early exit over multi-decade hold.
Negotiation context
- It's been on market 115 days — a 9% lower offer ($105k) is reasonable based on typical stale-listing flexibility.
- 4 sale attempts since 5y ago with the ask held roughly flat each time — persistent listings suggest the price (not the market) is what's stuck; bring a comps-based counter.
- Current owner paid $55k; list at $115k implies a 109% gain — meaningful room to come down on a strong offer.
Risks & watch-outs
- Watch-outs: built in 1954 — expect roof / HVAC / electrical / plumbing capex.
- Climate carrying-cost: moderate wildfire risk; extreme-heat days projected 7→20/yr by 2055 (HVAC capex compounding) — expect insurance premiums to compound above CPI over the hold.
Questions for the listing agent
- It's been on market 115 days. Have you received any prior offers? Is the seller open to a 9% concession, seller financing, or rate buy-down credit?
- Built in 1954 — when were the roof, HVAC, electrical panel, plumbing, and water heater last replaced?
- Why hasn't it sold? Are there any deal-killer items the seller is aware of (foundation, flood, title, zoning, code violations)?
- Is there a deadline driving the sale (1031 exchange, divorce, estate, relocation)? That informs how much negotiation room exists.
- Schools are F-rated, which usually means shorter tenancies and higher turnover. Who's the typical renter profile here, and what's been the actual vacancy rate?
- Crime grade is F in this area — have there been break-ins, vandalism, or insurance claims at this property in the last 3 years? What carrier currently insures it and at what premium?
- What's the average days-on-market for RENTAL listings here right now (not sales)? A rising rental-DOM trend means longer vacancies and softer asking-rent achievability than the comps imply.
- What's the recent tenant-quality profile in this submarket — average credit score on applications, eviction rate, late-payment / NSF rate, and stable-employment percentage? A property-management company in the area should have these aggregated.
- How much new for-sale + rental construction is in the pipeline within 1–3 miles? Heavy new supply typically softens prices + rents 12–24 months out; constrained supply supports both.
Investment metrics
- 1% rule
- 1.01% ✓
- Cap rate
- 8.51%
- Cash-on-cash
- 7.92%
- DSCR
- 1.35
- GRM
- 8.2
CMA / ARV
- ARV (median comp)
- $129,005
- List price
- $115,000
- Delta
- -10.86%
- Verdict
- UNDERPRICED
- Comps
- 20 within 1.0 mi
Show comp detail 5 sales within ~0.75 mi
| Address | Dist | Beds/Ba | Sqft | Sold | Price | $/sf | Match |
|---|---|---|---|---|---|---|---|
| 3706 E Lk | 0.17mi | 3/1.0 | 1,539 (+4%) | 9mo | $135,000 | $88 | 78 |
| 3700 E Greenway Dr | 0.09mi | 3/1.0 | 1,344 (-9%) | 8mo | $129,900 | $97 | 73 |
| 4115 Chapel Ln | 0.25mi | 3/1.0 | 1,316 (-11%) | 4mo | $23,000 | $17 | 67 |
| 3606 E Lk | 0.29mi | 3/2.0 | 1,340 (-10%) | 16mo | $139,000 | $104 | 53 |
| 6211 Thrasher | 0.71mi | 3/2.0 | 1,488 (+0%) | 20mo | $115,000 | $77 | 46 |
Match score weights: distance 35% · size 25% · config 20% · recency 20%. Top-matched comps best support the ARV.
Projected returns pro-forma
-3.0% appreciation · 3.0% rent growth · sell at horizon
- IRR
- -4.3%
- Equity multiple
- 0.84×
- Total profit
- $-5,130
- Equity at exit
- $17,147
- IRR
- 5.4%
- Equity multiple
- 1.40×
- Total profit
- $12,821
- Equity at exit
- $9,943
Cash invested: $32,200 (down + closing). Projections, not guarantees.
Landlord ↔ Tenant lean methodology
- Overall (STATE)
- 92 Strongly Landlord-Friendly
- State Arkansas
- 92 Strongly Landlord-Friendly · R+14
- County
- — inherits STATE
- City
- — inherits STATE
ZIP-level market 71603
- Home prices YoY
- -26.0%
- Active inventory
- 211
- Price-to-rent
- 8.2×
Monthly cashflow live
- Estimated rent
- $1,164 medium interval (Pro) →
- Mortgage (P&I)
- −$603
- Tax from tax record
- −$56 /mo · $669/yr
- Insurance
- −$48
- HOA
- −$0
- Vacancy / Maint / Mgmt
- −$244
- Net cashflow
- $213
Break-even live
Sensitivity live
| Price | -10% $278 | -5% $245 | +0% $213 | +5% $180 | +10% $148 |
|---|---|---|---|---|---|
| Rent | -10% $121 | -5% $167 | +0% $213 | +5% $259 | +10% $305 |
| Rate | -1.0pp $271 | -0.5pp $242 | base $213 | +0.5pp $183 | +1.0pp $152 |
UW: 25.0% down · 7.5% · 30yr · 1.5% tax · 5.0% vac · 8.0% maint · 8.0% mgmt
Financing live
Cash to close
- Down payment
- $28,750
- Closing costs
- $3,450
- Reserves months
- —
- Total cash needed
- —
Loan-product check · same deal, 3 products live
Conventional
25% down · 7.5% · 30yr
- Down + closing
- —
- Monthly P&I
- —
- Monthly cashflow
- —
- DSCR
- —
- Eligible?
- —
Personal DTI + credit; lowest rate.
DSCR
20% down · 8.5% · 30yr
- Down + closing
- —
- Monthly P&I
- —
- Monthly cashflow
- —
- DSCR
- —
- Eligible?
- —
No personal income docs; deal must DSCR.
Hard money
10% down · 12.0% · 12mo
- Down + closing
- —
- Monthly P&I
- —
- Monthly cashflow
- —
- DSCR
- —
- Eligible?
- —
Short-term bridge; refi at stabilization.
Listing history 30 events
-
2026-06-21days on market $115,000 Active 115 DOM
-
2026-06-19days on market $115,000 Active 113 DOM
-
2026-06-18days on market $115,000 Active 112 DOM
-
2026-06-17days on market $115,000 Active 111 DOM
-
2026-06-16days on market $115,000 Active 110 DOM
-
2026-06-15days on market $115,000 Active 109 DOM
-
2026-06-14days on market $115,000 Active 107 DOM
-
2026-06-12days on market $115,000 Active 106 DOM
-
2026-06-09days on market $115,000 Active 103 DOM
-
2026-06-08days on market $115,000 Active 102 DOM
-
2026-06-07days on market $115,000 Active 101 DOM
-
2026-06-05days on market $115,000 Active 98 DOM
-
2026-06-03days on market $115,000 Active 97 DOM
-
2026-06-02days on market $115,000 Active 96 DOM
-
2026-06-01days on market $115,000 Active 95 DOM
-
2026-05-31days on market $115,000 Active 94 DOM
-
2026-05-30days on market $115,000 Active 93 DOM
-
2026-02-26$115,000 New Listing 279-char remark
Show marketing remark (279 chars)
Excellent Investment Property, Next To The Newly Renovated Watson Chapel Schools! Split Floor Plan, Well Maintained, Large Laundry Room, Large Master With Walk In Closet! HUGE Back Yard! Please allow 24 hours for showing. Property currently has tenant in place. See Agent Remarks
-
2025-06-30historical
-
2025-04-14$71,000 New Listing
-
2025-03-30historical $950
-
2025-03-26$950
-
2022-04-22soldstatus $55,000 Sold
-
2022-04-22soldstatus $55,000
-
2022-03-07status Under Contract
-
2022-01-25price $62,500
-
2021-08-20price $69,900
-
2021-07-13$79,900 New Listing
-
2017-05-11soldstatus $38,500
-
2013-07-26soldstatus $39,000
ⓘ Source: listings_history table (triggers on properties + properties_extension) + one-shot
backfill from property_details.listing_events for pre-trigger history.
Tax reassessment forecast AR · Resets to sale price
- Current annual tax
- $669 · $56/mo
- Projected year-2 tax
- $736 · $61/mo
- Expected delta
- +$67/yr (+$6/mo · 9.9%)
ⓘ Screening estimate from a state-policy table — verify with the county assessor before closing.
Climate risk First Street
- Flood 1/10 Low FEMA zone X (unshaded) · 0% chance over 30 yrs
- Wildfire 5/10 Major
- Heat 7/10 Severe 7 d/yr ≥109°F today · 20 d/yr by 30 yrs out
- Wind 4/10 Moderate 24% chance of damaging wind over 30 yrs
- Air quality 1/10 Low 0 unhealthy d/yr today · 0 by 30 yrs out
Nearby sold comps map
Loading sold comps map…
Walkable amenities ~0.75 mi
Loading nearby amenities…
Taxation est. · year 1
- Rental income
- $13,965
- − Mortgage interest
- −$6,442
- − Property taxes
- −$669
- − Insurance
- −$575
- − Repairs & maintenance
- −$1,117
- − Management
- −$1,117
- − Depreciation
- −$3,345
- Taxable income
- $699
- Est. tax owed @ 24.0%
- −$168
- After-tax cash flow
- $2,384/yr
For passive investors: Depreciation is non-cash, so a rental often shows a tax loss while cash-flowing — sheltering income. Rental losses are passive: they offset passive income freely, and up to $25,000/yr can offset ordinary (W-2) income if you actively participate and your MAGI is under $100k (phasing out to $0 by $150k); unused losses carry forward. On sale, claimed depreciation is recaptured at up to 25%, and gains may owe capital-gains tax (a 1031 exchange can defer both). Figures are a year-1 estimate at your 24.0% rate — not tax advice; consult a CPA.
Schools (NCES district)
- District
- Watson Chapel School District
- NCES district ID
- 0513930
- Math proficiency
- 10% ▼ -11.00%
- Reading proficiency
- 12% ▼ -10.00%
- Median HH income
- $40,521
- Composite
- 9.55/100
- National rank
- #9845
- State rank
- #228 of 238 in AR
Livability — Pine Bluff
- Score
- 50/100
- State rank
- #483
- US rank
- #25645
Category grades
Schools grade is shown separately in the Schools card above.
Census & demographics
- Census place
- Pine Bluff, AR
- County
- Jefferson County · 29,578 people
- City population
- 29,578
- Metro
- Pine Bluff, AR
- Population (ZIP)
- 29,578
- Household income
- $53,130
- Rent vs Own
- Severe rent burden
- 657.0
Population outlook (Jefferson County) Hauer SSP2
- Today (2025)
- 63,110 people
- By 2030
- 58,519 · -7.3%
- By 2040
- 49,740 · -21.2%
- By 2050
- 42,331 · -32.9%
- By 2075
- 29,591 · -53.1%
- By 2100
- 21,047 · -66.7%
Race, ethnicity, and origin ACS 2023
- Neighborhood character
- Majority Black (62%)
- Race & ethnicity
- Black 62% White 33% Two or more races 2% Hispanic / Latino 2%
- Common ancestry
- Italian 2% Slovak 1%
- Foreign-born
- 2% · Canada
- Languages at home
- 98% English-only · Spanish 1%
Political lean MEDSL · Jefferson
- 2024 margin
- Strong D (+20.1) · D 59.2% · R 39.2% · Other 1.6%
- 2008→2024 swing
- -6.2pp toward R · 2008: 26.3pp · 2024: 20.1pp
- All cycles
- 2024: D+20.1 2020: D+21.7 2016: D+25.3 2012: D+29.0 2008: D+26.3
Not yet ingested
- Civics
- —
Market trends
- HPI YoY
- ▼ -72.43%
- Current HPI
- 206.5994
- Rent YoY
- —
- Metro
- Pine Bluff, AR
- State GDP YoY
- ▲ 3.80%
- F500 in state
- 10
Industry mix (Fortune 500 HQ in AR)
| Industry | F500 HQs | Revenue |
|---|---|---|
| Retail | 1 | $681B |
|
||
| Food / Agriculture | 1 | $53B |
|
||
| Retail / Energy | 1 | $22B |
|
||
| Transportation / Logistics | 1 | $12B |
|
||
| Energy | 1 | $4B |
|
||
Price history
+194.9% since first listed13 events — show timeline
- 2026-02-26 Listed $115,000 CARMLS
- 2025-06-30 Listing Removed — CARMLS
- 2025-04-14 Listed $71,000 CARMLS
- 2025-03-30 Rental Removed $950 BUILDIUM
- 2025-03-26 Listed for Rent $950 BUILDIUM
- 2022-04-22 Sold (Public Records) $55,000 Public Records
- 2022-04-22 Sold (MLS) $55,000 CARMLS
- 2022-03-07 Pending — CARMLS
- 2022-01-25 Price Changed $62,500 CARMLS
- 2021-08-20 Price Changed $69,900 CARMLS
- 2021-07-13 Listed $79,900 CARMLS
- 2017-05-11 Sold (Public Records) $38,500 Public Records
- 2013-07-26 Sold (Public Records) $39,000 Public Records
Property tax history
+1.8%/yrLatest (2025): $669 · +0.0% YoY. Source: county tax records.
Cash-flow waterfall
monthlySold comps — $/sqft
last 12 mo · ≤1 miLoading sold comps…