 🏗️ New Construction
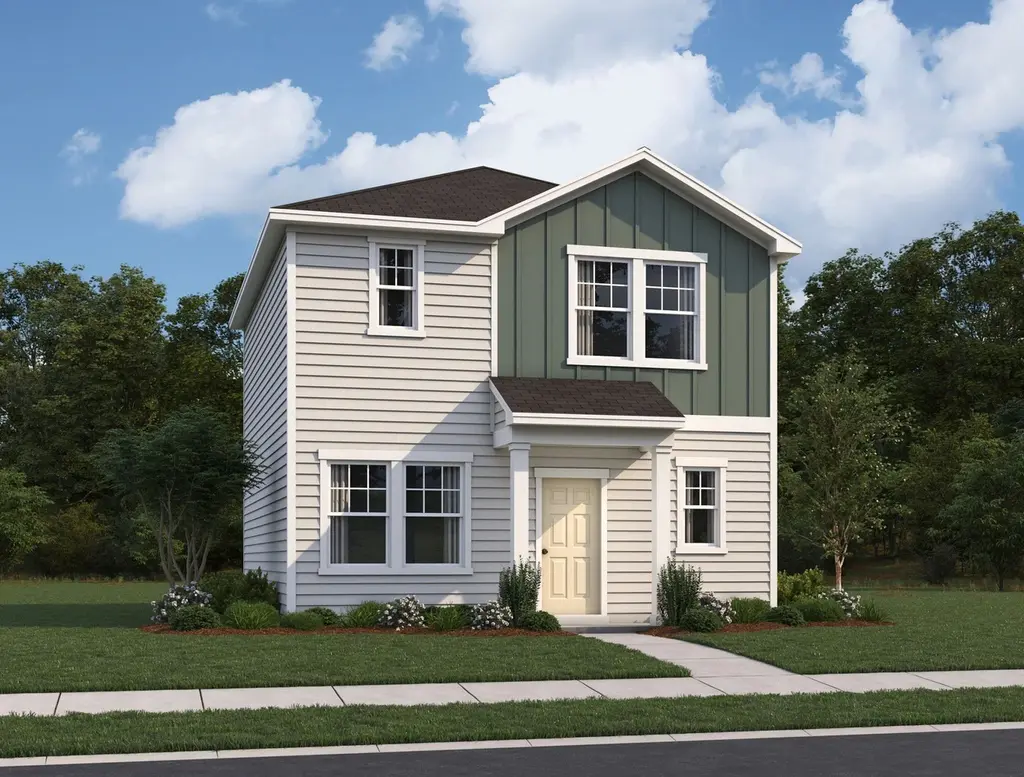
Selene Plan · San Antonio, TX
Flood risk No data
- FEMA flood zone
- —
- Chance of flooding over 30 yrs
- —
- Est. flood insurance / yr
- —
Fire risk No data
- Est. fire insurance / yr
- —
Heat risk No data
- Hot days now (above threshold)
- —
- Hot days in 30 yrs
- —
Wind risk No data
- Chance of severe wind over 30 yrs
- —
Air-quality risk No data
- Unhealthy air days now
- —
- Unhealthy air days in 30 yrs
- —
Risk factors via First Street. Map © Google.
Why this score? — see what drove the F grade
The composite is a weighted blend of 9 inputs, each scored 0–100. Each bar is that input's sub-score; the figure is the points it added to the 100-point composite (weight × sub-score).
- Cash flow +7.6/30.0
- ARV discount +7.5/15.0
- Livability +4.0/5.0
- Condition / age +4.0/5.0
- Rent growth +3.6/5.0
- 1% rule +2.2/10.0
- Schools +1.9/10.0
- DSCR +1.7/10.0
- Appreciation +0.0/10.0
$212,540
🖨 Deal sheet (PDF) 📄 Offer letter ✓ Due diligence
Listing remarks MLS
The Selene is a thoughtfully designed two-story home that blends open living spaces with comfortable private areas. From the covered porch, you enter a welcoming foyer with a powder bath and staircase, leading into an open family room, dining area, and kitchen-ideal for everyday living and casual entertaining. A pantry and dedicated laundry room are conveniently located just off the main living area for added functionality. Upstairs, the primary bedroom offers a private retreat with a walk-in closet and en-suite bath. Two additional bedrooms share a full bath, with a linen closet nearby for extra storage. With its efficient layout, open-concept design, and practical spaces, the Selene supports an easy, approachable path to homeownership.
Key facts
- Covered porch
- Pantry
- Kitchen
Tags
Neighborhood map
What this means for you Summary
Snapshot
- This is a 3-bed/2.0-bath single-family listed at $213k. Condition is rated good.
Deal economics
- At list price, monthly cash flow is $-285 ($-3k/yr) — negative.
- To cash-flow at today's rent, offer at most $197k (7.5% below list).
- To meet the 1% rule (rent ≥ 1% of price), the offer needs to be $172k (19.1% below list).
- Recommended offer: $172k (19.1% below list) — sets the bar for 1% rule.
- Cap rate 4.9% vs local median 3.8% in San Antonio — meaningfully above typical; check what's discounted (condition, days-on-market, listing class) to confirm the premium yield is real.
Location & tenants
- Location reads 80/100 on livability (#31 in TX, #1,616 nationally) — a professional / high-income tenant draw. Strengths: amenities A+, commute A+, cost of living A+; Watch: schools C-, crime F.
- East Central ISD (rural): math 16% / reading 25% proficiency, ranked #758 of 826 in TX (top 92%) — low school quality limits family demand, transient renter base, plan for 1-2y turnover; 61% free/reduced lunch — lower-income household profile, screen leases tightly.
- Market conditions: Rents rising fast (+4.3%/yr); 428 active listings in the ZIP; 40 comparable units currently listed for rent nearby; rentals at typical pace (median 21d on market — plan ~3-4 weeks tenant-placement turnaround); 8,308 units permitted in Bexar County in 2024 (2,506 in 5+ unit buildings).
- This rent runs 31% of the median local income ($66k/yr) — at the standard rent-burdened threshold; future hikes will face affordability resistance.
Forward outlook
- Local home prices are declining (-3.0%/yr); year-one equity from $2k of loan paydown is wiped out by about $7k of value loss. Plan a longer hold.
- Bexar County population projected at +50% by 2050 — long-run rental-demand tailwind backs the buy-and-hold thesis.
Negotiation context
- It's been on market 140 days — a 12% lower offer ($187k) is reasonable based on typical stale-listing flexibility.
Questions for the listing agent
- What do current leases actually rent for vs. the listed asking? Can we see a recent rent roll and the last 12 months of T-12 income?
- It's been on market 140 days. Have you received any prior offers? Is the seller open to a 19% concession, seller financing, or rate buy-down credit?
- Why hasn't it sold? Are there any deal-killer items the seller is aware of (foundation, flood, title, zoning, code violations)?
- Is there a deadline driving the sale (1031 exchange, divorce, estate, relocation)? That informs how much negotiation room exists.
- Crime grade is F in this area — have there been break-ins, vandalism, or insurance claims at this property in the last 3 years? What carrier currently insures it and at what premium?
- The area grade is low — what's the realistic commute time and amenity access for the typical tenant pool here? Any planned neighborhood developments (good or bad) we should know about?
- What's the average days-on-market for RENTAL listings here right now (not sales)? A rising rental-DOM trend means longer vacancies and softer asking-rent achievability than the comps imply.
- What's the recent tenant-quality profile in this submarket — average credit score on applications, eviction rate, late-payment / NSF rate, and stable-employment percentage? A property-management company in the area should have these aggregated.
- How much new for-sale + rental construction is in the pipeline within 1–3 miles? Heavy new supply typically softens prices + rents 12–24 months out; constrained supply supports both.
Investment metrics
- 1% rule
- 0.72% ✗
- Cap rate
- 4.85%
- Cash-on-cash
- -5.14%
- DSCR
- 0.77
- GRM
- 11.5
CMA / ARV
- ARV (median comp)
- $237,895
- List price
- $212,540
- Delta
- -10.66%
- Verdict
- UNDERPRICED
- Comps
- 20 within 1.0 mi
Show comp detail 12 sales within ~0.75 mi
| Address | Dist | Beds/Ba | Sqft | Sold | Price | $/sf | Match |
|---|---|---|---|---|---|---|---|
| 4615 Flying Hooves | 0.19mi | 3/2.5 | 1,286 (0%) | 0mo | $199,990 | $156 | 89 |
| 5527 Rosillo Hl | 0.20mi | 3/2.0 | 1,310 (+2%) | 1mo | $189,900 | $145 | 87 |
| 4631 Flying Hooves | 0.21mi | 3/2.5 | 1,286 (0%) | 2mo | $214,990 | $167 | 86 |
| 3530 Horizon Lk | 0.60mi | 3/2.0 | 1,272 (-1%) | 2mo | $185,000 | $145 | 69 |
| 6002 Blind | 0.52mi | 3/2.0 | 1,232 (-4%) | 2mo | $100,000 | $81 | 67 |
| 5928 Lake Superior | 0.68mi | 4/2.0 (+1) | 1,260 (-2%) | 3mo | $185,000 | $147 | 58 |
| 3831 Southton | 0.52mi | 3/2.5 | 1,415 (+10%) | 1mo | $190,000 | $134 | 56 |
| 4726 Flying Hooves | 0.30mi | 2/3.0 (-1) | 1,106 (-14%) | 0mo | $199,990 | $181 | 54 |
| 5614 Salado Fls | 0.68mi | 3/2.0 | 1,182 (-8%) | 2mo | $189,000 | $160 | 53 |
| 6127 Southern Vis | 0.60mi | 3/2.5 | 1,415 (+10%) | 1mo | $189,900 | $134 | 52 |
| 3551 Lake Tahoe | 0.58mi | 3/2.0 | 1,131 (-12%) | 2mo | $180,000 | $159 | 51 |
| 3446 Glacier | 0.74mi | 3/2.0 | 1,178 (-8%) | 2mo | $179,990 | $153 | 50 |
Match score weights: distance 35% · size 25% · config 20% · recency 20%. Top-matched comps best support the ARV.
Projected returns pro-forma
-3.0% appreciation · 4.35% rent growth · sell at horizon
- IRR
- -23.6%
- Equity multiple
- 0.18×
- Total profit
- $-54,330
- Equity at exit
- $35,471
- IRR
- -15.2%
- Equity multiple
- 0.09×
- Total profit
- $-60,621
- Equity at exit
- $20,569
Cash invested: $66,610 (down + closing). Projections, not guarantees.
Landlord ↔ Tenant lean methodology
- Overall (STATE)
- 87 Strongly Landlord-Friendly
- State Texas
- 87 Strongly Landlord-Friendly · R+5
- County
- — inherits STATE
- City
- — inherits STATE
ZIP-level market 78222
- Home prices YoY
- -4.8%
- Rents YoY
- 4.3%
- Active inventory
- 428
- Price-to-rent
- 10.3×
Monthly cashflow live
- Estimated rent
- $1,720 high interval (Pro) →
- Mortgage (P&I)
- −$1,248
- Tax est. 1.5%
- −$297 /mo · $3,568/yr
- Insurance
- −$99
- HOA
- −$0
- Vacancy / Maint / Mgmt
- −$361
- Net cashflow
- $-285
Break-even live
Sensitivity live
| Price | -10% $-121 | -5% $-203 | +0% $-285 | +5% $-368 | +10% $-450 |
|---|---|---|---|---|---|
| Rent | -10% $-421 | -5% $-353 | +0% $-285 | +5% $-217 | +10% $-149 |
| Rate | -1.0pp $-166 | -0.5pp $-225 | base $-285 | +0.5pp $-347 | +1.0pp $-410 |
UW: 25.0% down · 7.5% · 30yr · 1.5% tax · 5.0% vac · 8.0% maint · 8.0% mgmt
Financing live
Cash to close
- Down payment
- $59,474
- Closing costs
- $7,137
- Reserves months
- —
- Total cash needed
- —
Loan-product check · same deal, 3 products live
Conventional
25% down · 7.5% · 30yr
- Down + closing
- —
- Monthly P&I
- —
- Monthly cashflow
- —
- DSCR
- —
- Eligible?
- —
Personal DTI + credit; lowest rate.
DSCR
20% down · 8.5% · 30yr
- Down + closing
- —
- Monthly P&I
- —
- Monthly cashflow
- —
- DSCR
- —
- Eligible?
- —
No personal income docs; deal must DSCR.
Hard money
10% down · 12.0% · 12mo
- Down + closing
- —
- Monthly P&I
- —
- Monthly cashflow
- —
- DSCR
- —
- Eligible?
- —
Short-term bridge; refi at stabilization.
Rent comps 40 comps
| Address | Beds | Baths | Sqft | Rent | $/sqft | DOM | Units | Dist |
|---|---|---|---|---|---|---|---|---|
| 5334 Hickory Pl San Antonio, TX | 3.0 | 2.0 | 1401 | $1,650 | $1.18 | 44d | 1 | 0.16mi |
| 5322 Flying Hooves San Antonio, TX | 3.0 | 2.5 | 1604 | $1,900 | $1.18 | 20d | 1 | 0.20mi |
| 5227 Hickory Pl San Antonio, TX | 3.0 | 2.0 | 1199 | $1,700 | $1.42 | 24d | 1 | 0.26mi |
| 5910 Sandy Lake St San Antonio, TX | 3.0 | 2.0 | 1389 | $2,100 | $1.51 | 44d | 1 | 0.27mi |
| 2911 Lakebriar St San Antonio, TX | 4.0 | 2.0 | 1440 | $1,695 | $1.18 | 3d | 1 | 0.28mi |
| 2911 Lakebriar St San Antonio, TX | 4.0 | 2.0 | 1440 | $1,695 | $1.18 | 22d | 1 | 0.28mi |
| 2610 Lakebriar St San Antonio, TX | 3.0 | 2.0 | 1724 | $1,675 | $0.97 | 44d | 1 | 0.46mi |
| 2718 Bermuda Dr San Antonio, TX | 3.0 | 3.0 | 1080 | $1,400 | $1.30 | 21d | 1 | 0.49mi |
| 2719 Bermuda Dr San Antonio, TX | 3.0 | 2.0 | 1298 | $1,364 | $1.05 | 5d | 1 | 0.51mi |
| 6023 Lake Victoria St San Antonio, TX | 3.0 | 2.0 | 1368 | $1,575 | $1.15 | 13d | 1 | 0.53mi |
| 3510 Bottomless Lk San Antonio, TX | 2.0 | 2.0 | 1068 | $1,150 | $1.08 | 44d | 1 | 0.54mi |
| 6115 Southern Vis San Antonio, TX | 3.0 | 2.0 | 1415 | $1,509 | $1.07 | 3d | 1 | 0.57mi |
| 6119 Southern Vis San Antonio, TX | 3.0 | 2.5 | 1246 | $1,685 | $1.35 | 24d | 1 | 0.57mi |
| 5338 Natho St San Antonio, TX | 3.0 | 2.0 | 1298 | $1,349 | $1.04 | 13d | 1 | 0.63mi |
| 5334 Natho St San Antonio, TX | 3.0 | 2.0 | 1298 | $1,325 | $1.02 | 5d | 1 | 0.63mi |
| 3535 Honey Mdw San Antonio, TX | 3.0 | 2.5 | 1438 | $1,400 | $0.97 | 17d | 1 | 0.64mi |
| 6123 Flower Mdw San Antonio, TX | 4.0 | 2.0 | 1800 | $1,795 | $1.00 | 44d | 1 | 0.66mi |
| 2434 Bermuda Dr San Antonio, TX | 3.0 | 2.0 | 1298 | $1,414 | $1.09 | 5d | 1 | 0.66mi |
| 2430 Bermuda Dr San Antonio, TX | 3.0 | 2.0 | 1298 | $1,390 | $1.07 | 13d | 1 | 0.67mi |
| 4226 Toledo Mist San Antonio, TX | 2.0 | 2.5 | 944 | $1,600 | $1.69 | 24d | 1 | 0.68mi |
| 6223 Still Mdw San Antonio, TX | 3.0 | 2.0 | 1330 | $1,650 | $1.24 | 5d | 1 | 0.69mi |
| 6147 Still Mdw San Antonio, TX | 3.0 | 2.0 | 1556 | $1,459 | $0.94 | 3d | 1 | 0.69mi |
| 2951 Lavender Mdw San Antonio, TX | 3.0 | 2.5 | 1246 | $1,530 | $1.23 | 13d | 1 | 0.74mi |
| 2906 Lavender Mdw San Antonio, TX | 3.0 | 2.5 | 1246 | $1,495 | $1.20 | 2d | 1 | 0.76mi |
| 6119 Lakefront St San Antonio, TX | 3.0 | 2.5 | 1246 | $1,495 | $1.20 | 44d | 1 | 0.76mi |
| 5365 Southcross Ranch Rd San Antonio, TX | 3.0 | 1.0–2.0 | 1568 | $85,000 | $54.21 | 2d | 1 | 0.78mi |
| 6307 Sloane Cv San Antonio, TX | 3.0 | 2.5 | 1416 | $1,510 | $1.07 | 21d | 1 | 0.82mi |
| 6323 Sinclair Rd San Antonio, TX | 3.0 | 2.0 | 1556 | $1,510 | $0.97 | 24d | 1 | 0.83mi |
| 6230 Lake Victoria St San Antonio, TX | 3.0 | 2.0 | 1205 | $1,465 | $1.22 | 3d | 1 | 0.84mi |
| 4734 Shale Cv San Antonio, TX | 3.0 | 2.0 | 1247 | $1,725 | $1.38 | 24d | 1 | 0.86mi |
| 3219 Begonia Bnd San Antonio, TX | 3.0 | 2.0 | 1552 | $1,500 | $0.97 | 5d | 1 | 0.88mi |
| 3239 Begonia Bnd San Antonio, TX | 3.0 | 2.0 | 1552 | $1,435 | $0.92 | 24d | 1 | 0.89mi |
| 3155 Begonia Bnd San Antonio, TX | 3.0 | 2.0 | 1552 | $1,495 | $0.96 | 13d | 1 | 0.91mi |
| 4910 Sandstone Way San Antonio, TX | 3.0 | 2.5 | 1849 | $1,750 | $0.95 | 22d | 1 | 0.91mi |
| 4910 Sandstone Way San Antonio, TX | 3.0 | 2.5 | 1850 | $1,750 | $0.95 | 4d | 1 | 0.91mi |
| 6427 Woodcliff Bnd San Antonio, TX | 3.0 | 2.5 | 1247 | $1,440 | $1.15 | 11d | 1 | 0.95mi |
| 3131 Rosalind Way San Antonio, TX | 3.0 | 2.5 | 1247 | $1,650 | $1.32 | 24d | 1 | 0.97mi |
| 5011 Blue Rnch San Antonio, TX | 3.0 | 2.5 | 1529 | $1,740 | $1.14 | 44d | 1 | 1.00mi |
| 5011 Jade Xing San Antonio, TX | 3.0 | 2.5 | 1239 | $1,590 | $1.28 | 44d | 1 | 1.03mi |
| 5107 Blue Rnch San Antonio, TX | 3.0 | 2.5 | 1529 | $1,740 | $1.14 | 24d | 1 | 1.04mi |
Listing history 16 events
-
2026-06-18days on market $212,540 Active 140 DOM
-
2026-06-17days on market $212,540 Active 139 DOM
-
2026-06-16days on market $212,540 Active 138 DOM
-
2026-06-15days on market $212,540 Active 137 DOM
-
2026-06-13days on market $212,540 Active 135 DOM
-
2026-06-09days on market $212,540 Active 131 DOM
-
2026-06-08days on market $212,540 Active 130 DOM
-
2026-06-07days on market $212,540 Active 129 DOM
-
2026-06-04days on market $212,540 Active 126 DOM
-
2026-06-03pricedays on market $212,540 Active 125 DOM
-
2026-06-02days on market $211,540 Active 124 DOM
-
2026-06-01days on market $211,540 Active 123 DOM
-
2026-05-31days on market $211,540 Active 122 DOM
-
2026-04-03price $211,540 747-char remark
Show marketing remark (747 chars)
The Selene is a thoughtfully designed two-story home that blends open living spaces with comfortable private areas. From the covered porch, you enter a welcoming foyer with a powder bath and staircase, leading into an open family room, dining area, and kitchen-ideal for everyday living and casual entertaining. A pantry and dedicated laundry room are conveniently located just off the main living area for added functionality. Upstairs, the primary bedroom offers a private retreat with a walk-in closet and en-suite bath. Two additional bedrooms share a full bath, with a linen closet nearby for extra storage. With its efficient layout, open-concept design, and practical spaces, the Selene supports an easy, approachable path to homeownership.
-
2026-02-12price $209,740 747-char remark
Show marketing remark (747 chars)
The Selene is a thoughtfully designed two-story home that blends open living spaces with comfortable private areas. From the covered porch, you enter a welcoming foyer with a powder bath and staircase, leading into an open family room, dining area, and kitchen-ideal for everyday living and casual entertaining. A pantry and dedicated laundry room are conveniently located just off the main living area for added functionality. Upstairs, the primary bedroom offers a private retreat with a walk-in closet and en-suite bath. Two additional bedrooms share a full bath, with a linen closet nearby for extra storage. With its efficient layout, open-concept design, and practical spaces, the Selene supports an easy, approachable path to homeownership.
-
2026-01-29$208,740 Active 747-char remark
Show marketing remark (747 chars)
The Selene is a thoughtfully designed two-story home that blends open living spaces with comfortable private areas. From the covered porch, you enter a welcoming foyer with a powder bath and staircase, leading into an open family room, dining area, and kitchen-ideal for everyday living and casual entertaining. A pantry and dedicated laundry room are conveniently located just off the main living area for added functionality. Upstairs, the primary bedroom offers a private retreat with a walk-in closet and en-suite bath. Two additional bedrooms share a full bath, with a linen closet nearby for extra storage. With its efficient layout, open-concept design, and practical spaces, the Selene supports an easy, approachable path to homeownership.
ⓘ Source: listings_history table (triggers on properties + properties_extension) + one-shot
backfill from property_details.listing_events for pre-trigger history.
Nearby sold comps map
Loading sold comps map…
Walkable amenities ~0.75 mi
Loading nearby amenities…
Taxation est. · year 1
- Rental income
- $20,638
- − Mortgage interest
- −$13,326
- − Property taxes
- −$3,568
- − Insurance
- −$1,189
- − Repairs & maintenance
- −$1,651
- − Management
- −$1,651
- − Depreciation
- −$6,921
- Taxable loss
- −$7,668
- Est. tax savings @ 24.0%
- +$1,840
- After-tax cash flow
- $-1,584/yr
For passive investors: Depreciation is non-cash, so a rental often shows a tax loss while cash-flowing — sheltering income. Rental losses are passive: they offset passive income freely, and up to $25,000/yr can offset ordinary (W-2) income if you actively participate and your MAGI is under $100k (phasing out to $0 by $150k); unused losses carry forward. On sale, claimed depreciation is recaptured at up to 25%, and gains may owe capital-gains tax (a 1031 exchange can defer both). Figures are a year-1 estimate at your 24.0% rate — not tax advice; consult a CPA.
Condition & rehab AI · 1 photo
The Selene Plan is a well-maintained two-story home with good condition and no visible repairs needed. It offers a good return on investment with updates that can significantly increase its resale and rental value.
Value-add opportunities
- Both Painting exterior and interior — Enhances curb appeal and interior aesthetics
- Both Landscaping improvements — Enhances curb appeal and adds value
- Both New flooring in bathrooms and kitchen — Improves functionality and aesthetics
- Both New windows and doors — Enhances energy efficiency and curb appeal
Renovation cost estimate screening
Value-add ROI direction
- Both Painting exterior and interior — Enhances curb appeal and interior aesthetics ↑
- Both Landscaping improvements — Enhances curb appeal and adds value ↑
- Both New flooring in bathrooms and kitchen — Improves functionality and aesthetics ↑
- Both New windows and doors — Enhances energy efficiency and curb appeal ↑
ⓘ Cost ranges are severity-bucket heuristics (US national rule-of-thumb). Get contractor quotes + a written scope before underwriting a rehab budget.
Schools (NCES district)
- District
- East Central ISD
- NCES district ID
- 4817850
- Math proficiency
- 16% ▼ -12.00%
- Reading proficiency
- 25% ▼ -6.00%
- Median HH income
- $53,941
- Composite
- 18.67/100
- National rank
- #8887
- State rank
- #758 of 826 in TX
Livability — San Antonio
- Score
- 80/100
- State rank
- #31
- US rank
- #1616
Category grades
Schools grade is shown separately in the Schools card above.
Census & demographics
- Census place
- San Antonio, TX
- County
- Bexar County · 1,990,555 people
- City population
- 1,806,925
- Metro
- San Antonio-New Braunfels, TX
- Population (ZIP)
- 26,476
- Household income
- $66,362
- Rent vs Own
- Severe rent burden
- 686.0
Population outlook (Bexar County) Hauer SSP2
- Today (2025)
- 2,336,851 people
- By 2030
- 2,560,728 · +9.6%
- By 2040
- 3,020,569 · +29.3%
- By 2050
- 3,493,522 · +49.5%
- By 2075
- 4,668,459 · +99.8%
- By 2100
- 5,533,242 · +136.8%
Race, ethnicity, and origin ACS 2023
- Neighborhood character
- Majority Hispanic (64%)
- Race & ethnicity
- Hispanic / Latino 64% Two or more races 26% White 19% Black 14% Asian 1%
- Hispanic origin (detail)
- Mexican 55%
- Common ancestry
- Romanian 1% Italian 1% Slovak 1%
- Foreign-born
- 14% · Canada
- Languages at home
- 61% English-only · Spanish 37% Arabic 1%
Political lean MEDSL · Bexar
- 2024 margin
- Lean D (+9.8) · D 54.3% · R 44.6% · Other 1.1%
- 2008→2024 swing
- +4.2pp toward D · 2008: 5.6pp · 2024: 9.8pp
- All cycles
- 2024: D+9.8 2020: D+18.2 2016: D+13.5 2012: D+4.6 2008: D+5.6
Not yet ingested
- Civics
- —
Market trends
- HPI YoY
- ▼ -14.18%
- Current HPI
- 278.8429
- Rent YoY
- ▲ 4.35%
- Metro
- San Antonio-New Braunfels, TX
- State GDP YoY
- ▲ 3.95%
- F500 in state
- 110
Industry mix (Fortune 500 HQ in TX)
| Industry | F500 HQs | Revenue |
|---|---|---|
| Energy | 16 | $1,198B |
|
||
| Technology | 5 | $198B |
|
||
| Engineering / Construction | 4 | $72B |
|
||
| Energy Services | 3 | $60B |
|
||
| Utilities | 3 | $41B |
|
||
| Healthcare | 2 | $330B |
|
||
Price history
+1.3% since first listed3 events — show timeline
- 2026-04-03 Price Changed $211,540 Zillow
- 2026-02-12 Price Changed $209,740 Zillow
- 2026-01-29 Listed $208,740 Zillow
Cash-flow waterfall
monthlySold comps — $/sqft
last 12 mo · ≤1 miLoading sold comps…