 Duplex
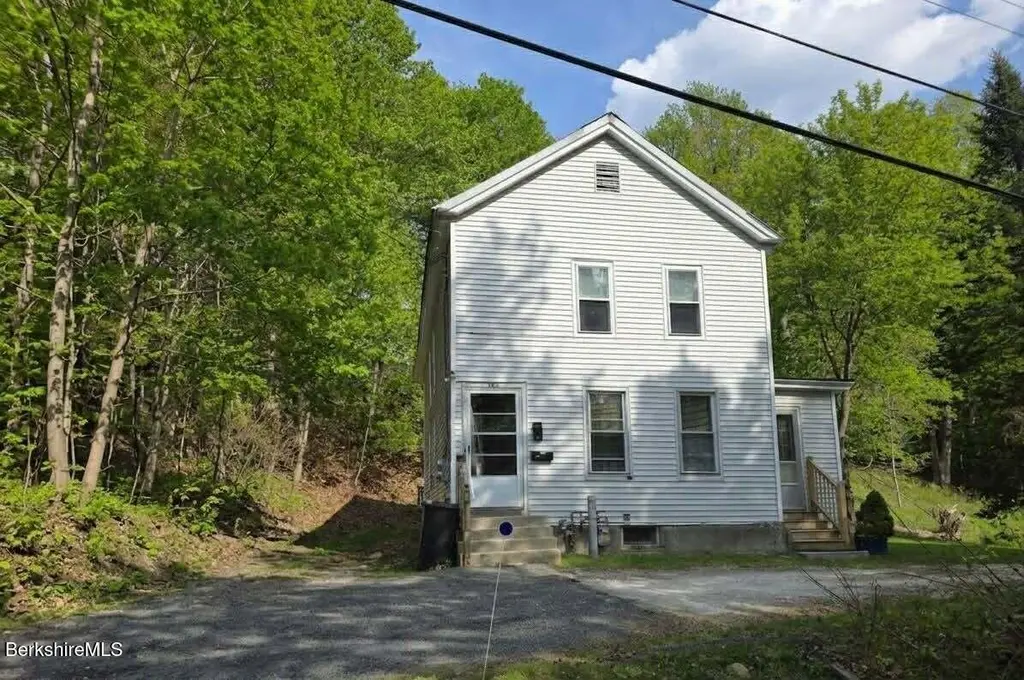
168 Prospect St · North Adams, MA
Flood risk 1/10 · Minimal
- FEMA flood zone
- X
- Chance of flooding over 30 yrs
- 0.0%
- Est. flood insurance / yr
- $473 – $860
Fire risk 1/10 · Minimal
- Est. fire insurance / yr
- $915 – $1,699
Heat risk 2/10 · Minimal
- Hot days now (above 92°F)
- 9 days/yr
- Hot days in 30 yrs
- 20 days/yr
Wind risk 4/10 · Minor
- Chance of severe wind over 30 yrs
- 8.0%
Air-quality risk 2/10 · Minimal
- Unhealthy air days now
- 0 days/yr
- Unhealthy air days in 30 yrs
- 1 days/yr
Risk factors via First Street. Map © Google.
Why this score? — see what drove the C+ grade
The composite is a weighted blend of 9 inputs, each scored 0–100. Each bar is that input's sub-score; the figure is the points it added to the 100-point composite (weight × sub-score).
- Cash flow +30.0/30.0
- DSCR +10.0/10.0
- 1% rule +8.7/10.0
- Livability +2.8/5.0
- Rent growth +2.5/5.0
- Condition / age +2.5/5.0
- Appreciation +1.9/10.0
- Schools +1.8/10.0
- ARV discount +1.2/15.0
$189,900
🖨 Deal sheet 📄 Offer letter ✓ Due diligence
Multi-family units
County records classify this as Multi-Family (2-4 Unit). Listing-text estimate: 2 units. confirmed
Listing remarks MLS
Good investment/income opportunity on this foreclosure selling ''AS IS''. Two family, 8 room colonial, 4 BD 2 BA, 200 AMP elec. PLEASE NOTE...The Grantee(s), or purchaser(s), of the Property may not re-sell, record an additional conveyance document, or otherwise transfer title to the Property within 60 days following the Grantor’s execution of this Deed.
Key facts
- Private feel
- Water heater
- Large yard
Tags
Property features AI
Finance
- Financial info: Annual taxes reported (2025)
Exterior
- Utilities: Electric with circuit breakers and individual meters; Public sewer
- Home design: Property at 168 Prospect St, North Adams, MA
- Construction: Slate and asphalt roof; Total building area approximately 1458
Interior
- Bedrooms: One-bedroom unit (long-time tenant)
- Flooring: Carpet; Linoleum; Wood
- Bathrooms: Two full bathrooms on the property; One bathroom in the listed unit
- Heating & cooling: Natural gas heating
- Interior features: Carpet, linoleum, and wood flooring
Neighborhood map
What this means for you Summary
Snapshot
- This is a 2 × 3-bed/2.0-bath units multifamily listed at $190k.
Deal economics
- At list price, monthly cash flow is $758 ($9k/yr) — positive. Per door: $379/mo.
- The deal already cash-flows at list — no discount required.
- Meets the 1% rule at list price ($3k rent vs $190k).
- Recommended offer: $184k (3.0% below list) — sets the bar for market timing.
- Cap rate 11.1% vs local median 5.8% in North Adams — top-decile yield for the area; either an underpriced asset or a hidden risk that comps aren't pricing in. Stress-test before assuming the spread holds.
Location & tenants
- Location reads 55/100 on livability (#242 in MA) — a working-class tenant base; expect higher turnover. Strengths: housing A+, cost of living A-; Watch: employment C-, health & safety D, crime F.
- North Adams (town): math 14% / reading 29% proficiency, ranked #291 of 302 in MA (top 96%) — low school quality limits family demand, transient renter base, plan for 1-2y turnover.
- Zoned schools: Colegrove Park Elementary (math 8% / reading 37%, grade F, #753 of 938 statewide, top 81%, 235 students, 0% FRL); Drury High (math 16% / reading 24%, grade F, #308 of 343 statewide, top 91%, 493 students, 0% FRL) — zoned schools average 0% FRL vs 53% district-wide (53 pts lower); this property's tenant base skews higher-income than the district average.
- Market conditions: 99 active listings in the ZIP; 1 comparable units currently listed for rent nearby; 130 units permitted in Berkshire County in 2024 (10 in 5+ unit buildings).
Forward outlook
- Local home prices are declining (-3.0%/yr); year-one equity from $1k of loan paydown is wiped out by about $6k of value loss. Plan a longer hold.
- Berkshire County population projected at -24% by 2050 — secular population decline; favor cash flow + early exit over multi-decade hold.
- At projected returns (-3.0% appreciation + 3.0% rent growth), your $53k cash investment doubles in ~7 years — after that, you're playing with house money.
Negotiation context
- It's been on market 43 days — a 3% lower offer ($184k) is reasonable based on typical stale-listing flexibility.
- 4 sale attempts since 20y ago; this cycle's ask has dropped $10k (5%) from the opening price — seller is motivated, your offer sets the floor, not the list.
- Current owner paid $25k; list at $190k implies a 660% gain — meaningful room to come down on a strong offer.
Risks & watch-outs
- Watch-outs: built in 1880 — expect roof / HVAC / electrical / plumbing capex.
Questions for the listing agent
- It's been on market 43 days. Have you received any prior offers? Is the seller open to a 3% concession, seller financing, or rate buy-down credit?
- Can we see the unit-by-unit rent roll, current vacancy, and any below-market leases? What's the average tenancy length?
- What capital expenditures (roof, boiler, parking lot, exteriors) have been made in the last 5 years, and what's planned in the next 2?
- Built in 1880 — when were the roof, HVAC, electrical panel, plumbing, and water heater last replaced?
- Is there a deadline driving the sale (1031 exchange, divorce, estate, relocation)? That informs how much negotiation room exists.
- Schools are F-rated, which usually means shorter tenancies and higher turnover. Who's the typical renter profile here, and what's been the actual vacancy rate?
- Crime grade is F in this area — have there been break-ins, vandalism, or insurance claims at this property in the last 3 years? What carrier currently insures it and at what premium?
- What's the average days-on-market for RENTAL listings here right now (not sales)? A rising rental-DOM trend means longer vacancies and softer asking-rent achievability than the comps imply.
- What's the recent tenant-quality profile in this submarket — average credit score on applications, eviction rate, late-payment / NSF rate, and stable-employment percentage? A property-management company in the area should have these aggregated.
- How much new apartment / multifamily construction is in the pipeline within 1–3 miles? Heavy new supply (>2% of stock underway) typically softens rents 12–24 months out; light construction supports rent growth.
Investment metrics
- 1% rule
- 1.37% ✓
- Cap rate
- 11.08%
- Cash-on-cash
- 17.10%
- DSCR
- 1.76
- GRM
- 6.1
CMA / ARV
- ARV (median comp)
- $166,519
- List price
- $189,900
- Delta
- 14.04%
- Verdict
- OVERPRICED
- Comps
- 16 within 1.0 mi
Show comp detail 1 sale within ~0.75 mi
| Address | Dist | Beds/Ba | Sqft | Sold | Price | $/sf | Match |
|---|---|---|---|---|---|---|---|
| 99 Meadow St | 0.63mi | 4/2.0 | 1,555 (+7%) | 10mo | $163,000 | $105 | 49 |
Match score weights: distance 35% · size 25% · config 20% · recency 20%. Top-matched comps best support the ARV.
Projected returns pro-forma
-3.0% appreciation · 3.0% rent growth · sell at horizon
- IRR
- 8.4%
- Equity multiple
- 1.33×
- Total profit
- $17,525
- Equity at exit
- $28,315
- IRR
- 17.6%
- Equity multiple
- 2.46×
- Total profit
- $77,532
- Equity at exit
- $16,419
Cash invested: $53,172 (down + closing). Projections, not guarantees.
Landlord ↔ Tenant lean methodology
- Overall (STATE)
- 20 Strongly Tenant-Friendly
- State Massachusetts
- 20 Strongly Tenant-Friendly · D+15
- County
- — inherits STATE
- City
- — inherits STATE
ZIP-level market 01247
- Home prices YoY
- -2.0%
- Active inventory
- 99
- Price-to-rent
- 12.2×
Monthly cashflow live
- Estimated rent
- $2,600 medium interval (Pro) →
- Mortgage (P&I)
- −$996
- Tax from tax record
- −$221 /mo · $2,654/yr
- Insurance
- −$79
- HOA
- −$0
- Vacancy / Maint / Mgmt
- −$546
- Net cashflow
- $758
Break-even live
2-unit breakdown (identical units grouped — click to expand)
| Units | Beds | Baths | Est. rent |
|---|---|---|---|
| 2× units | 3 | 2 | $2,600 |
| #1 | 3 | 2 | $1,300 |
| #2 | 3 | 2 | $1,300 |
| Total (2 units) | $2,600 | ||
UW: 25.0% down · 7.5% · 30yr · 1.5% tax · 5.0% vac · 8.0% maint · 8.0% mgmt
Financing live
Cash to close
- Down payment
- $47,475
- Closing costs
- $5,697
- Reserves months
- —
- Total cash needed
- —
Loan-product check · same deal, 3 products live
Conventional
25% down · 7.5% · 30yr
- Down + closing
- —
- Monthly P&I
- —
- Monthly cashflow
- —
- DSCR
- —
- Eligible?
- —
Personal DTI + credit; lowest rate.
DSCR
20% down · 8.5% · 30yr
- Down + closing
- —
- Monthly P&I
- —
- Monthly cashflow
- —
- DSCR
- —
- Eligible?
- —
No personal income docs; deal must DSCR.
Hard money
10% down · 12.0% · 12mo
- Down + closing
- —
- Monthly P&I
- —
- Monthly cashflow
- —
- DSCR
- —
- Eligible?
- —
Short-term bridge; refi at stabilization.
Rent comps 1 comps
| Address | Beds | Baths | Sqft | Rent | $/sqft | DOM | Units | Dist |
|---|---|---|---|---|---|---|---|---|
| 40 Cady St North Adams, MA | 3.0 | 1.5 | 1467 | $2,475 | $1.69 | 43d | 1 | 0.77mi |
Listing history 27 events
-
2026-06-18days on market $189,900 Active 43 DOM
-
2026-06-17days on market $189,900 Active 42 DOM
-
2026-06-16days on market $189,900 Active 41 DOM
-
2026-06-15days on market $189,900 Active 40 DOM
-
2026-06-13days on market $189,900 Active 38 DOM
-
2026-06-12days on market $189,900 Active 37 DOM
-
2026-06-09days on market $189,900 Active 34 DOM
-
2026-06-09price $189,900 Active 33 DOM
-
2026-06-08days on market $199,900 Active 33 DOM
-
2026-06-07days on market $199,900 Active 32 DOM
-
2026-06-07days on market $199,900 Active 31 DOM
-
2026-06-04days on market $199,900 Active 28 DOM
-
2026-06-02days on market $199,900 Active 27 DOM
-
2026-06-01days on market $199,900 Active 26 DOM
-
2026-05-31days on market $199,900 Active 25 DOM
-
2026-05-31days on market $199,900 Active 24 DOM
-
2026-05-06$199,900 Active 502-char remark
-
2017-12-31historical
-
2017-06-20$89,900
-
2012-08-30soldstatus $25,000
Show marketing remark (362 chars)
Good investment/income opportunity on this foreclosure selling ''AS IS''. Two family, 8 room colonial, 4 BD 2 BA, 200 AMP elec. PLEASE NOTE...The Grantee(s), or purchaser(s), of the Property may not re-sell, record an additional conveyance document, or otherwise transfer title to the Property within 60 days following the Grantor’s execution of this Deed.
-
2012-06-12$39,900
Show marketing remark (362 chars)
Good investment/income opportunity on this foreclosure selling ''AS IS''. Two family, 8 room colonial, 4 BD 2 BA, 200 AMP elec. PLEASE NOTE...The Grantee(s), or purchaser(s), of the Property may not re-sell, record an additional conveyance document, or otherwise transfer title to the Property within 60 days following the Grantor’s execution of this Deed.
-
2006-10-27soldstatus $95,000
-
2006-10-27soldstatus $95,000
-
2006-10-26soldstatus $95,000
-
2006-08-23$108,900
-
2005-06-09soldstatus $49,000
-
1990-07-18soldstatus $55,000
ⓘ Source: listings_history table (triggers on properties + properties_extension) + one-shot
backfill from property_details.listing_events for pre-trigger history.
Tax reassessment forecast MA · Partial reset (capped growth)
- Current annual tax
- $2,654 · $221/mo
- Projected year-2 tax
- $2,654 · $221/mo
- Expected delta
- $0/yr ($0/mo · 0.0%)
ⓘ Screening estimate from a state-policy table — verify with the county assessor before closing.
Climate risk First Street
- Flood 1/10 Low FEMA zone X · 0% chance over 30 yrs
- Wildfire 1/10 Low
- Heat 2/10 Low 9 d/yr ≥92°F today · 20 d/yr by 30 yrs out
- Wind 4/10 Moderate 8% chance of damaging wind over 30 yrs
- Air quality 2/10 Low 0 unhealthy d/yr today · 1 by 30 yrs out
Nearby sold comps map
Loading sold comps map…
Walkable amenities ~0.75 mi
Loading nearby amenities…
Taxation est. · year 1
- Rental income
- $31,200
- − Mortgage interest
- −$10,637
- − Property taxes
- −$2,654
- − Insurance
- −$950
- − Repairs & maintenance
- −$2,496
- − Management
- −$2,496
- − Depreciation
- −$5,524
- Taxable income
- $6,443
- Est. tax owed @ 24.0%
- −$1,546
- After-tax cash flow
- $7,548/yr
For passive investors: Depreciation is non-cash, so a rental often shows a tax loss while cash-flowing — sheltering income. Rental losses are passive: they offset passive income freely, and up to $25,000/yr can offset ordinary (W-2) income if you actively participate and your MAGI is under $100k (phasing out to $0 by $150k); unused losses carry forward. On sale, claimed depreciation is recaptured at up to 25%, and gains may owe capital-gains tax (a 1031 exchange can defer both). Figures are a year-1 estimate at your 24.0% rate — not tax advice; consult a CPA.
Schools (NCES district)
- District
- North Adams
- NCES district ID
- 2508670
- Math proficiency
- 14% ▼ -13.00%
- Reading proficiency
- 29% ▼ -11.00%
- Median HH income
- $36,746
- Composite
- 17.83/100
- National rank
- #9006
- State rank
- #291 of 302 in MA
Livability — North Adams
- Score
- 55/100
- State rank
- #242
- US rank
- #23506
Category grades
Schools grade is shown separately in the Schools card above.
Census & demographics
- Census place
- North Adams, MA
- City population
- 14,967
- Population (ZIP)
- 14,967
Population outlook (Berkshire County) Hauer SSP2
- Today (2025)
- 119,723 people
- By 2030
- 114,608 · -4.3%
- By 2040
- 102,806 · -14.1%
- By 2050
- 91,305 · -23.7%
- By 2075
- 71,517 · -40.3%
- By 2100
- 57,988 · -51.6%
Race, ethnicity, and origin ACS 2023
- Neighborhood character
- Predominantly White (88%)
- Race & ethnicity
- White 88% Hispanic / Latino 5% Two or more races 4% Asian 3%
- Hispanic origin (detail)
- Puerto Rican 1%
- Common ancestry
- Lithuanian 15% Romanian 4% German 2%
- Foreign-born
- 5% · Canada
- Languages at home
- 95% English-only · Other Indo-European 2% Spanish 2% French/Haitian/Cajun 0%
Political lean MEDSL · Berkshire
- 2024 margin
- Solid D (+39.9) · D 68.9% · R 29.0% · Other 2.1%
- 2008→2024 swing
- -12.5pp toward R · 2008: 52.4pp · 2024: 39.9pp
- All cycles
- 2024: D+39.9 2020: D+47.1 2016: D+41.5 2012: D+53.7 2008: D+52.4
Not yet ingested
- Civics
- —
Market trends
- HPI YoY
- ▼ -6.22%
- Current HPI
- 298.8949
- Rent YoY
- —
- Metro
- —
- State GDP YoY
- ▲ 2.28%
- F500 in state
- 38
Industry mix (Fortune 500 HQ in MA)
| Industry | F500 HQs | Revenue |
|---|---|---|
| Technology | 3 | $17B |
|
||
| Insurance | 2 | $84B |
|
||
| Retail | 2 | $76B |
|
||
| Life Sciences | 1 | $43B |
|
||
| Energy Technology | 1 | $31B |
|
||
| Aerospace / Defense | 1 | $18B |
|
||
Price history
+245.3% since first listed12 events — show timeline
- 2026-06-09 Price Changed $189,900 BCMLS
- 2026-05-06 Listed $199,900 BCMLS
- 2017-12-31 Listing Removed — BCMLS
- 2017-06-20 Listed $89,900 BCMLS
- 2012-08-30 Sold (MLS) $25,000 BCMLS
- 2012-06-12 Listed $39,900 BCMLS
- 2006-10-27 Sold (Public Records) $95,000 Public Records
- 2006-10-27 Sold (Public Records) $95,000 Public Records
- 2006-10-26 Sold (MLS) $95,000 BCMLS
- 2006-08-23 Listed $108,900 BCMLS
- 2005-06-09 Sold (Public Records) $49,000 Public Records
- 1990-07-18 Sold (Public Records) $55,000 Public Records
Property tax history
+4.4%/yrLatest (2023): $2,654 · +2.1% YoY. Source: county tax records.
Cash-flow waterfall
monthlySold comps — $/sqft
last 12 mo · ≤1 miLoading sold comps…