 Multi-family
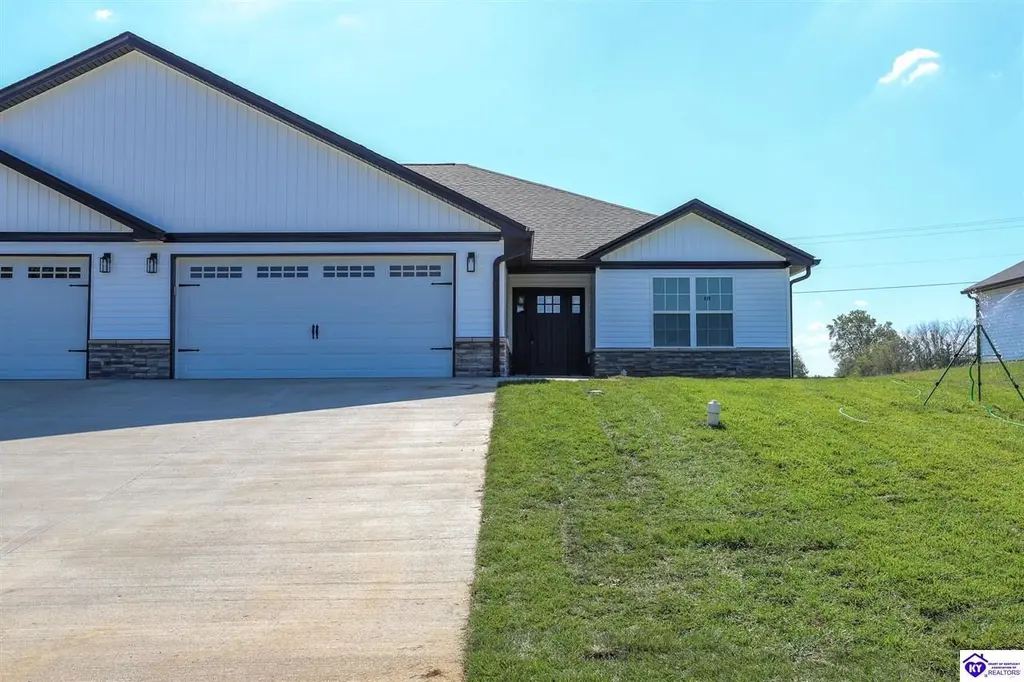
838 Otter Creek Rd · Vine Grove, KY
Flood risk No data
- FEMA flood zone
- —
- Chance of flooding over 30 yrs
- —
- Est. flood insurance / yr
- —
Fire risk No data
- Est. fire insurance / yr
- —
Heat risk No data
- Hot days now (above threshold)
- —
- Hot days in 30 yrs
- —
Wind risk No data
- Chance of severe wind over 30 yrs
- —
Air-quality risk No data
- Unhealthy air days now
- —
- Unhealthy air days in 30 yrs
- —
Risk factors via First Street. Map © Google.
Why this score? — see what drove the C grade
The composite is a weighted blend of 9 inputs, each scored 0–100. Each bar is that input's sub-score; the figure is the points it added to the 100-point composite (weight × sub-score).
- Cash flow +24.9/30.0
- DSCR +8.1/10.0
- ARV discount +6.7/15.0
- 1% rule +6.5/10.0
- Condition / age +4.0/5.0
- Livability +3.6/5.0
- Schools +3.2/10.0
- Rent growth +2.5/5.0
- Appreciation +0.0/10.0
$289,900
🖨 Deal sheet 📄 Offer letter ✓ Due diligence
Multi-family units
County records classify this as Multi-Family (2-4 Unit). Listing-text estimate: 1 unit. estimate disagrees with records
Listing remarks
* * Stunning Contemporary Home with an Open Concept Design * * New construction! This beautifully crafted home offers an inviting open concept, split bedroom floor plan that effortlessly marries style and function. Bathed in natural light from generous windows throughout, every corner of this residence radiates warmth and welcomes you inside. As you enter, you'll be greeted by a spacious foyer leading into the heart of the home — a large great room with a fireplace and a kitchen designed for both culinary delights and entertaining. Featuring granite countertops, contemporary black fixtures, a tile back splash, an island, pantry and a full appliance package. The split bedroom layout
Key facts
- Natural light
- Open concept design
- Granite countertops
Tags
Property features AI
Finance
- HOA & community: No association fee
Exterior
- Parking: Attached 2-car garage
- Utilities: Electricity connected; Heat pump heating
- Home design: Single-family residence; One-story; Built in 2025; Entry at the front
- Construction: Vinyl siding and stone exterior; Shingle roof
- Exterior features: Lot is 0.25 acres
Interior
- Kitchen: First-floor kitchen; First-floor dining room
- Bedrooms: Three bedrooms, all on the first floor; Primary bedroom on the first floor
- Bathrooms: Two full bathrooms; Primary bathroom on the first floor
- Interior features: Seven total rooms; No basement
- Laundry & utility: First-floor laundry
Neighborhood map
What this means for you Summary
Snapshot
- This is a 3-bed/2.0-bath multifamily listed at $290k. Condition is rated good.
Deal economics
- At list price, monthly cash flow is $621 ($7k/yr) — positive.
- The deal already cash-flows at list — no discount required.
- Meets the 1% rule at list price ($3k rent vs $290k).
- Cap rate 8.9% vs local median 4.0% in Vine Grove — top-decile yield for the area; either an underpriced asset or a hidden risk that comps aren't pricing in. Stress-test before assuming the spread holds.
Location & tenants
- Location reads 72/100 on livability (#124 in KY) — a middle-class / working-renter tenant base. Strengths: crime A+, cost of living A+, housing A+; Watch: amenities F, commute F, health & safety F.
- Hardin County (suburban): math 30% / reading 43% proficiency, ranked #47 of 165 in KY (top 28%) — families likely to look elsewhere, expect single-tenant / working-renter base with shorter leases.
- Market conditions: 155 active listings in the ZIP; 1 comparable units currently listed for rent nearby; 946 units permitted in Hardin County in 2024 (464 in 5+ unit buildings).
Forward outlook
- Local home prices are declining (-3.0%/yr); year-one equity from $2k of loan paydown is wiped out by about $9k of value loss. Plan a longer hold.
- Hardin County population projected at -16% by 2050 — secular population decline; favor cash flow + early exit over multi-decade hold.
Negotiation context
- Only 2 days on market — expect competitive offers; lowballing is unlikely to land.
Questions for the listing agent
- Is there a deadline driving the sale (1031 exchange, divorce, estate, relocation)? That informs how much negotiation room exists.
- What's the average days-on-market for RENTAL listings here right now (not sales)? A rising rental-DOM trend means longer vacancies and softer asking-rent achievability than the comps imply.
- What's the recent tenant-quality profile in this submarket — average credit score on applications, eviction rate, late-payment / NSF rate, and stable-employment percentage? A property-management company in the area should have these aggregated.
- How much new apartment / multifamily construction is in the pipeline within 1–3 miles? Heavy new supply (>2% of stock underway) typically softens rents 12–24 months out; light construction supports rent growth.
Investment metrics
- 1% rule
- 1.15% ✓
- Cap rate
- 8.86%
- Cash-on-cash
- 9.18%
- DSCR
- 1.41
- GRM
- 7.3
CMA / ARV
- ARV (on-the-fly)
- $285,075
- Comps found
- 3
Show comp detail 3 sales within ~0.75 mi
| Address | Dist | Beds/Ba | Sqft | Sold | Price | $/sf | Match |
|---|---|---|---|---|---|---|---|
| 828 Otter Creek Rd | 0.05mi | 3/2.0 | 1,575 (0%) | 14mo | $285,000 | $181 | 86 |
| 832 Otter Creek Rd | 0.03mi | 3/2.0 | 1,575 (0%) | 21mo | $289,900 | $184 | 81 |
| 824 Otter Creek Rd | 0.08mi | 3/3.0 | 1,800 (+14%) | 7mo | $306,000 | $170 | 63 |
Match score weights: distance 35% · size 25% · config 20% · recency 20%. Top-matched comps best support the ARV.
Projected returns pro-forma
-3.0% appreciation · 3.0% rent growth · sell at horizon
- IRR
- -2.4%
- Equity multiple
- 0.91×
- Total profit
- $-7,378
- Equity at exit
- $43,225
- IRR
- 7.3%
- Equity multiple
- 1.55×
- Total profit
- $44,704
- Equity at exit
- $25,065
Cash invested: $81,172 (down + closing). Projections, not guarantees.
Landlord ↔ Tenant lean methodology
- Overall (STATE)
- 83 Strongly Landlord-Friendly
- State Kentucky
- 83 Strongly Landlord-Friendly · R+16
- County
- — inherits STATE
- City
- — inherits STATE
ZIP-level market 40175
- Home prices YoY
- -6.3%
- Active inventory
- 155
- Price-to-rent
- 14.5×
Monthly cashflow live
- Estimated rent
- $3,322 medium interval (Pro) →
- Mortgage (P&I)
- −$1,520
- Tax est. 1.5%
- −$362 /mo · $4,348/yr
- Insurance
- −$121
- HOA
- −$0
- Vacancy / Maint / Mgmt
- −$698
- Net cashflow
- $621
Break-even live
2-unit breakdown (identical units grouped — click to expand)
| Units | Beds | Baths | Est. rent |
|---|---|---|---|
| 2× units | 3 | 2 | $3,322 |
| #1 | 3 | 2 | $1,661 |
| #2 | 3 | 2 | $1,661 |
| Total (2 units) | $3,322 | ||
UW: 25.0% down · 7.5% · 30yr · 1.5% tax · 5.0% vac · 8.0% maint · 8.0% mgmt
Financing live
Cash to close
- Down payment
- $72,475
- Closing costs
- $8,697
- Reserves months
- —
- Total cash needed
- —
Loan-product check · same deal, 3 products live
Conventional
25% down · 7.5% · 30yr
- Down + closing
- —
- Monthly P&I
- —
- Monthly cashflow
- —
- DSCR
- —
- Eligible?
- —
Personal DTI + credit; lowest rate.
DSCR
20% down · 8.5% · 30yr
- Down + closing
- —
- Monthly P&I
- —
- Monthly cashflow
- —
- DSCR
- —
- Eligible?
- —
No personal income docs; deal must DSCR.
Hard money
10% down · 12.0% · 12mo
- Down + closing
- —
- Monthly P&I
- —
- Monthly cashflow
- —
- DSCR
- —
- Eligible?
- —
Short-term bridge; refi at stabilization.
Rent comps 1 comps
| Address | Beds | Baths | Sqft | Rent | $/sqft | DOM | Units | Dist |
|---|---|---|---|---|---|---|---|---|
| 811 Cedarcrest Dr Vine Grove, KY | 4.0 | 2.0 | 1674 | $1,850 | $1.11 | 44d | 1 | 0.62mi |
Listing history 22 events
-
2026-06-19days on market $289,900 Active 2 DOM
-
2026-06-18days on market $289,900 Active 1 DOM
-
2026-06-17days on market $289,900 Active 12 DOM
-
2026-06-16days on market $289,900 Active 11 DOM
-
2026-06-15days on market $289,900 Active 10 DOM
-
2026-06-15days on market $289,900 Active 7 DOM
-
2026-06-14days on market $289,900 Active 5 DOM
-
2026-06-13days on market $289,900 Active 4 DOM
-
2026-06-10days on market $289,900 Active 2 DOM
-
2026-06-09days on market $289,900 Active 1 DOM
-
2026-06-08days on market $289,900 Active 150 DOM
-
2026-06-07days on market $289,900 Active 149 DOM
-
2026-06-03days on market $289,900 Active 145 DOM
-
2026-06-02days on market $289,900 Active 144 DOM
-
2026-06-01days on market $289,900 Active 143 DOM
-
2026-05-31days on market $289,900 Active 142 DOM
-
2026-05-30days on market $289,900 Active 141 DOM
-
2026-01-09$289,900 Active
-
2025-10-06price $289,900
-
2025-10-06price $289,900
-
2025-08-28price $294,900
-
2025-08-28price $294,900
ⓘ Source: listings_history table (triggers on properties + properties_extension) + one-shot
backfill from property_details.listing_events for pre-trigger history.
Nearby sold comps map
Loading sold comps map…
Walkable amenities ~0.75 mi
Loading nearby amenities…
Taxation est. · year 1
- Rental income
- $39,864
- − Mortgage interest
- −$16,239
- − Property taxes
- −$4,348
- − Insurance
- −$1,450
- − Repairs & maintenance
- −$3,189
- − Management
- −$3,189
- − Depreciation
- −$8,433
- Taxable income
- $3,015
- Est. tax owed @ 24.0%
- −$724
- After-tax cash flow
- $6,728/yr
For passive investors: Depreciation is non-cash, so a rental often shows a tax loss while cash-flowing — sheltering income. Rental losses are passive: they offset passive income freely, and up to $25,000/yr can offset ordinary (W-2) income if you actively participate and your MAGI is under $100k (phasing out to $0 by $150k); unused losses carry forward. On sale, claimed depreciation is recaptured at up to 25%, and gains may owe capital-gains tax (a 1031 exchange can defer both). Figures are a year-1 estimate at your 24.0% rate — not tax advice; consult a CPA.
Condition & rehab AI · 12 photos
This new construction home offers a modern and open concept design with high-quality finishes and systems. It is move-in ready and has the potential for further value-adding improvements.
Value-add opportunities
- Both Landscaping and curb appeal improvements — Enhances the home's curb appeal and can attract more buyers or renters.
- Both Add a smart home system — Improves convenience and energy efficiency, appealing to modern buyers and renters.
- Both Install smart lighting — Enhances the home's curb appeal and can attract more buyers or renters.
- Both Add a smart thermostat — Improves convenience and energy efficiency, appealing to modern buyers and renters.
Renovation cost estimate screening
Value-add ROI direction
- Both Landscaping and curb appeal improvements — Enhances the home's curb appeal and can attract more buyers or renters. ↑
- Both Add a smart home system — Improves convenience and energy efficiency, appealing to modern buyers and renters. ↑
- Both Install smart lighting — Enhances the home's curb appeal and can attract more buyers or renters. ↑
- Both Add a smart thermostat — Improves convenience and energy efficiency, appealing to modern buyers and renters. ↑
ⓘ Cost ranges are severity-bucket heuristics (US national rule-of-thumb). Get contractor quotes + a written scope before underwriting a rehab budget.
Schools (NCES district)
- District
- Hardin County
- NCES district ID
- 2102490
- Math proficiency
- 30% ▼ -13.00%
- Reading proficiency
- 43% ▼ -10.00%
- Median HH income
- $50,728
- Composite
- 31.61/100
- National rank
- #5945
- State rank
- #47 of 165 in KY
Livability — Vine Grove
- Score
- 72/100
- State rank
- #124
- US rank
- #5837
Category grades
Schools grade is shown separately in the Schools card above.
Census & demographics
- Census place
- Vine Grove, KY
- Population (ZIP)
- 16,283
Population outlook (Hardin County) Hauer SSP2
- Today (2025)
- 105,573 people
- By 2030
- 103,563 · -1.9%
- By 2040
- 97,077 · -8.0%
- By 2050
- 88,367 · -16.3%
- By 2075
- 65,405 · -38.0%
- By 2100
- 42,245 · -60.0%
Race, ethnicity, and origin ACS 2023
- Neighborhood character
- Predominantly White (81%)
- Race & ethnicity
- White 81% Black 9% Two or more races 7% Hispanic / Latino 2% Asian 2%
- Common ancestry
- Italian 2% Slovak 2% Serbian 1%
- Foreign-born
- 3% · South Korea, Canada
- Languages at home
- 95% English-only · Spanish 2% Tagalog/Filipino 1% German/W. Germanic 1%
Political lean MEDSL · Hardin
- 2024 margin
- Strong R (+29.3) · D 34.5% · R 63.8% · Other 1.7%
- 2008→2024 swing
- -8.7pp toward R · 2008: -20.6pp · 2024: -29.3pp
- All cycles
- 2024: R+29.3 2020: R+24.0 2016: R+30.2 2012: R+20.8 2008: R+20.6
Not yet ingested
- Civics
- —
Market trends
- HPI YoY
- ▼ -16.55%
- Current HPI
- 246.3715
- Rent YoY
- —
- Metro
- —
- State GDP YoY
- ▲ 1.81%
- F500 in state
- 4
Industry mix (Fortune 500 HQ in KY)
| Industry | F500 HQs | Revenue |
|---|---|---|
| Healthcare | 1 | $118B |
|
||
| Food / Beverage | 1 | $7B |
|
||
Price history
-1.7% since first listed5 events — show timeline
- 2026-01-09 Listed $289,900 Metro Search MLS
- 2025-10-06 Price Changed $289,900 Metro Search MLS
- 2025-10-06 Price Changed $289,900 HKARMLS
- 2025-08-28 Price Changed $294,900 Metro Search MLS
- 2025-08-28 Price Changed $294,900 HKARMLS
Cash-flow waterfall
monthlySold comps — $/sqft
last 12 mo · ≤1 miLoading sold comps…