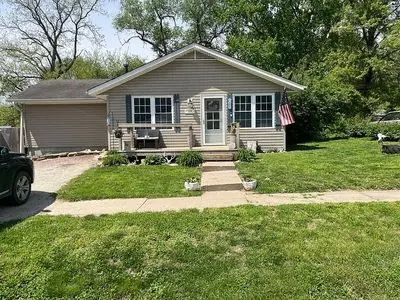
228 Hackberry St · Amazonia, MO
Flood risk 1/10 · Minimal
- FEMA flood zone
- X (unshaded)
- Chance of flooding over 30 yrs
- 0.0%
- Est. flood insurance / yr
- $507 – $1,088
Fire risk 3/10 · Minor
- Est. fire insurance / yr
- $1,054 – $1,958
Heat risk 4/10 · Minor
- Hot days now (above 107°F)
- 7 days/yr
- Hot days in 30 yrs
- 16 days/yr
Wind risk 2/10 · Minimal
- Chance of severe wind over 30 yrs
- —
Air-quality risk 2/10 · Minimal
- Unhealthy air days now
- 0 days/yr
- Unhealthy air days in 30 yrs
- 1 days/yr
Risk factors via First Street. Map © Google.
Why this score? — see what drove the C- grade
The composite is a weighted blend of 9 inputs, each scored 0–100. Each bar is that input's sub-score; the figure is the points it added to the 100-point composite (weight × sub-score).
- Cash flow +14.3/30.0
- Appreciation +9.6/10.0
- ARV discount +7.5/15.0
- DSCR +4.3/10.0
- Schools +3.8/10.0
- 1% rule +2.8/10.0
- Livability +2.8/5.0
- Rent growth +2.5/5.0
- Condition / age +2.5/5.0
$181,000
🖨 Deal sheet 📄 Offer letter ✓ Due diligence
Listing remarks MLS
This remodeled, all electric ranch home has much to offer it's new owner. Nicely manicured over-sized lot. 2015-New carpet & ceilings redone, new sliding patio doors w/ between the glass blinds, garbage disposal. 2014-New laminate kitchen counter tops. 2013-Vinyl siding & windows, 40gal elect hot water heater. 3 bedroom, 2 full baths, living room, dining area off the Master Chef's delight U-shaped galley kitchen & a bonus wood burning stove in the family room that opens out to the deck. A must see just 10 minutes out
Key facts
- Functional kitchen
- Fresh paint
- Large yard
Tags
Neighborhood map
What this means for you Summary
Snapshot
- This is a 3-bed/1.0-bath single-family listed at $181k.
Deal economics
- At list price, monthly cash flow is $32 ($385/yr) — positive.
- The deal already cash-flows at list — no discount required.
- To meet the 1% rule (rent ≥ 1% of price), the offer needs to be $141k (22.3% below list).
- Recommended offer: $141k (22.3% below list) — sets the bar for 1% rule.
Location & tenants
- Location reads 55/100 on livability (#726 in MO) — a working-class tenant base; expect higher turnover. Strengths: cost of living A+, housing A+; Watch: schools D-, crime F, amenities F.
- Savannah R-III (rural): math 43% / reading 46% proficiency, ranked #95 of 324 in MO (top 29%) — families likely to look elsewhere, expect single-tenant / working-renter base with shorter leases.
- Market conditions: 2 active listings in the ZIP; 4 units permitted in Andrew County in 2024 (0 in 5+ unit buildings).
Forward outlook
- In year one you build about $18k of equity ($1k loan paydown + $17k appreciation (9.2% local appreciation)).
- Andrew County population projected to shrink 6% by 2050 — rents likely to lag national; underwrite the cash flow, not the appreciation.
- At projected returns (9.2% appreciation + 3.0% rent growth), your $51k cash investment doubles in ~3 years — after that, you're playing with house money.
- By year 3, paydown + projected appreciation supports a ~$45k cash-out refi (75% LTV) — recoverable capital for the next deal without selling this one.
Negotiation context
- Only 1 days on market — expect competitive offers; lowballing is unlikely to land.
- 2 sale attempts since 11y ago with the ask held roughly flat each time — persistent listings suggest the price (not the market) is what's stuck; bring a comps-based counter.
Questions for the listing agent
- Built in 1974 — when were the roof, HVAC, electrical panel, plumbing, and water heater last replaced?
- Is there a deadline driving the sale (1031 exchange, divorce, estate, relocation)? That informs how much negotiation room exists.
- Schools are D-rated, which usually means shorter tenancies and higher turnover. Who's the typical renter profile here, and what's been the actual vacancy rate?
- Crime grade is F in this area — have there been break-ins, vandalism, or insurance claims at this property in the last 3 years? What carrier currently insures it and at what premium?
- What's the average days-on-market for RENTAL listings here right now (not sales)? A rising rental-DOM trend means longer vacancies and softer asking-rent achievability than the comps imply.
- What's the recent tenant-quality profile in this submarket — average credit score on applications, eviction rate, late-payment / NSF rate, and stable-employment percentage? A property-management company in the area should have these aggregated.
- How much new for-sale + rental construction is in the pipeline within 1–3 miles? Heavy new supply typically softens prices + rents 12–24 months out; constrained supply supports both.
Investment metrics
- 1% rule
- 0.78% ✗
- Cap rate
- 6.51%
- Cash-on-cash
- 0.76%
- DSCR
- 1.03
- GRM
- 10.7
CMA / ARV
No comps found within radius.
Projected returns pro-forma
9.23% appreciation · 3.0% rent growth · sell at horizon
- IRR
- 23.2%
- Equity multiple
- 2.80×
- Total profit
- $91,082
- Equity at exit
- $153,000
- IRR
- 20.8%
- Equity multiple
- 6.22×
- Total profit
- $264,359
- Equity at exit
- $319,801
Cash invested: $50,680 (down + closing). Projections, not guarantees.
Landlord ↔ Tenant lean methodology
- Overall (STATE)
- 81 Strongly Landlord-Friendly
- State Missouri
- 81 Strongly Landlord-Friendly · R+10
- County
- — inherits STATE
- City
- — inherits STATE
ZIP-level market 64421
- Home prices YoY
- 3.3%
- Active inventory
- 2
- Price-to-rent
- 10.7×
Monthly cashflow live
- Estimated rent
- $1,406 medium interval (Pro) →
- Mortgage (P&I)
- −$949
- Tax from tax record
- −$54 /mo · $650/yr
- Insurance
- −$75
- HOA
- −$0
- Vacancy / Maint / Mgmt
- −$295
- Net cashflow
- $32
Break-even live
UW: 25.0% down · 7.5% · 30yr · 1.5% tax · 5.0% vac · 8.0% maint · 8.0% mgmt
Financing live
Cash to close
- Down payment
- $45,250
- Closing costs
- $5,430
- Reserves months
- —
- Total cash needed
- —
Loan-product check · same deal, 3 products live
Conventional
25% down · 7.5% · 30yr
- Down + closing
- —
- Monthly P&I
- —
- Monthly cashflow
- —
- DSCR
- —
- Eligible?
- —
Personal DTI + credit; lowest rate.
DSCR
20% down · 8.5% · 30yr
- Down + closing
- —
- Monthly P&I
- —
- Monthly cashflow
- —
- DSCR
- —
- Eligible?
- —
No personal income docs; deal must DSCR.
Hard money
10% down · 12.0% · 12mo
- Down + closing
- —
- Monthly P&I
- —
- Monthly cashflow
- —
- DSCR
- —
- Eligible?
- —
Short-term bridge; refi at stabilization.
Listing history 4 events
-
2026-05-13status Under Contract
-
2026-05-12$181,000 Active
-
2015-08-14soldstatus 540-char remark
Show marketing remark (540 chars)
This remodeled, all electric ranch home has much to offer it's new owner. Nicely manicured over-sized lot. 2015-New carpet & ceilings redone, new sliding patio doors w/ between the glass blinds, garbage disposal. 2014-New laminate kitchen counter tops. 2013-Vinyl siding & windows, 40gal elect hot water heater. 3 bedroom, 2 full baths, living room, dining area off the Master Chef's delight U-shaped galley kitchen & a bonus wood burning stove in the family room that opens out to the deck. A must see just 10 minutes out
-
2015-06-01$88,000 540-char remark
Show marketing remark (540 chars)
This remodeled, all electric ranch home has much to offer it's new owner. Nicely manicured over-sized lot. 2015-New carpet & ceilings redone, new sliding patio doors w/ between the glass blinds, garbage disposal. 2014-New laminate kitchen counter tops. 2013-Vinyl siding & windows, 40gal elect hot water heater. 3 bedroom, 2 full baths, living room, dining area off the Master Chef's delight U-shaped galley kitchen & a bonus wood burning stove in the family room that opens out to the deck. A must see just 10 minutes out
ⓘ Source: listings_history table (triggers on properties + properties_extension) + one-shot
backfill from property_details.listing_events for pre-trigger history.
Tax reassessment forecast MO · Resets to sale price
- Current annual tax
- $650 · $54/mo
- Projected year-2 tax
- $1,756 · $146/mo
- Expected delta
- +$1,106/yr (+$92/mo · 170.2%)
ⓘ Screening estimate from a state-policy table — verify with the county assessor before closing.
Climate risk First Street
- Flood 1/10 Low FEMA zone X (unshaded) · 0% chance over 30 yrs
- Wildfire 3/10 Moderate
- Heat 4/10 Moderate 7 d/yr ≥107°F today · 16 d/yr by 30 yrs out
- Wind 2/10 Low
- Air quality 2/10 Low 0 unhealthy d/yr today · 1 by 30 yrs out
Nearby sold comps map
Loading sold comps map…
Walkable amenities ~0.75 mi
Loading nearby amenities…
Taxation est. · year 1
- Rental income
- $16,874
- − Mortgage interest
- −$10,139
- − Property taxes
- −$650
- − Insurance
- −$905
- − Repairs & maintenance
- −$1,350
- − Management
- −$1,350
- − Depreciation
- −$5,265
- Taxable loss
- −$2,785
- Est. tax savings @ 24.0%
- +$668
- After-tax cash flow
- $1,054/yr
For passive investors: Depreciation is non-cash, so a rental often shows a tax loss while cash-flowing — sheltering income. Rental losses are passive: they offset passive income freely, and up to $25,000/yr can offset ordinary (W-2) income if you actively participate and your MAGI is under $100k (phasing out to $0 by $150k); unused losses carry forward. On sale, claimed depreciation is recaptured at up to 25%, and gains may owe capital-gains tax (a 1031 exchange can defer both). Figures are a year-1 estimate at your 24.0% rate — not tax advice; consult a CPA.
Schools (NCES district)
- District
- Savannah R-III
- NCES district ID
- 2927570
- Math proficiency
- 43% ▼ -5.00%
- Reading proficiency
- 46% ▼ -6.00%
- Median HH income
- $52,000
- Composite
- 38.41/100
- National rank
- #4204
- State rank
- #95 of 324 in MO
Livability — Amazonia
- Score
- 55/100
- State rank
- #726
- US rank
- #23111
Category grades
Schools grade is shown separately in the Schools card above.
Census & demographics
- Census place
- Amazonia, MO
- Population (ZIP)
- 796
Population outlook (Andrew County) Hauer SSP2
- Today (2025)
- 17,463 people
- By 2030
- 17,412 · -0.3%
- By 2040
- 17,051 · -2.4%
- By 2050
- 16,359 · -6.3%
- By 2075
- 14,483 · -17.1%
- By 2100
- 11,788 · -32.5%
Race, ethnicity, and origin ACS 2023
- Neighborhood character
- Predominantly White (90%)
- Race & ethnicity
- White 90% Hispanic / Latino 5% Two or more races 4%
- Hispanic origin (detail)
- Mexican 5%
- Common ancestry
- Slovak 3% German 2% Hungarian 1%
- Languages at home
- 99% English-only · Spanish 1% German/W. Germanic 1%
Political lean MEDSL · Andrew
- 2024 margin
- Solid R (+51.8) · D 23.5% · R 75.2% · Other 1.3%
- 2008→2024 swing
- -29.7pp toward R · 2008: -22.0pp · 2024: -51.8pp
- All cycles
- 2024: R+51.8 2020: R+50.3 2016: R+50.5 2012: R+33.8 2008: R+22.0
Not yet ingested
- Civics
- —
Market trends
- HPI YoY
- ▲ 9.23%
- Current HPI
- 285.9199
- Rent YoY
- —
- Metro
- —
- State GDP YoY
- ▲ 1.84%
- F500 in state
- 20
Industry mix (Fortune 500 HQ in MO)
| Industry | F500 HQs | Revenue |
|---|---|---|
| Healthcare | 1 | $163B |
|
||
| Insurance | 1 | $21B |
|
||
| Industrial Technology | 1 | $17B |
|
||
| Retail | 1 | $16B |
|
||
| Industrial Distribution | 1 | $10B |
|
||
| Utilities | 1 | $9B |
|
||
Price history
+105.7% since first listed4 events — show timeline
- 2026-05-13 Pending — FSBO.com
- 2026-05-12 Listed $181,000 FSBO.com
- 2015-08-14 Sold (MLS) — Heartland MLS as Distributed by MLS Grid
- 2015-06-01 Listed $88,000 Heartland MLS as Distributed by MLS Grid
Property tax history
+1.0%/yrLatest (2025): $650 · +7.0% YoY. Source: county tax records.
Cash-flow waterfall
monthlySold comps — $/sqft
last 12 mo · ≤1 miLoading sold comps…