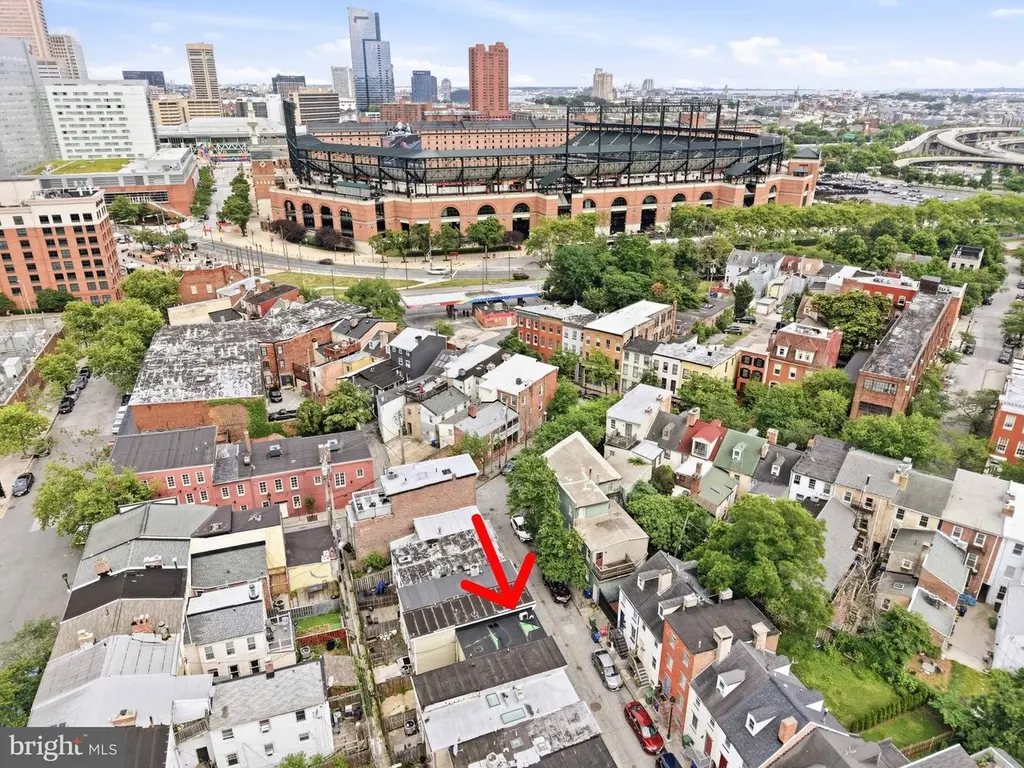
642 Melvin Dr · Baltimore, MD
Flood risk 4/10 · Minor
- FEMA flood zone
- X (unshaded)
- Chance of flooding over 30 yrs
- 0.2%
- Est. flood insurance / yr
- $473 – $860
Fire risk 1/10 · Minimal
- Est. fire insurance / yr
- $755 – $1,403
Heat risk 7/10 · Major
- Hot days now (above 103°F)
- 7 days/yr
- Hot days in 30 yrs
- 15 days/yr
Wind risk 6/10 · Moderate
- Chance of severe wind over 30 yrs
- 27.0%
Air-quality risk 4/10 · Minor
- Unhealthy air days now
- 6 days/yr
- Unhealthy air days in 30 yrs
- 7 days/yr
Risk factors via First Street. Map © Google.
Why this score? — see what drove the B grade
The composite is a weighted blend of 9 inputs, each scored 0–100. Each bar is that input's sub-score; the figure is the points it added to the 100-point composite (weight × sub-score).
- Cash flow +30.0/30.0
- ARV discount +15.0/15.0
- DSCR +10.0/10.0
- 1% rule +8.8/10.0
- Livability +3.8/5.0
- Condition / age +2.5/5.0
- Rent growth +2.2/5.0
- Schools +1.0/10.0
- Appreciation +0.0/10.0
$119,900
🖨 Deal sheet 📄 Offer letter ✓ Due diligence
Listing remarks
Discover the potential in Historic Ridgley's Delight, just steps from the professional schools of University of Maryland, Camden Yards and M & T Bank Stadium. This ideally priced renovation opportunity is situated on a desirable block where much of the heavy lifting has already been completed, including gutting, framing, plumbing with full bathroom installed and more. One bedroom, one bath residence is ideal for a first time home buyer or savvy investor seeking strong rental potential from the steady demand of University affiliates and downtown professionals. Conveniently located near the MARC train, with walkability, energy and historic charm throughout this vibrant community filled wi
Key facts
- Built 1900
- Listed 22 days
Property features AI
Finance
- Other: Below-grade finished area and usable space present
- Financial info: Ownership interest: ground rent; Annual ground rent payment (semi-annually)
Exterior
- Parking: On-street parking
- Utilities: Public water; Public sewer
- Home design: Interior townhouse / rowhouse
- Construction: Brick construction; Stone foundation
- Exterior features: Rear fencing; Ground rent exists (paid semi-annually)
Interior
- Kitchen: Refrigerator; Stove
- Bedrooms: 1 bedroom on the first upper level
- Bathrooms: 1 full bathroom
- Interior features: Historic property; Major rehab needed; Basement with connecting stairway
- Laundry & utility: Laundry on lower floor
Neighborhood map
What this means for you Summary
Snapshot
- This is a 1-bed/1.5-bath townhouse listed at $120k.
Deal economics
- At list price, monthly cash flow is $494 ($6k/yr) — positive.
- The deal already cash-flows at list — no discount required.
- Meets the 1% rule at list price ($2k rent vs $120k).
- Recommended offer: $118k (1.5% below list) — sets the bar for market timing.
- Cap rate 11.2% vs local median 6.0% in Baltimore — top-decile yield for the area; either an underpriced asset or a hidden risk that comps aren't pricing in. Stress-test before assuming the spread holds.
Location & tenants
- Location reads 76/100 on livability (#90 in MD, #3,396 nationally) — a middle-class / working-renter tenant base. Strengths: amenities A+, commute A+, housing A+; Watch: schools D, crime F.
- Baltimore City Public Schools (urban): math 7% / reading 16% proficiency, ranked #24 of 24 in MD (top 100%) — low school quality limits family demand, transient renter base, plan for 1-2y turnover; 79% free/reduced lunch — lower-income household profile, screen leases tightly.
- Market conditions: Rents soft (-1.0%/yr); 362 active listings in the ZIP; 40 comparable units currently listed for rent nearby; rentals at typical pace (median 18d on market — plan ~3-4 weeks tenant-placement turnaround); solid renter incomes; 1,273 units permitted in Baltimore city in 2024 (1,104 in 5+ unit buildings).
Forward outlook
- Local home prices are declining (-3.0%/yr); year-one equity from $829 of loan paydown is wiped out by about $4k of value loss. Plan a longer hold.
- Baltimore County population projected to shrink 4% by 2050 — rents likely to lag national; underwrite the cash flow, not the appreciation.
- At projected returns (-3.0% appreciation + 0.0% rent growth), your $34k cash investment doubles in ~10 years — after that, you're playing with house money.
Negotiation context
- It's been on market 22 days — a 2% lower offer ($118k) is reasonable based on typical stale-listing flexibility.
- 11 sale attempts since 30y ago with the ask held roughly flat each time — persistent listings suggest the price (not the market) is what's stuck; bring a comps-based counter.
- Current owner paid $70k; list at $120k implies a 71% gain — meaningful room to come down on a strong offer.
Risks & watch-outs
- Watch-outs: built in 1900 — expect roof / HVAC / electrical / plumbing capex.
- Climate carrying-cost: major wind risk, 27% chance of damaging wind over 30y; extreme-heat days projected 7→15/yr by 2055 (HVAC capex compounding) — expect insurance premiums to compound above CPI over the hold.
Questions for the listing agent
- Built in 1900 — when were the roof, HVAC, electrical panel, plumbing, and water heater last replaced?
- Is there a deadline driving the sale (1031 exchange, divorce, estate, relocation)? That informs how much negotiation room exists.
- Schools are D-rated, which usually means shorter tenancies and higher turnover. Who's the typical renter profile here, and what's been the actual vacancy rate?
- Crime grade is F in this area — have there been break-ins, vandalism, or insurance claims at this property in the last 3 years? What carrier currently insures it and at what premium?
- What's the average days-on-market for RENTAL listings here right now (not sales)? A rising rental-DOM trend means longer vacancies and softer asking-rent achievability than the comps imply.
- What's the recent tenant-quality profile in this submarket — average credit score on applications, eviction rate, late-payment / NSF rate, and stable-employment percentage? A property-management company in the area should have these aggregated.
- How much new for-sale + rental construction is in the pipeline within 1–3 miles? Heavy new supply typically softens prices + rents 12–24 months out; constrained supply supports both.
Investment metrics
- 1% rule
- 1.38% ✓
- Cap rate
- 11.24%
- Cash-on-cash
- 17.65%
- DSCR
- 1.79
- GRM
- 6.0
CMA / ARV
- ARV (on-the-fly)
- $190,944
- Comps found
- 12
Show comp detail 12 sales within ~0.75 mi
| Address | Dist | Beds/Ba | Sqft | Sold | Price | $/sf | Match |
|---|---|---|---|---|---|---|---|
| 649 Dover St | 0.06mi | 1/1.5 | 936 (+8%) | 3mo | $195,000 | $208 | 81 |
| 864 Carroll St | 0.36mi | 2/1.5 (+1) | 880 (+2%) | 3mo | $89,000 | $101 | 72 |
| 421 S Sharp St S Unit R 11 | 0.44mi | 2/2.0 (+1) | 898 (+4%) | 2mo | $220,000 | $245 | 65 |
| 1121 Cleveland St | 0.41mi | 2/1.0 (+1) | 912 (+6%) | 2mo | $109,900 | $121 | 63 |
| 1133 Sargeant St | 0.49mi | 2/1.5 (+1) | 912 (+6%) | 2mo | $67,500 | $74 | 61 |
| 138 W Barre St Unit R 31 | 0.43mi | 2/2.0 (+1) | 960 (+11%) | 1mo | $270,000 | $281 | 54 |
| 731 S Hanover St Unit R2 | 0.60mi | 2/1.0 (+1) | 800 (-7%) | 0mo | $180,000 | $225 | 52 |
| 911 S Charles St #403 | 0.71mi | 2/2.0 (+1) | 905 (+5%) | 1mo | $200,000 | $221 | 51 |
| 119 S Carrollton Ave | 0.62mi | 2/1.5 (+1) | 800 (-7%) | 4mo | $83,000 | $104 | 51 |
| 103 W Conway St Unit R 52 | 0.46mi | 2/2.0 (+1) | 975 (+13%) | 1mo | $267,000 | $274 | 49 |
| 900 Harden Ct | 0.73mi | 2/1.5 (+1) | 936 (+8%) | 3mo | $269,900 | $288 | 44 |
| 1241 W Lombard St | 0.69mi | 2/1.0 (+1) | 963 (+12%) | 3mo | $150,000 | $156 | 39 |
Match score weights: distance 35% · size 25% · config 20% · recency 20%. Top-matched comps best support the ARV.
Projected returns pro-forma
-3.0% appreciation · 0.0% rent growth · sell at horizon
- IRR
- 5.7%
- Equity multiple
- 1.21×
- Total profit
- $7,202
- Equity at exit
- $17,877
- IRR
- 12.3%
- Equity multiple
- 1.84×
- Total profit
- $28,127
- Equity at exit
- $10,367
Cash invested: $33,572 (down + closing). Projections, not guarantees.
Landlord ↔ Tenant lean methodology
- Overall (CITY)
- 12 Strongly Tenant-Friendly
- State Maryland
- 27 Tenant-Leaning · D+14
- County
- — inherits STATE
- City Baltimore
- 12 Strongly Tenant-Friendly · D+58
ZIP-level market 21230
- Rents YoY
- -1.0%
- Active inventory
- 362
- Price-to-rent
- 6.0×
Monthly cashflow live
- Estimated rent
- $1,652 high interval (Pro) →
- Mortgage (P&I)
- −$629
- Tax from tax record
- −$132 /mo · $1,589/yr
- Insurance
- −$50
- HOA
- −$0
- Vacancy / Maint / Mgmt
- −$347
- Net cashflow
- $494
Break-even live
UW: 25.0% down · 7.5% · 30yr · 1.5% tax · 5.0% vac · 8.0% maint · 8.0% mgmt
Financing live
Cash to close
- Down payment
- $29,975
- Closing costs
- $3,597
- Reserves months
- —
- Total cash needed
- —
Loan-product check · same deal, 3 products live
Conventional
25% down · 7.5% · 30yr
- Down + closing
- —
- Monthly P&I
- —
- Monthly cashflow
- —
- DSCR
- —
- Eligible?
- —
Personal DTI + credit; lowest rate.
DSCR
20% down · 8.5% · 30yr
- Down + closing
- —
- Monthly P&I
- —
- Monthly cashflow
- —
- DSCR
- —
- Eligible?
- —
No personal income docs; deal must DSCR.
Hard money
10% down · 12.0% · 12mo
- Down + closing
- —
- Monthly P&I
- —
- Monthly cashflow
- —
- DSCR
- —
- Eligible?
- —
Short-term bridge; refi at stabilization.
Rent comps 40 comps
| Address | Beds | Baths | Sqft | Rent | $/sqft | DOM | Units | Dist |
|---|---|---|---|---|---|---|---|---|
| 653 Dover St Baltimore, MD | 1.0 | 1.5 | 936 | $1,500 | $1.60 | 20d | 1 | 0.05mi |
| 657 Dover St Baltimore, MD | 1.0 | 2.0 | 1080 | $1,400 | $1.30 | 12d | 1 | 0.05mi |
| 725 W Pratt St Baltimore, MD | 1.0 | 1.0 | 584 | $1,925 | $3.29 | 10d | 9 | 0.11mi |
| 519 W Pratt St Baltimore, MD | 1.0 | 1.0 | 576 | $1,400 | $2.43 | 2d | 2 | 0.12mi |
| 121 S Fremont Ave Baltimore, MD | 1.0 | 1.0 | 582 | $2,100 | $3.61 | 20d | 5 | 0.14mi |
| 121 S Fremont Ave Apt 201 Baltimore, MD | — | 1.0 | 552 | $1,549 | $2.81 | 17d | 1 | 0.14mi |
| 776 Washington Blvd Unit 3F Baltimore, MD | 1.0 | 1.0 | 800 | $1,000 | $1.25 | 43d | 1 | 0.23mi |
| 410 W Lombard St Baltimore, MD | 1.0 | 1.0 | 611 | $1,995 | $3.26 | 1d | 4 | 0.25mi |
| 519 Scott St Unit 1 Baltimore, MD | 2.0 | 2.0 | 800 | $2,000 | $2.50 | 43d | 1 | 0.26mi |
| 805 Washington Blvd Unit B Baltimore, MD | 2.0 | 2.0 | 1106 | $1,650 | $1.49 | 20d | 1 | 0.26mi |
| 805 Washington Blvd Unit A Baltimore, MD | 2.0 | 2.0 | 1050 | $1,650 | $1.57 | 43d | 1 | 0.26mi |
| 301 W Lombard St Baltimore, MD | 1.0 | 1.0–2.0 | 499 | $1,775 | $3.56 | 1d | 30 | 0.29mi |
| 11 S Eutaw St Baltimore, MD | 1.0–2.0 | 1.0–2.0 | 1023 | $1,781 | $1.74 | 1d | 11 | 0.34mi |
| 300 W Lombard St Baltimore, MD | 2.0 | 1.0–2.0 | 686 | $1,565 | $2.28 | 2d | 7 | 0.34mi |
| 847 McHenry St Baltimore, MD | 2.0 | 2.0 | 952 | $1,795 | $1.89 | 4d | 1 | 0.35mi |
| 853 Reinhart St Baltimore, MD | 2.0 | 2.5 | 780 | $1,800 | $2.31 | 43d | 1 | 0.35mi |
| 1 S Eutaw St Unit 1BR Baltimore, MD | 1.0 | 1.0 | 600 | $1,245 | $2.08 | 14d | 1 | 0.36mi |
| 300 W Redwood St Baltimore, MD | 1.0 | 1.0 | 565 | $2,400 | $4.25 | 17d | 1 | 0.37mi |
| 311 W Baltimore St Unit 504 Baltimore, MD | 2.0 | 2.0 | 1100 | $1,999 | $1.82 | 19d | 1 | 0.38mi |
| 311 W Baltimore St #503 Baltimore, MD | 1.0 | 1.0 | 900 | $1,599 | $1.78 | 43d | 1 | 0.38mi |
| 869 Hollins St Unit 3F Baltimore, MD | — | 1.0 | 700 | $949 | $1.36 | 12d | 1 | 0.39mi |
| 617 W Lexington St Baltimore, MD | 1.0–2.0 | 1.0 | 975 | $2,000 | $2.05 | 10d | 4 | 0.43mi |
| 8 N Howard St Baltimore, MD | 2.0 | 1.0–2.0 | 1433 | $2,400 | $1.67 | 1d | 36 | 0.43mi |
| 123 W Barre St #112 Baltimore, MD | 2.0 | 1.5 | 975 | $2,200 | $2.26 | 43d | 1 | 0.45mi |
| 305 W Fayette St Baltimore, MD | 1.0–2.0 | 1.0–2.0 | 895 | $1,250 | $1.40 | 43d | 1 | 0.46mi |
| 300 W Fayette St Baltimore, MD | 3.0 | 1.0–3.0 | 1267 | $1,480 | $1.17 | 2d | 9 | 0.47mi |
| 1127 Sargeant St Baltimore, MD | 2.0 | 1.5 | 1080 | $1,275 | $1.18 | 23d | 1 | 0.49mi |
| 2 Hopkins Plaza Baltimore, MD | 2.0 | 1.0–2.0 | 942 | $2,412 | $2.56 | 2d | 12 | 0.50mi |
| 1160 Washington Blvd Baltimore, MD | 2.0 | 1.0 | 960 | $1,575 | $1.64 | 23d | 1 | 0.50mi |
| 1163 Washington Blvd Baltimore, MD | 2.0 | 2.5 | 1012 | $1,700 | $1.68 | 12d | 1 | 0.51mi |
| 101 W Fayette St Baltimore, MD | 1.0 | 1.0 | 555 | $1,800 | $3.24 | 4d | 26 | 0.54mi |
| 3 Andrew Pl Unit R98 Baltimore, MD | 2.0 | 2.0 | 975 | $2,100 | $2.15 | 12d | 1 | 0.55mi |
| 1215 James St Baltimore, MD | 2.0 | 1.0 | 960 | $1,500 | $1.56 | 43d | 1 | 0.58mi |
| 101 N Schroeder St Baltimore, MD | 3.0 | 1.0–2.0 | 1037 | $1,776 | $1.71 | 2d | 12 | 0.58mi |
| 318 N Paca St Unit 10 Baltimore, MD | 2.0 | 1.0 | 600 | $1,200 | $2.00 | 21d | 1 | 0.59mi |
| 318 N Paca St Unit 4 Baltimore, MD | — | 1.0 | 600 | $900 | $1.50 | 43d | 1 | 0.59mi |
| 318 N Paca St Unit 9 Baltimore, MD | 1.0 | 1.0 | 600 | $1,000 | $1.67 | 43d | 1 | 0.59mi |
| 318 N Paca St Unit 8 Baltimore, MD | — | 1.0 | 600 | $900 | $1.50 | 23d | 1 | 0.59mi |
| 611 S Charles St Baltimore, MD | 2.0 | 1.0–2.0 | 823 | $2,468 | $3.00 | 1d | 8 | 0.62mi |
| 22 Light St Baltimore, MD | 2.0–3.0 | 1.0–2.0 | 956 | $1,195 | $1.25 | 2d | 1 | 0.63mi |
Listing history 49 events
-
2026-06-18days on market $119,900 Active 22 DOM
-
2026-06-17days on market $119,900 Active 21 DOM
-
2026-06-16days on market $119,900 Active 20 DOM
-
2026-06-15days on market $119,900 Active 19 DOM
-
2026-06-13days on market $119,900 Active 17 DOM
-
2026-06-09days on market $119,900 Active 13 DOM
-
2026-06-08days on market $119,900 Active 12 DOM
-
2026-06-07days on market $119,900 Active 11 DOM
-
2026-06-04days on market $119,900 Active 8 DOM
-
2026-06-03days on market $119,900 Active 7 DOM
-
2026-06-02days on market $119,900 Active 6 DOM
-
2026-06-01days on market $119,900 Active 5 DOM
-
2026-05-31days on market $119,900 Active 4 DOM
-
2026-05-28$119,900 Active
-
2026-05-27historical $119,900
-
2024-12-01historical
-
2024-10-24$125,000 Active
-
2024-10-23historical
-
2019-11-20soldstatus $70,000
-
2019-10-04historical
-
2019-08-26price $79,900
-
2019-08-26status Active
-
2019-07-29status Pending
-
2019-07-09price $89,900
-
2019-07-02$99,900 Active
-
2017-01-25soldstatus $66,134
-
2016-06-28soldstatus $66,134
-
2016-06-28soldstatus $66,134 Sold
-
2016-05-25status Contract
-
2016-05-17price $50,000
-
2016-04-25status Active
-
2016-02-03status Contract
-
2016-01-25status Active
-
2016-01-14status Contract
-
2015-12-14price $75,000
-
2015-10-20price $85,000
-
2015-09-14$99,900 Active
-
2007-08-29soldstatus $185,000
-
2007-07-31soldstatus $185,000
-
2007-07-03historical
-
2007-03-23$195,000
-
2005-02-03soldstatus $50,000
-
1998-08-02historical
-
1997-01-23historical
-
1996-07-23
-
1996-07-23
-
1996-07-22historical
-
1996-05-01
-
1987-03-31soldstatus $18,000
ⓘ Source: listings_history table (triggers on properties + properties_extension) + one-shot
backfill from property_details.listing_events for pre-trigger history.
Tax reassessment forecast MD · Partial reset (capped growth)
- Current annual tax
- $1,589 · $132/mo
- Projected year-2 tax
- $1,589 · $132/mo
- Expected delta
- $0/yr ($0/mo · 0.0%)
ⓘ Screening estimate from a state-policy table — verify with the county assessor before closing.
Climate risk First Street
- Flood 4/10 Moderate FEMA zone X (unshaded) · 20% chance over 30 yrs
- Wildfire 1/10 Low
- Heat 7/10 Severe 7 d/yr ≥103°F today · 15 d/yr by 30 yrs out
- Wind 6/10 Major 27% chance of damaging wind over 30 yrs
- Air quality 4/10 Moderate 6 unhealthy d/yr today · 7 by 30 yrs out
Nearby sold comps map
Loading sold comps map…
Walkable amenities ~0.75 mi
Loading nearby amenities…
Taxation est. · year 1
- Rental income
- $19,824
- − Mortgage interest
- −$6,716
- − Property taxes
- −$1,589
- − Insurance
- −$600
- − Repairs & maintenance
- −$1,586
- − Management
- −$1,586
- − Depreciation
- −$3,488
- Taxable income
- $4,259
- Est. tax owed @ 24.0%
- −$1,022
- After-tax cash flow
- $4,905/yr
For passive investors: Depreciation is non-cash, so a rental often shows a tax loss while cash-flowing — sheltering income. Rental losses are passive: they offset passive income freely, and up to $25,000/yr can offset ordinary (W-2) income if you actively participate and your MAGI is under $100k (phasing out to $0 by $150k); unused losses carry forward. On sale, claimed depreciation is recaptured at up to 25%, and gains may owe capital-gains tax (a 1031 exchange can defer both). Figures are a year-1 estimate at your 24.0% rate — not tax advice; consult a CPA.
Schools (NCES district)
- District
- Baltimore City Public Schools
- NCES district ID
- 2400090
- Math proficiency
- 7% ▼ -9.00%
- Reading proficiency
- 16% ▼ -5.00%
- Median HH income
- $42,108
- Composite
- 10.08/100
- National rank
- #9805
- State rank
- #24 of 24 in MD
Livability — Baltimore
- Score
- 76/100
- State rank
- #90
- US rank
- #3396
Category grades
Schools grade is shown separately in the Schools card above.
Census & demographics
- Census place
- Baltimore, MD
- County
- Baltimore City · 558,601 people
- City population
- 588,727
- Metro
- Baltimore-Columbia-Towson, MD
- Population (ZIP)
- 32,977
- Household income
- $91,842
- Rent vs Own
- Severe rent burden
- 1463.0
Population outlook (Baltimore County) Hauer SSP2
- Today (2025)
- 624,249 people
- By 2030
- 621,541 · -0.4%
- By 2040
- 609,756 · -2.3%
- By 2050
- 597,249 · -4.3%
- By 2075
- 552,236 · -11.5%
- By 2100
- 513,934 · -17.7%
Race, ethnicity, and origin ACS 2023
- Neighborhood character
- Diverse neighborhood (Simpson 0.63)
- Race & ethnicity
- White 55% Black 23% Hispanic / Latino 13% Two or more races 6% Asian 4%
- Hispanic origin (detail)
- Mexican 1% Puerto Rican 1%
- Common ancestry
- Romanian 5% Lithuanian 2% Italian 2%
- Foreign-born
- 10% · Canada, China
- Languages at home
- 85% English-only · Spanish 9% Other Indo-European 1% Other Asian/Pacific 1%
Political lean MEDSL · Baltimore
- 2024 margin
- Solid D (+73.0) · D 85.2% · R 12.2% · Other 2.6%
- 2008→2024 swing
- -2.5pp toward R · 2008: 75.5pp · 2024: 73.0pp
- All cycles
- 2024: D+73.0 2020: D+76.6 2016: D+74.6 2012: D+76.4 2008: D+75.5
Not yet ingested
- Civics
- —
Market trends
- HPI YoY
- ▼ -311.43%
- Current HPI
- 284.338
- Rent YoY
- ▼ -1.00%
- Metro
- Baltimore-Columbia-Towson, MD
- State GDP YoY
- ▲ 2.97%
- F500 in state
- 12
Industry mix (Fortune 500 HQ in MD)
| Industry | F500 HQs | Revenue |
|---|---|---|
| Aerospace / Defense | 1 | $71B |
|
||
| Utilities | 1 | $25B |
|
||
| Hotels | 1 | $24B |
|
||
| Consumer Goods | 1 | $7B |
|
||
| Real Estate | 1 | $6B |
|
||
| Chemicals | 1 | $2B |
|
||
Price history
+566.1% since first listed36 events — show timeline
- 2026-05-28 Listed $119,900 BRIGHT MLS
- 2026-05-27 Coming Soon $119,900 BRIGHT MLS
- 2024-12-01 Listing Removed — BRIGHT MLS
- 2024-10-24 Listed $125,000 BRIGHT MLS
- 2024-10-23 Coming Soon — BRIGHT MLS
- 2019-11-20 Sold (Public Records) $70,000 Public Records
- 2019-10-04 Listing Removed — BRIGHT MLS
- 2019-08-26 Price Changed $79,900 BRIGHT MLS
- 2019-08-26 Relisted — BRIGHT MLS
- 2019-07-29 Pending — BRIGHT MLS
- 2019-07-09 Price Changed $89,900 BRIGHT MLS
- 2019-07-02 Listed $99,900 BRIGHT MLS
- 2017-01-25 Sold (Public Records) $66,134 Public Records
- 2016-06-28 Sold (MLS) $66,134 MRIS
- 2016-06-28 Sold (MLS) $66,134 BRIGHT MLS
- 2016-05-25 Pending — MRIS
- 2016-05-17 Price Changed $50,000 MRIS
- 2016-04-25 Relisted — MRIS
- 2016-02-03 Pending — MRIS
- 2016-01-25 Relisted — MRIS
- 2016-01-14 Pending — MRIS
- 2015-12-14 Price Changed $75,000 MRIS
- 2015-10-20 Price Changed $85,000 MRIS
- 2015-09-14 Listed $99,900 MRIS
- 2007-08-29 Sold (Public Records) $185,000 Public Records
- 2007-07-31 Sold (MLS) $185,000 MRIS
- 2007-07-03 Delisted — MRIS
- 2007-03-23 Listed $195,000 MRIS
- 2005-02-03 Sold (Public Records) $50,000 Public Records
- 1998-08-02 Delisted — MRIS
- 1997-01-23 Delisted — MRIS
- 1996-07-23 Listed — MRIS
- 1996-07-23 Listed — MRIS
- 1996-07-22 Delisted — MRIS
- 1996-05-01 Listed — MRIS
- 1987-03-31 Sold (Public Records) $18,000 Public Records
Property tax history
-3.8%/yrLatest (2025): $1,589 · +1.1% YoY. Source: county tax records.
Cash-flow waterfall
monthlySold comps — $/sqft
last 12 mo · ≤1 miLoading sold comps…