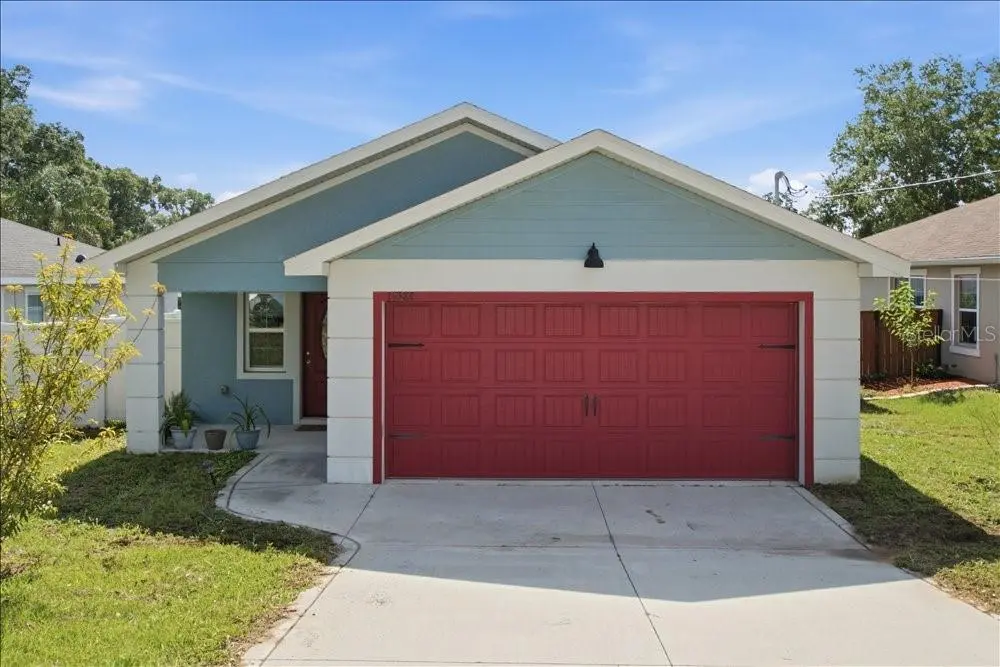
14584 20th St · Dade City, FL
Flood risk 1/10 · Minimal
- FEMA flood zone
- X (unshaded)
- Chance of flooding over 30 yrs
- 0.0%
- Est. flood insurance / yr
- $507 – $1,088
Fire risk 4/10 · Minor
- Est. fire insurance / yr
- $947 – $1,759
Heat risk 9/10 · Severe
- Hot days now (above 108°F)
- 7 days/yr
- Hot days in 30 yrs
- 25 days/yr
Wind risk 9/10 · Severe
- Chance of severe wind over 30 yrs
- 99.0%
Air-quality risk 1/10 · Minimal
- Unhealthy air days now
- 0 days/yr
- Unhealthy air days in 30 yrs
- 0 days/yr
Risk factors via First Street. Map © Google.
Why this score? — see what drove the D- grade
The composite is a weighted blend of 9 inputs, each scored 0–100. Each bar is that input's sub-score; the figure is the points it added to the 100-point composite (weight × sub-score).
- Appreciation +10.0/10.0
- Cash flow +6.7/30.0
- ARV discount +4.7/15.0
- Schools +4.3/10.0
- Livability +3.7/5.0
- Rent growth +2.5/5.0
- Condition / age +2.5/5.0
- 1% rule +1.8/10.0
- DSCR +1.0/10.0
$315,000
🖨 Deal sheet (PDF) 📄 Offer letter ✓ Due diligence
Listing remarks MLS
Beautiful new construction home in the City of Dade City. Nice open floor plan with waterproof vinyl plank flooring throughout, granite countertops, wood cabinets and stainless steel appliances! Schedule your showing today before this beauty is gone!
Key facts
- Fenced yard
- Granite countertops
- Wood cabinetry
Tags
Property features AI
Finance
- Other: Property type: Residential — Single Family Residence; Unfurnished; No lease restrictions; Living area approximately 1,354 sq ft
- HOA & community: No association; No association approval required
Exterior
- Parking: 2-car garage
- Utilities: Public water; Public sewer; Cable available; Broadband/high-speed internet available; Electricity available
- Home design: Single-family residence; One story; Faces west; Residential property
- Construction: Block construction; Shingle roof; Slab foundation; Built on 0.16-acre lot
- Exterior features: Fruit trees on the lot; Asphalt road access
Interior
- Kitchen: Built-In Oven; Dishwasher
- Bedrooms: 3 bedrooms
- Flooring: Laminate
- Bathrooms: 2 full bathrooms
- Heating & cooling: Central heating; Central air conditioning
- Interior features: High ceilings; Nine total rooms
- Laundry & utility: Laundry room inside
Neighborhood map
What this means for you Summary
Snapshot
- This is a 3-bed/2.0-bath single-family listed at $315k.
Deal economics
- At list price, monthly cash flow is $-499 ($-6k/yr) — negative.
- To cash-flow at today's rent, offer at most $227k (28.0% below list).
- To meet the 1% rule (rent ≥ 1% of price), the offer needs to be $216k (31.5% below list).
- Recommended offer: $216k (31.5% below list) — sets the bar for 1% rule.
Location & tenants
- Location reads 73/100 on livability (#307 in FL) — a middle-class / working-renter tenant base. Strengths: cost of living A+, housing A+, health & safety A+; Watch: employment C-, amenities F, commute F.
- Pasco (suburban): math 50% / reading 52% proficiency, ranked #32 of 73 in FL (top 44%) — acceptable for families but not a draw, mixed tenant base, ~2y average lease.
- Zoned schools: Rodney B. Cox Elementary School (math 27% / reading 17%, grade F, #2,080 of 2,144 statewide, top 97%, 428 students, 97% FRL); Pasco Middle School (math 38% / reading 38%, grade F, #388 of 571 statewide, top 69%, 903 students, 73% FRL); Pasco High School (math 40% / reading 40%, grade F, #296 of 667 statewide, top 45%, 1,639 students, 66% FRL) — zoned schools average 79% FRL vs 48% district-wide (30 pts higher); higher-poverty schools than district average — tighter screening recommended.
- Zoned-school proficiency averages 33% at this address vs 51% district-wide (-18 pts) — the specific schools serving this property underperform the Pasco average; the district grade overstates school quality for this exact location.
- Market conditions: 295 active listings in the ZIP; 17 comparable units currently listed for rent nearby; rentals leasing fast (median 7d on market — plan ~1-2 weeks tenant-placement turnaround); 6,765 units permitted in Pasco County in 2024 (1,250 in 5+ unit buildings).
Forward outlook
- In year one you build about $34k of equity ($2k loan paydown + $32k appreciation (10.0% local appreciation)).
- Pasco County population projected at +29% by 2050 — long-run rental-demand tailwind backs the buy-and-hold thesis.
- By year 2, paydown + projected appreciation supports a ~$54k cash-out refi (75% LTV) — recoverable capital for the next deal without selling this one.
Negotiation context
- Only 9 days on market — expect competitive offers; lowballing is unlikely to land.
- 3 sale attempts since 6y ago with the ask held roughly flat each time — persistent listings suggest the price (not the market) is what's stuck; bring a comps-based counter.
- Current owner paid $211k; 49% above their basis — modest negotiation headroom, anchor on the comps not their cost.
Risks & watch-outs
- Climate carrying-cost: severe wind risk, 99% chance of damaging wind over 30y; extreme-heat days projected 7→25/yr by 2055 (HVAC capex compounding) — expect insurance premiums to compound above CPI over the hold.
Questions for the listing agent
- What do current leases actually rent for vs. the listed asking? Can we see a recent rent roll and the last 12 months of T-12 income?
- Is there a deadline driving the sale (1031 exchange, divorce, estate, relocation)? That informs how much negotiation room exists.
- Schools are D-rated, which usually means shorter tenancies and higher turnover. Who's the typical renter profile here, and what's been the actual vacancy rate?
- The area grade is low — what's the realistic commute time and amenity access for the typical tenant pool here? Any planned neighborhood developments (good or bad) we should know about?
- What's the average days-on-market for RENTAL listings here right now (not sales)? A rising rental-DOM trend means longer vacancies and softer asking-rent achievability than the comps imply.
- What's the recent tenant-quality profile in this submarket — average credit score on applications, eviction rate, late-payment / NSF rate, and stable-employment percentage? A property-management company in the area should have these aggregated.
- How much new for-sale + rental construction is in the pipeline within 1–3 miles? Heavy new supply typically softens prices + rents 12–24 months out; constrained supply supports both.
Investment metrics
- 1% rule
- 0.68% ✗
- Cap rate
- 4.39%
- Cash-on-cash
- -6.78%
- DSCR
- 0.70
- GRM
- 12.2
CMA / ARV
- ARV (on-the-fly)
- $296,526
- Comps found
- 12
Show comp detail 12 sales within ~0.75 mi
| Address | Dist | Beds/Ba | Sqft | Sold | Price | $/sf | Match |
|---|---|---|---|---|---|---|---|
| 37142 Highland Bluff Cir | 0.15mi | 3/2.0 | 1,400 (+3%) | 0mo | $262,800 | $188 | 87 |
| 14700 State St | 0.31mi | 3/1.5 | 1,328 (-2%) | 4mo | $249,000 | $188 | 77 |
| 37049 Suwanee Way | 0.34mi | 3/2.0 | 1,340 (-1%) | 8mo | $240,000 | $179 | 76 |
| 36846 Jefferson Ave | 0.29mi | 3/2.0 | 1,368 (+1%) | 13mo | $355,000 | $260 | 74 |
| 14646 15th St | 0.33mi | 3/2.0 | 1,454 (+7%) | 3mo | $349,000 | $240 | 70 |
| 37515 Beauchamp Ave | 0.49mi | 3/2.0 | 1,288 (-5%) | 2mo | $233,000 | $181 | 67 |
| 14348 Graham St | 0.40mi | 3/2.0 | 1,246 (-8%) | 4mo | $295,000 | $237 | 65 |
| 36908 Center Ave | 0.46mi | 3/2.0 | 1,488 (+10%) | 4mo | $354,900 | $239 | 59 |
| 14317 10th St | 0.72mi | 3/3.0 | 1,348 (-0%) | 4mo | $295,000 | $219 | 58 |
| 14251 13th St | 0.57mi | 3/2.5 | 1,525 (+13%) | 4mo | $425,000 | $279 | 47 |
| 14141 11th St | 0.73mi | 3/2.5 | 1,439 (+6%) | 12mo | $300,000 | $208 | 43 |
| 36850 Blanton Rd | 0.59mi | 3/2.0 | 1,152 (-15%) | 8mo | $225,000 | $195 | 41 |
Match score weights: distance 35% · size 25% · config 20% · recency 20%. Top-matched comps best support the ARV.
Projected returns pro-forma
10.0% appreciation · 3.0% rent growth · sell at horizon
- IRR
- 19.5%
- Equity multiple
- 2.59×
- Total profit
- $139,852
- Equity at exit
- $283,777
- IRR
- 17.9%
- Equity multiple
- 5.95×
- Total profit
- $436,908
- Equity at exit
- $611,976
Cash invested: $88,200 (down + closing). Projections, not guarantees.
Landlord ↔ Tenant lean methodology
- Overall (STATE)
- 87 Strongly Landlord-Friendly
- State Florida
- 87 Strongly Landlord-Friendly · R+3
- County
- — inherits STATE
- City
- — inherits STATE
ZIP-level market 33523
- Home prices YoY
- 3.8%
- Active inventory
- 295
- Price-to-rent
- 12.2×
Monthly cashflow live
- Estimated rent
- $2,157 high interval (Pro) →
- Mortgage (P&I)
- −$1,652
- Tax from tax record
- −$420 /mo · $5,037/yr
- Insurance
- −$131
- HOA
- −$0
- Vacancy / Maint / Mgmt
- −$453
- Net cashflow
- $-499
Break-even live
Sensitivity live
| Price | -10% $-320 | -5% $-409 | +0% $-499 | +5% $-588 | +10% $-677 |
|---|---|---|---|---|---|
| Rent | -10% $-669 | -5% $-584 | +0% $-499 | +5% $-413 | +10% $-328 |
| Rate | -1.0pp $-340 | -0.5pp $-418 | base $-499 | +0.5pp $-580 | +1.0pp $-663 |
UW: 25.0% down · 7.5% · 30yr · 1.5% tax · 5.0% vac · 8.0% maint · 8.0% mgmt
Financing live
Cash to close
- Down payment
- $78,750
- Closing costs
- $9,450
- Reserves months
- —
- Total cash needed
- —
Loan-product check · same deal, 3 products live
Conventional
25% down · 7.5% · 30yr
- Down + closing
- —
- Monthly P&I
- —
- Monthly cashflow
- —
- DSCR
- —
- Eligible?
- —
Personal DTI + credit; lowest rate.
DSCR
20% down · 8.5% · 30yr
- Down + closing
- —
- Monthly P&I
- —
- Monthly cashflow
- —
- DSCR
- —
- Eligible?
- —
No personal income docs; deal must DSCR.
Hard money
10% down · 12.0% · 12mo
- Down + closing
- —
- Monthly P&I
- —
- Monthly cashflow
- —
- DSCR
- —
- Eligible?
- —
Short-term bridge; refi at stabilization.
Rent comps 17 comps
| Address | Beds | Baths | Sqft | Rent | $/sqft | DOM | Units | Dist |
|---|---|---|---|---|---|---|---|---|
| 14635 State St Dade City, FL | 3.0 | 1.5 | 1040 | $1,731 | $1.66 | 1d | 1 | 0.29mi |
| 37329 Magnolia Ave Unit 1234471P Dade City, FL | 3.0 | 2.0 | 1216 | $3,331 | $2.74 | 1d | 1 | 0.41mi |
| 13921 19th St Unit 1234474P Dade City, FL | 2.0 | 1.0 | 936 | $2,013 | $2.15 | 18d | 1 | 0.66mi |
| 13911 19th St Dade City, FL | 2.0 | 1.0 | 1600 | $1,495 | $0.93 | 6d | 1 | 0.67mi |
| 13911 19th St Dade City, FL | 2.0 | 1.0 | 1600 | $1,495 | $0.93 | 5d | 1 | 0.67mi |
| 37802 Whitehouse Ave Dade City, FL | 2.0 | 1.0 | 1344 | $1,150 | $0.86 | 25d | 1 | 0.76mi |
| 14907 Lucca Way Unit 1 Dade City, FL | 3.0 | 2.5 | 1386 | $2,100 | $1.52 | 26d | 1 | 0.85mi |
| 36350 Spanish Rose Dr Dade City, FL | 4.0 | 2.0 | 1828 | $2,149 | $1.18 | 6d | 1 | 1.22mi |
| 13917 2nd St Dade City, FL | 3.0 | 1.0 | 1312 | $1,950 | $1.49 | 26d | 1 | 1.29mi |
| 13650 5th St Dade City, FL | 2.0 | 1.0 | 900 | $1,350 | $1.50 | 1d | 1 | 1.30mi |
| 13650 5th St Dade City, FL | 2.0 | 1.0 | 900 | $1,350 | $1.50 | 14d | 1 | 1.30mi |
| 37135 Grassy Hill Ln Unit 1 Dade City, FL | 3.0 | 2.0 | 1212 | $3,500 | $2.89 | 26d | 1 | 1.35mi |
| 37135 Grassy Hill Ln Unit 1234475P Dade City, FL | 3.0 | 2.0 | 1205 | $3,535 | $2.93 | 4d | 1 | 1.35mi |
| 37215 Grassy Hill Ln Dade City, FL | 3.0 | 2.0 | 1212 | $1,495 | $1.23 | 26d | 1 | 1.36mi |
| 37132 Grassy Hill Ln Unit 1 Dade City, FL | 3.0 | 2.0 | 1212 | $3,500 | $2.89 | 26d | 1 | 1.38mi |
| 37132 Grassy Hill Ln Unit 1234477P Dade City, FL | 3.0 | 2.0 | 1205 | $3,379 | $2.80 | 1d | 1 | 1.38mi |
| 37228 Grassy Hill Ln Unit 1 Dade City, FL | 3.0 | 2.0 | 1212 | $1,750 | $1.44 | 5d | 1 | 1.39mi |
Listing history 8 events
-
2026-06-22price $315,000 Active 9 DOM
-
2026-06-21days on market $319,900 Active 9 DOM
-
2026-06-18days on market $319,900 Active 6 DOM
-
2026-06-17days on market $319,900 Active 5 DOM
-
2026-06-16days on market $319,900 Active 4 DOM
-
2026-06-15days on market $319,900 Active 3 DOM
-
2026-06-13remarks 693-char remark
-
2026-06-13$319,900 Active 1 DOM
ⓘ Source: listings_history table (triggers on properties + properties_extension) + one-shot
backfill from property_details.listing_events for pre-trigger history.
Tax reassessment forecast FL · Resets to sale price
- Current annual tax
- $5,037 · $420/mo
- Projected year-2 tax
- $5,037 · $420/mo
- Expected delta
- $0/yr ($0/mo · 0.0%)
ⓘ Screening estimate from a state-policy table — verify with the county assessor before closing.
Climate risk First Street
- Flood 1/10 Low FEMA zone X (unshaded) · 0% chance over 30 yrs
- Wildfire 4/10 Moderate
- Heat 9/10 Extreme 7 d/yr ≥108°F today · 25 d/yr by 30 yrs out
- Wind 9/10 Extreme 99% chance of damaging wind over 30 yrs
- Air quality 1/10 Low 0 unhealthy d/yr today · 0 by 30 yrs out
Nearby sold comps map
Loading sold comps map…
Walkable amenities ~0.75 mi
Loading nearby amenities…
Taxation est. · year 1
- Rental income
- $25,889
- − Mortgage interest
- −$17,645
- − Property taxes
- −$5,037
- − Insurance
- −$1,575
- − Repairs & maintenance
- −$2,071
- − Management
- −$2,071
- − Depreciation
- −$9,164
- Taxable loss
- −$11,674
- Est. tax savings @ 24.0%
- +$2,802
- After-tax cash flow
- $-3,181/yr
For passive investors: Depreciation is non-cash, so a rental often shows a tax loss while cash-flowing — sheltering income. Rental losses are passive: they offset passive income freely, and up to $25,000/yr can offset ordinary (W-2) income if you actively participate and your MAGI is under $100k (phasing out to $0 by $150k); unused losses carry forward. On sale, claimed depreciation is recaptured at up to 25%, and gains may owe capital-gains tax (a 1031 exchange can defer both). Figures are a year-1 estimate at your 24.0% rate — not tax advice; consult a CPA.
Schools (NCES district)
- District
- Pasco
- NCES district ID
- 1201530
- Math proficiency
- 50% ▼ -10.00%
- Reading proficiency
- 52% ▼ -5.00%
- Median HH income
- $45,039
- Composite
- 43.14/100
- National rank
- #3074
- State rank
- #32 of 73 in FL
Livability — Dade City
- Score
- 73/100
- State rank
- #307
- US rank
- #5215
Category grades
Schools grade is shown separately in the Schools card above.
Census & demographics
- Census place
- Dade City, FL
- City population
- 21,077
- Population (ZIP)
- 19,296
Population outlook (Pasco County) Hauer SSP2
- Today (2025)
- 570,045 people
- By 2030
- 605,844 · +6.3%
- By 2040
- 674,806 · +18.4%
- By 2050
- 736,022 · +29.1%
- By 2075
- 862,900 · +51.4%
- By 2100
- 906,364 · +59.0%
Race, ethnicity, and origin ACS 2023
- Neighborhood character
- Diverse neighborhood (Simpson 0.59)
- Race & ethnicity
- White 57% Hispanic / Latino 28% Black 10% Two or more races 10% Native American 3% Asian 1%
- Hispanic origin (detail)
- Mexican 21% Puerto Rican 2% Cuban 2%
- Common ancestry
- Lithuanian 5% Slovak 1% Romanian 1%
- Foreign-born
- 13% · Canada, China, Jamaica
- Languages at home
- 75% English-only · Spanish 21% Other Indo-European 2% Chinese 1%
Political lean MEDSL · Pasco
- 2024 margin
- Strong R (+25.2) · D 36.9% · R 62.1% · Other 1.0%
- 2008→2024 swing
- -21.6pp toward R · 2008: -3.6pp · 2024: -25.2pp
- All cycles
- 2024: R+25.2 2020: R+20.1 2016: R+21.6 2012: R+6.7 2008: R+3.6
Not yet ingested
- Civics
- —
Market trends
- HPI YoY
- ▲ 16.36%
- Current HPI
- 448.7
- Rent YoY
- —
- Metro
- —
- State GDP YoY
- ▲ 3.28%
- F500 in state
- 36
Industry mix (Fortune 500 HQ in FL)
| Industry | F500 HQs | Revenue |
|---|---|---|
| Industrial Technology | 2 | $29B |
|
||
| Insurance | 2 | $17B |
|
||
| Retail | 1 | $60B |
|
||
| Technology Distribution | 1 | $58B |
|
||
| Homebuilding | 1 | $35B |
|
||
| Technology Manufacturing | 1 | $35B |
|
||
Price history
+52.4% since first listed7 events — show timeline
- 2026-06-12 Listed $319,900 Stellar MLS as Distributed by MLS Grid
- 2022-12-16 Price Changed $330,000 Stellar MLS as Distributed by MLS Grid
- 2022-10-10 Price Changed $360,000 Stellar MLS as Distributed by MLS Grid
- 2022-09-13 Listed $365,665 Stellar MLS as Distributed by MLS Grid
- 2021-01-16 Sold (MLS) $211,400 Stellar MLS as Distributed by MLS Grid
- 2020-11-03 Pending — Stellar MLS as Distributed by MLS Grid
- 2020-10-17 Listed $209,900 Stellar MLS as Distributed by MLS Grid
Property tax history
+93.1%/yrLatest (2025): $5,037 · +8.4% YoY. Source: county tax records.
Cash-flow waterfall
monthlySold comps — $/sqft
last 12 mo · ≤1 miLoading sold comps…