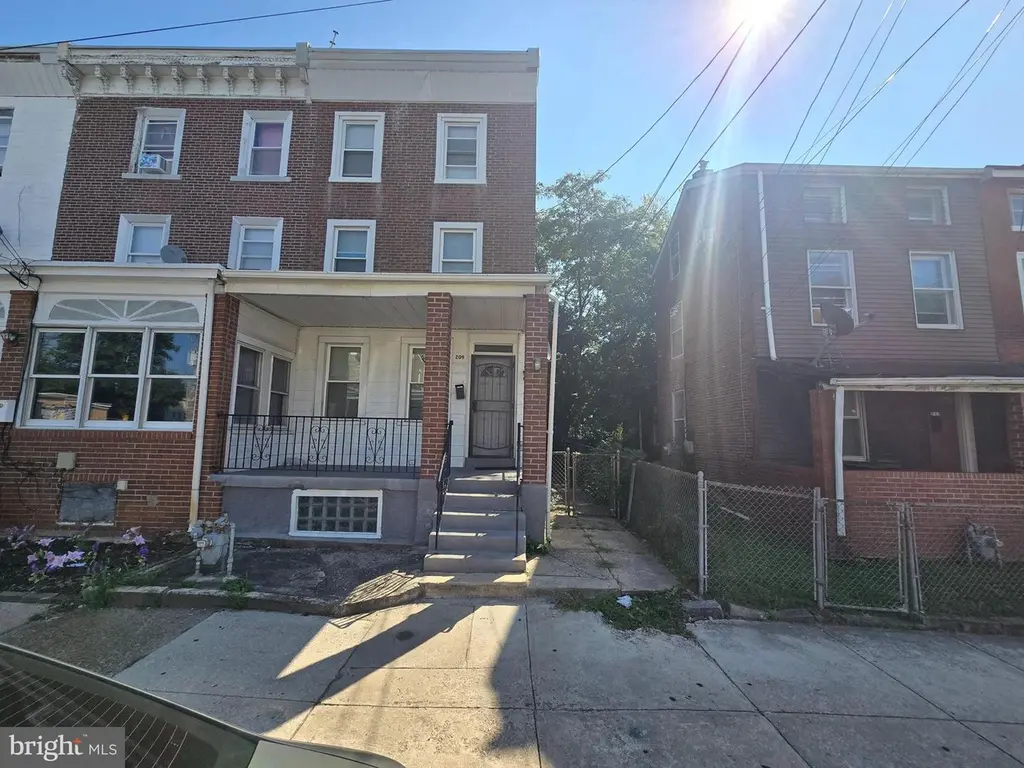
209 S 5th St · Darby, PA
Flood risk 1/10 · Minimal
- FEMA flood zone
- X (unshaded)
- Chance of flooding over 30 yrs
- 0.0%
- Est. flood insurance / yr
- $473 – $860
Fire risk 1/10 · Minimal
- Est. fire insurance / yr
- $511 – $949
Heat risk 6/10 · Moderate
- Hot days now (above 103°F)
- 7 days/yr
- Hot days in 30 yrs
- 15 days/yr
Wind risk 6/10 · Moderate
- Chance of severe wind over 30 yrs
- 27.0%
Air-quality risk 4/10 · Minor
- Unhealthy air days now
- 3 days/yr
- Unhealthy air days in 30 yrs
- 6 days/yr
Risk factors via First Street. Map © Google.
Why this score? — see what drove the D+ grade
The composite is a weighted blend of 9 inputs, each scored 0–100. Each bar is that input's sub-score; the figure is the points it added to the 100-point composite (weight × sub-score).
- Cash flow +20.1/30.0
- DSCR +6.4/10.0
- 1% rule +5.8/10.0
- Rent growth +5.0/5.0
- Livability +3.7/5.0
- Condition / age +2.5/5.0
- Schools +1.7/10.0
- ARV discount +0.0/15.0
- Appreciation +0.0/10.0
$169,800
🖨 Deal sheet (PDF) 📄 Offer letter ✓ Due diligence
Listing remarks MLS
Great opportunity for investor or owner occupant. Prices are rising outside of Philadelphia. This is a sizable home. Currently tenant occupied but notices are possible. Large enclosed front porch, large rear yard. For investors - full management reports are possible. This house is currently rented at over $1200/month and due for increase. Area rents are on the rise. Adjacent house (can be sold as package or a separately) recently rented at $1,860/month! Great opportunity to owe one or both properties as an investor only or live in one and rent the other. Lots of maintenance done in the prior years and recently. Property is well maintained and no current issues. Can be sold along with 207 S 5th St MLS: PADE2099160. Professionally Managed.
Key facts
- Built 1900
- Listed 290 days
Neighborhood map
What this means for you Summary
Snapshot
- This is a 4-bed/1.0-bath townhouse listed at $170k.
Deal economics
- At list price, monthly cash flow is $211 ($3k/yr) — positive.
- The deal already cash-flows at list — no discount required.
- Meets the 1% rule at list price ($2k rent vs $170k).
- Recommended offer: $149k (12.0% below list) — sets the bar for market timing.
- Cap rate 7.8% vs local median 6.3% in Darby — meaningfully above typical; check what's discounted (condition, days-on-market, listing class) to confirm the premium yield is real.
Location & tenants
- Location reads 74/100 on livability (#485 in PA, #4,468 nationally) — a middle-class / working-renter tenant base. Strengths: commute A+, cost of living A+, housing A+; Watch: amenities D+, employment D, crime F.
- William Penn SD (suburban): math 11% / reading 28% proficiency, ranked #491 of 539 in PA (top 91%) — low school quality limits family demand, transient renter base, plan for 1-2y turnover; 69% free/reduced lunch — lower-income household profile, screen leases tightly.
- Zoned schools: Walnut Street El Sch (math 8% / reading 17%, grade F, #1,362 of 1,518 statewide, top 92%, 303 students, 100% FRL); Penn Wood Ms (math 5% / reading 28%, grade F, #463 of 512 statewide, top 91%, 683 students, 100% FRL); Penn Wood Hs (math 25% / reading 15%, grade F, #387 of 437 statewide, top 89%, 1,170 students, 95% FRL) — zoned schools average 98% FRL vs 69% district-wide (30 pts higher); higher-poverty schools than district average — tighter screening recommended.
- Market conditions: Rents rising fast (+13.1%/yr); 98 active listings in the ZIP; 20 comparable units currently listed for rent nearby; rentals at typical pace (median 22d on market — plan ~3-4 weeks tenant-placement turnaround); 299 units permitted in Delaware County in 2024 (5 in 5+ unit buildings).
- At $1,826/mo this rent would consume 47% of the median local household income ($46k/yr) (locally 1468% of renters already pay >50% of income on rent) — very limited rent-growth headroom before tenants either downsize or default.
Forward outlook
- Local home prices are declining (-3.0%/yr); year-one equity from $1k of loan paydown is wiped out by about $5k of value loss. Plan a longer hold.
- At projected returns (-3.0% appreciation + 8.0% rent growth), your $48k cash investment doubles in ~9 years — after that, you're playing with house money.
Negotiation context
- It's been on market 290 days — a 12% lower offer ($149k) is reasonable based on typical stale-listing flexibility.
- 3 sale attempts since 21y ago; this cycle's ask has dropped $20k (11%) from the opening price — seller is motivated, your offer sets the floor, not the list.
- Current owner paid $110k; list at $170k implies a 54% gain — meaningful room to come down on a strong offer.
Risks & watch-outs
- Watch-outs: built in 1900 — expect roof / HVAC / electrical / plumbing capex.
- Climate carrying-cost: major wind risk, 27% chance of damaging wind over 30y; extreme-heat days projected 7→15/yr by 2055 (HVAC capex compounding) — expect insurance premiums to compound above CPI over the hold.
Questions for the listing agent
- It's been on market 290 days. Have you received any prior offers? Is the seller open to a 12% concession, seller financing, or rate buy-down credit?
- Built in 1900 — when were the roof, HVAC, electrical panel, plumbing, and water heater last replaced?
- Why hasn't it sold? Are there any deal-killer items the seller is aware of (foundation, flood, title, zoning, code violations)?
- Is there a deadline driving the sale (1031 exchange, divorce, estate, relocation)? That informs how much negotiation room exists.
- Schools are F-rated, which usually means shorter tenancies and higher turnover. Who's the typical renter profile here, and what's been the actual vacancy rate?
- Crime grade is F in this area — have there been break-ins, vandalism, or insurance claims at this property in the last 3 years? What carrier currently insures it and at what premium?
- The area grade is low — what's the realistic commute time and amenity access for the typical tenant pool here? Any planned neighborhood developments (good or bad) we should know about?
- What's the average days-on-market for RENTAL listings here right now (not sales)? A rising rental-DOM trend means longer vacancies and softer asking-rent achievability than the comps imply.
- What's the recent tenant-quality profile in this submarket — average credit score on applications, eviction rate, late-payment / NSF rate, and stable-employment percentage? A property-management company in the area should have these aggregated.
- How much new for-sale + rental construction is in the pipeline within 1–3 miles? Heavy new supply typically softens prices + rents 12–24 months out; constrained supply supports both.
Investment metrics
- 1% rule
- 1.08% ✓
- Cap rate
- 7.79%
- Cash-on-cash
- 5.33%
- DSCR
- 1.24
- GRM
- 7.7
CMA / ARV
- ARV (median comp)
- $144,236
- List price
- $169,800
- Delta
- 17.72%
- Verdict
- OVERPRICED
- Comps
- 20 within 1.0 mi
Show comp detail 12 sales within ~0.75 mi
| Address | Dist | Beds/Ba | Sqft | Sold | Price | $/sf | Match |
|---|---|---|---|---|---|---|---|
| 19 S 6th St | 0.14mi | 3/1.0 (-1) | 1,568 (+6%) | 3mo | $87,000 | $55 | 75 |
| 15 S Front St | 0.32mi | 3/1.0 (-1) | 1,516 (+3%) | 1mo | $202,000 | $133 | 74 |
| 104 S 3rd St | 0.14mi | 3/1.0 (-1) | 1,312 (-11%) | 1mo | $150,000 | $114 | 70 |
| 106 N 2nd St | 0.33mi | 3/1.0 (-1) | 1,556 (+6%) | 2mo | $89,000 | $57 | 68 |
| 228 Bartlett Ave | 0.54mi | 4/2.0 | 1,459 (-1%) | 3mo | $289,900 | $199 | 66 |
| 306 Berbro St | 0.30mi | 3/1.5 (-1) | 1,342 (-9%) | 2mo | $165,000 | $123 | 63 |
| 311 Laurel Rd | 0.41mi | 3/1.5 (-1) | 1,330 (-10%) | 4mo | $279,900 | $210 | 55 |
| 231 Hamilton Ave | 0.38mi | 3/1.0 (-1) | 1,260 (-14%) | 2mo | $106,000 | $84 | 51 |
| 704 Main St | 0.24mi | 5/2.5 (+1) | 1,690 (+15%) | 2mo | $220,000 | $130 | 51 |
| 334 Mulberry St | 0.62mi | 4/2.0 | 1,632 (+11%) | 0mo | $255,000 | $156 | 49 |
| 252 N 9th St | 0.50mi | 3/1.5 (-1) | 1,307 (-11%) | 4mo | $138,000 | $106 | 48 |
| 7840 Venus Pl | 0.70mi | 3/1.0 (-1) | 1,296 (-12%) | 1mo | $150,000 | $116 | 42 |
Match score weights: distance 35% · size 25% · config 20% · recency 20%. Top-matched comps best support the ARV.
Projected returns pro-forma
-3.0% appreciation · 8.0% rent growth · sell at horizon
- IRR
- -2.3%
- Equity multiple
- 0.91×
- Total profit
- $-4,347
- Equity at exit
- $25,318
- IRR
- 12.4%
- Equity multiple
- 2.21×
- Total profit
- $57,720
- Equity at exit
- $14,681
Cash invested: $47,544 (down + closing). Projections, not guarantees.
Landlord ↔ Tenant lean methodology
- Overall (STATE)
- 62 Landlord-Friendly
- State Pennsylvania
- 62 Landlord-Friendly · EVEN
- County
- — inherits STATE
- City
- — inherits STATE
ZIP-level market 19023
- Rents YoY
- 13.1%
- Active inventory
- 98
- Price-to-rent
- 7.7×
Monthly cashflow live
- Estimated rent
- $1,826 high interval (Pro) →
- Mortgage (P&I)
- −$890
- Tax from tax record
- −$270 /mo · $3,243/yr
- Insurance
- −$71
- HOA
- −$0
- Vacancy / Maint / Mgmt
- −$383
- Net cashflow
- $211
Break-even live
Sensitivity live
| Price | -10% $307 | -5% $259 | +0% $211 | +5% $163 | +10% $115 |
|---|---|---|---|---|---|
| Rent | -10% $67 | -5% $139 | +0% $211 | +5% $283 | +10% $356 |
| Rate | -1.0pp $297 | -0.5pp $254 | base $211 | +0.5pp $167 | +1.0pp $122 |
UW: 25.0% down · 7.5% · 30yr · 1.5% tax · 5.0% vac · 8.0% maint · 8.0% mgmt
Financing live
Cash to close
- Down payment
- $42,450
- Closing costs
- $5,094
- Reserves months
- —
- Total cash needed
- —
Loan-product check · same deal, 3 products live
Conventional
25% down · 7.5% · 30yr
- Down + closing
- —
- Monthly P&I
- —
- Monthly cashflow
- —
- DSCR
- —
- Eligible?
- —
Personal DTI + credit; lowest rate.
DSCR
20% down · 8.5% · 30yr
- Down + closing
- —
- Monthly P&I
- —
- Monthly cashflow
- —
- DSCR
- —
- Eligible?
- —
No personal income docs; deal must DSCR.
Hard money
10% down · 12.0% · 12mo
- Down + closing
- —
- Monthly P&I
- —
- Monthly cashflow
- —
- DSCR
- —
- Eligible?
- —
Short-term bridge; refi at stabilization.
Rent comps 20 comps
| Address | Beds | Baths | Sqft | Rent | $/sqft | DOM | Units | Dist |
|---|---|---|---|---|---|---|---|---|
| 94 S 6th St Darby, PA | 3.0 | 1.5 | 1666 | $2,000 | $1.20 | 26d | 1 | 0.14mi |
| 304 S 3rd St Darby, PA | 3.0 | 1.0 | 1602 | $1,695 | $1.06 | 45d | 1 | 0.14mi |
| 304 S 3rd St Darby, PA | 3.0 | 1.0 | 1602 | $1,595 | $1.00 | 22d | 1 | 0.14mi |
| 69 S 7th St Darby, PA | 3.0 | 2.0 | 1446 | $1,700 | $1.18 | 45d | 1 | 0.25mi |
| 412 S 2nd St Darby, PA | 3.0 | 1.0 | 1190 | $1,100 | $0.92 | 7d | 1 | 0.26mi |
| 417 S 2nd St Darby, PA | 3.0 | 1.0 | 1190 | $1,020 | $0.86 | 7d | 1 | 0.30mi |
| 209 Hamilton Ave Darby, PA | 4.0 | 1.0 | 1400 | $1,595 | $1.14 | 16d | 1 | 0.37mi |
| 534 S 4th St Darby, PA | 3.0 | 1.0 | 1500 | $1,695 | $1.13 | 0d | 1 | 0.38mi |
| 220 N 9th St Darby, PA | 5.0 | 1.5 | 1600 | $2,800 | $1.75 | 7d | 1 | 0.48mi |
| 909 Springfield Rd Unit D Darby, PA | 4.0 | 1.0 | 900 | $1,600 | $1.78 | 45d | 1 | 0.51mi |
| 924 Maple Ter Darby, PA | 3.0 | 1.5 | 1190 | $2,000 | $1.68 | 7d | 1 | 0.53mi |
| 935 Maple Ter Darby, PA | 3.0 | 1.0 | 1266 | $1,585 | $1.25 | 7d | 1 | 0.55mi |
| 935 Maple Ter Darby, PA | 3.0 | 1.0 | 1266 | $1,585 | $1.25 | 12d | 1 | 0.55mi |
| 2 Winthrop Rd Darby, PA | 3.0 | 1.5 | 1224 | $1,900 | $1.55 | 23d | 1 | 0.84mi |
| 37 Concord Rd Darby, PA | 3.0 | 1.0 | 1120 | $1,795 | $1.60 | 45d | 1 | 1.00mi |
| 118 Felton Ave Darby, PA | 3.0 | 1.0 | 1152 | $1,750 | $1.52 | 23d | 1 | 1.06mi |
| 112 Juliana Ter Darby, PA | 3.0 | 1.0 | 1020 | $2,450 | $2.40 | 26d | 1 | 1.09mi |
| 112 Juliana Ter Darby, PA | 3.0 | 1.0 | 1020 | $2,350 | $2.30 | 46d | 1 | 1.09mi |
| 619 Baily Rd Lansdowne, PA | 3.0 | 1.0 | 1288 | $1,850 | $1.44 | 20d | 1 | 1.43mi |
| 820 Greenhill Rd Sharon Hill, PA | 4.0 | 2.0 | 1184 | $2,600 | $2.20 | 7d | 1 | 1.48mi |
Listing history 24 events
-
2026-06-21days on market $169,800 Active 290 DOM
-
2026-06-18days on market $169,800 Active 287 DOM
-
2026-06-17days on market $169,800 Active 286 DOM
-
2026-06-16days on market $169,800 Active 285 DOM
-
2026-06-15days on market $169,800 Active 284 DOM
-
2026-06-13days on market $169,800 Active 282 DOM
-
2026-06-13days on market $169,800 Active 281 DOM
-
2026-06-09days on market $169,800 Active 278 DOM
-
2026-06-08days on market $169,800 Active 277 DOM
-
2026-06-07days on market $169,800 Active 276 DOM
-
2026-06-04days on market $169,800 Active 273 DOM
-
2026-06-03days on market $169,800 Active 272 DOM
-
2026-06-02days on market $169,800 Active 271 DOM
-
2026-06-01days on market $169,800 Active 270 DOM
-
2026-05-31days on market $169,800 Active 269 DOM
-
2025-11-10price $169,800 747-char remark
Show marketing remark (747 chars)
Great opportunity for investor or owner occupant. Prices are rising outside of Philadelphia. This is a sizable home. Currently tenant occupied but notices are possible. Large enclosed front porch, large rear yard. For investors - full management reports are possible. This house is currently rented at over $1200/month and due for increase. Area rents are on the rise. Adjacent house (can be sold as package or a separately) recently rented at $1,860/month! Great opportunity to owe one or both properties as an investor only or live in one and rent the other. Lots of maintenance done in the prior years and recently. Property is well maintained and no current issues. Can be sold along with 207 S 5th St MLS: PADE2099160. Professionally Managed.
-
2025-09-04$189,900 Active 747-char remark
Show marketing remark (747 chars)
Great opportunity for investor or owner occupant. Prices are rising outside of Philadelphia. This is a sizable home. Currently tenant occupied but notices are possible. Large enclosed front porch, large rear yard. For investors - full management reports are possible. This house is currently rented at over $1200/month and due for increase. Area rents are on the rise. Adjacent house (can be sold as package or a separately) recently rented at $1,860/month! Great opportunity to owe one or both properties as an investor only or live in one and rent the other. Lots of maintenance done in the prior years and recently. Property is well maintained and no current issues. Can be sold along with 207 S 5th St MLS: PADE2099160. Professionally Managed.
-
2020-04-13soldstatus $110,000
-
2017-01-31historical
-
2016-10-14$26,500
-
2005-12-15soldstatus $72,000
-
2005-11-30soldstatus $72,000
-
2005-11-10historical
-
2005-10-03$72,000
ⓘ Source: listings_history table (triggers on properties + properties_extension) + one-shot
backfill from property_details.listing_events for pre-trigger history.
Tax reassessment forecast PA · Partial reset (capped growth)
- Current annual tax
- $3,243 · $270/mo
- Projected year-2 tax
- $3,243 · $270/mo
- Expected delta
- $0/yr ($0/mo · 0.0%)
ⓘ Screening estimate from a state-policy table — verify with the county assessor before closing.
Climate risk First Street
- Flood 1/10 Low FEMA zone X (unshaded) · 0% chance over 30 yrs
- Wildfire 1/10 Low
- Heat 6/10 Major 7 d/yr ≥103°F today · 15 d/yr by 30 yrs out
- Wind 6/10 Major 27% chance of damaging wind over 30 yrs
- Air quality 4/10 Moderate 3 unhealthy d/yr today · 6 by 30 yrs out
Nearby sold comps map
Loading sold comps map…
Walkable amenities ~0.75 mi
Loading nearby amenities…
Taxation est. · year 1
- Rental income
- $21,914
- − Mortgage interest
- −$9,511
- − Property taxes
- −$3,243
- − Insurance
- −$849
- − Repairs & maintenance
- −$1,753
- − Management
- −$1,753
- − Depreciation
- −$4,940
- Taxable loss
- −$135
- Est. tax savings @ 24.0%
- +$32
- After-tax cash flow
- $2,567/yr
For passive investors: Depreciation is non-cash, so a rental often shows a tax loss while cash-flowing — sheltering income. Rental losses are passive: they offset passive income freely, and up to $25,000/yr can offset ordinary (W-2) income if you actively participate and your MAGI is under $100k (phasing out to $0 by $150k); unused losses carry forward. On sale, claimed depreciation is recaptured at up to 25%, and gains may owe capital-gains tax (a 1031 exchange can defer both). Figures are a year-1 estimate at your 24.0% rate — not tax advice; consult a CPA.
Schools (NCES district)
- District
- William Penn SD
- NCES district ID
- 4226390
- Math proficiency
- 11% ▼ -3.00%
- Reading proficiency
- 28% ▼ -7.00%
- Median HH income
- $48,543
- Composite
- 17.29/100
- National rank
- #9086
- State rank
- #491 of 539 in PA
Livability — Darby
- Score
- 74/100
- State rank
- #485
- US rank
- #4468
Category grades
Schools grade is shown separately in the Schools card above.
Census & demographics
- Census place
- Darby, PA
- County
- Delaware County · 399,863 people
- Metro
- Philadelphia-Camden-Wilmington, PA-NJ-DE-MD
- Population (ZIP)
- 22,247
- Household income
- $46,463
- Rent vs Own
- Severe rent burden
- 1468.0
Population outlook (Delaware County) Hauer SSP2
- Today (2025)
- 577,490 people
- By 2030
- 581,243 · +0.6%
- By 2040
- 584,700 · +1.2%
- By 2050
- 586,581 · +1.6%
- By 2075
- 598,706 · +3.7%
- By 2100
- 590,823 · +2.3%
Race, ethnicity, and origin ACS 2023
- Neighborhood character
- Predominantly Black (76%)
- Race & ethnicity
- Black 76% White 15% Two or more races 5% Hispanic / Latino 3% Asian 2%
- Common ancestry
- Swiss 5% Hispanic 1% Romanian 1%
- Foreign-born
- 18% · Canada
- Languages at home
- 84% English-only · French/Haitian/Cajun 4% Spanish 3% Other Asian/Pacific 1%
Political lean MEDSL · Delaware
- 2024 margin
- Strong D (+23.7) · D 61.4% · R 37.6% · Other 1.0%
- 2008→2024 swing
- +2.3pp toward D · 2008: 21.4pp · 2024: 23.7pp
- All cycles
- 2024: D+23.7 2020: D+26.7 2016: D+22.0 2012: D+21.8 2008: D+21.4
Not yet ingested
- Civics
- —
Market trends
- HPI YoY
- ▼ -190.50%
- Current HPI
- 277.7034
- Rent YoY
- ▲ 13.10%
- Metro
- Philadelphia-Camden-Wilmington, PA-NJ-DE-MD
- State GDP YoY
- ▲ 1.68%
- F500 in state
- 34
Industry mix (Fortune 500 HQ in PA)
| Industry | F500 HQs | Revenue |
|---|---|---|
| Healthcare | 2 | $309B |
|
||
| Insurance | 2 | $27B |
|
||
| Telecommunications / Media | 1 | $124B |
|
||
| Industrial Distribution | 1 | $22B |
|
||
| Financial Services | 1 | $20B |
|
||
| Chemicals / Materials | 1 | $18B |
|
||
Price history
+135.8% since first listed9 events — show timeline
- 2025-11-10 Price Changed $169,800 BRIGHT MLS
- 2025-09-04 Listed $189,900 BRIGHT MLS
- 2020-04-13 Sold (Public Records) $110,000 Public Records
- 2017-01-31 Listing Removed — BRIGHT MLS
- 2016-10-14 Listed $26,500 BRIGHT MLS
- 2005-12-15 Sold (Public Records) $72,000 Public Records
- 2005-11-30 Sold (MLS) $72,000 BRIGHT MLS
- 2005-11-10 Listing Removed — BRIGHT MLS
- 2005-10-03 Listed $72,000 BRIGHT MLS
Property tax history
+1.4%/yrLatest (2026): $3,243 · -0.5% YoY. Source: county tax records.
Cash-flow waterfall
monthlySold comps — $/sqft
last 12 mo · ≤1 miLoading sold comps…